


Rents Are Up, But Haven’t Reached Pre-Covid Peak
The NYC rental market continues to rebound as the effects of the Covid-19 pandemic on the real estate market subside. However, according to a new data study from RentHop, rent prices are still cheaper in Q2 2021 vs. Q2 2020.
According to the RentHop Rental Report this quarter:
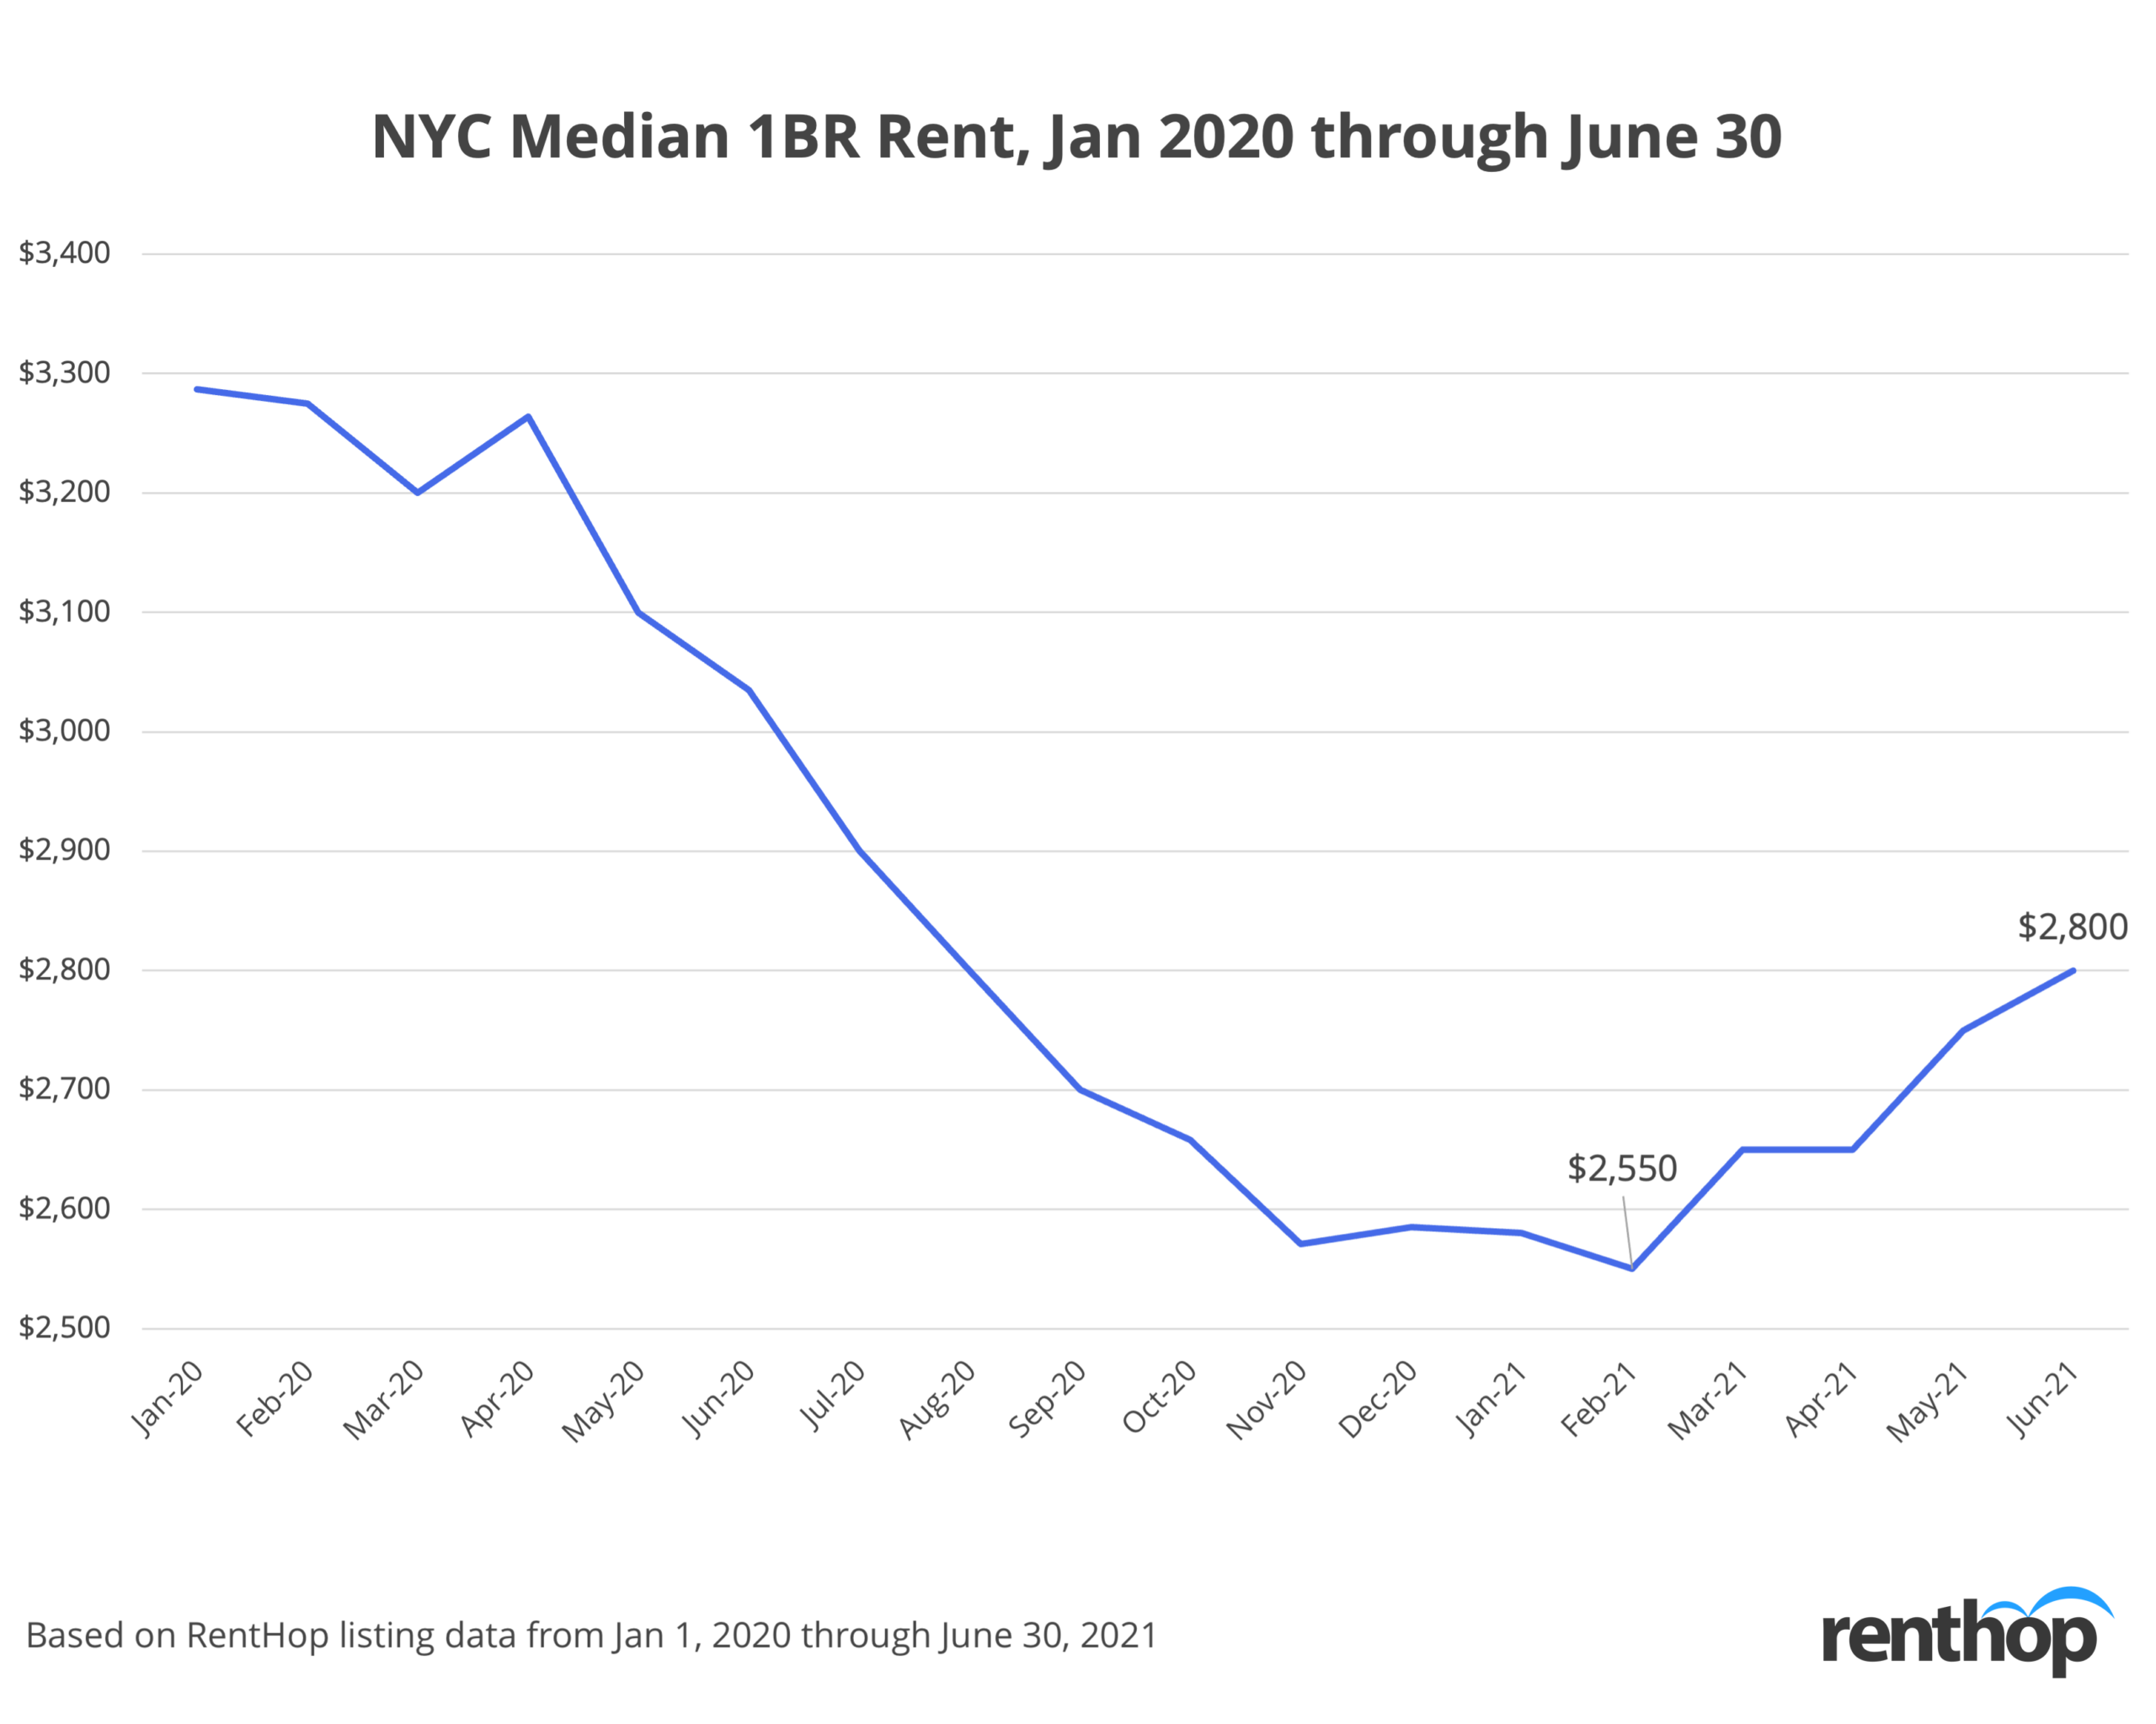
- The median in June 2021 was 7.7% lower than where it was a year ago.
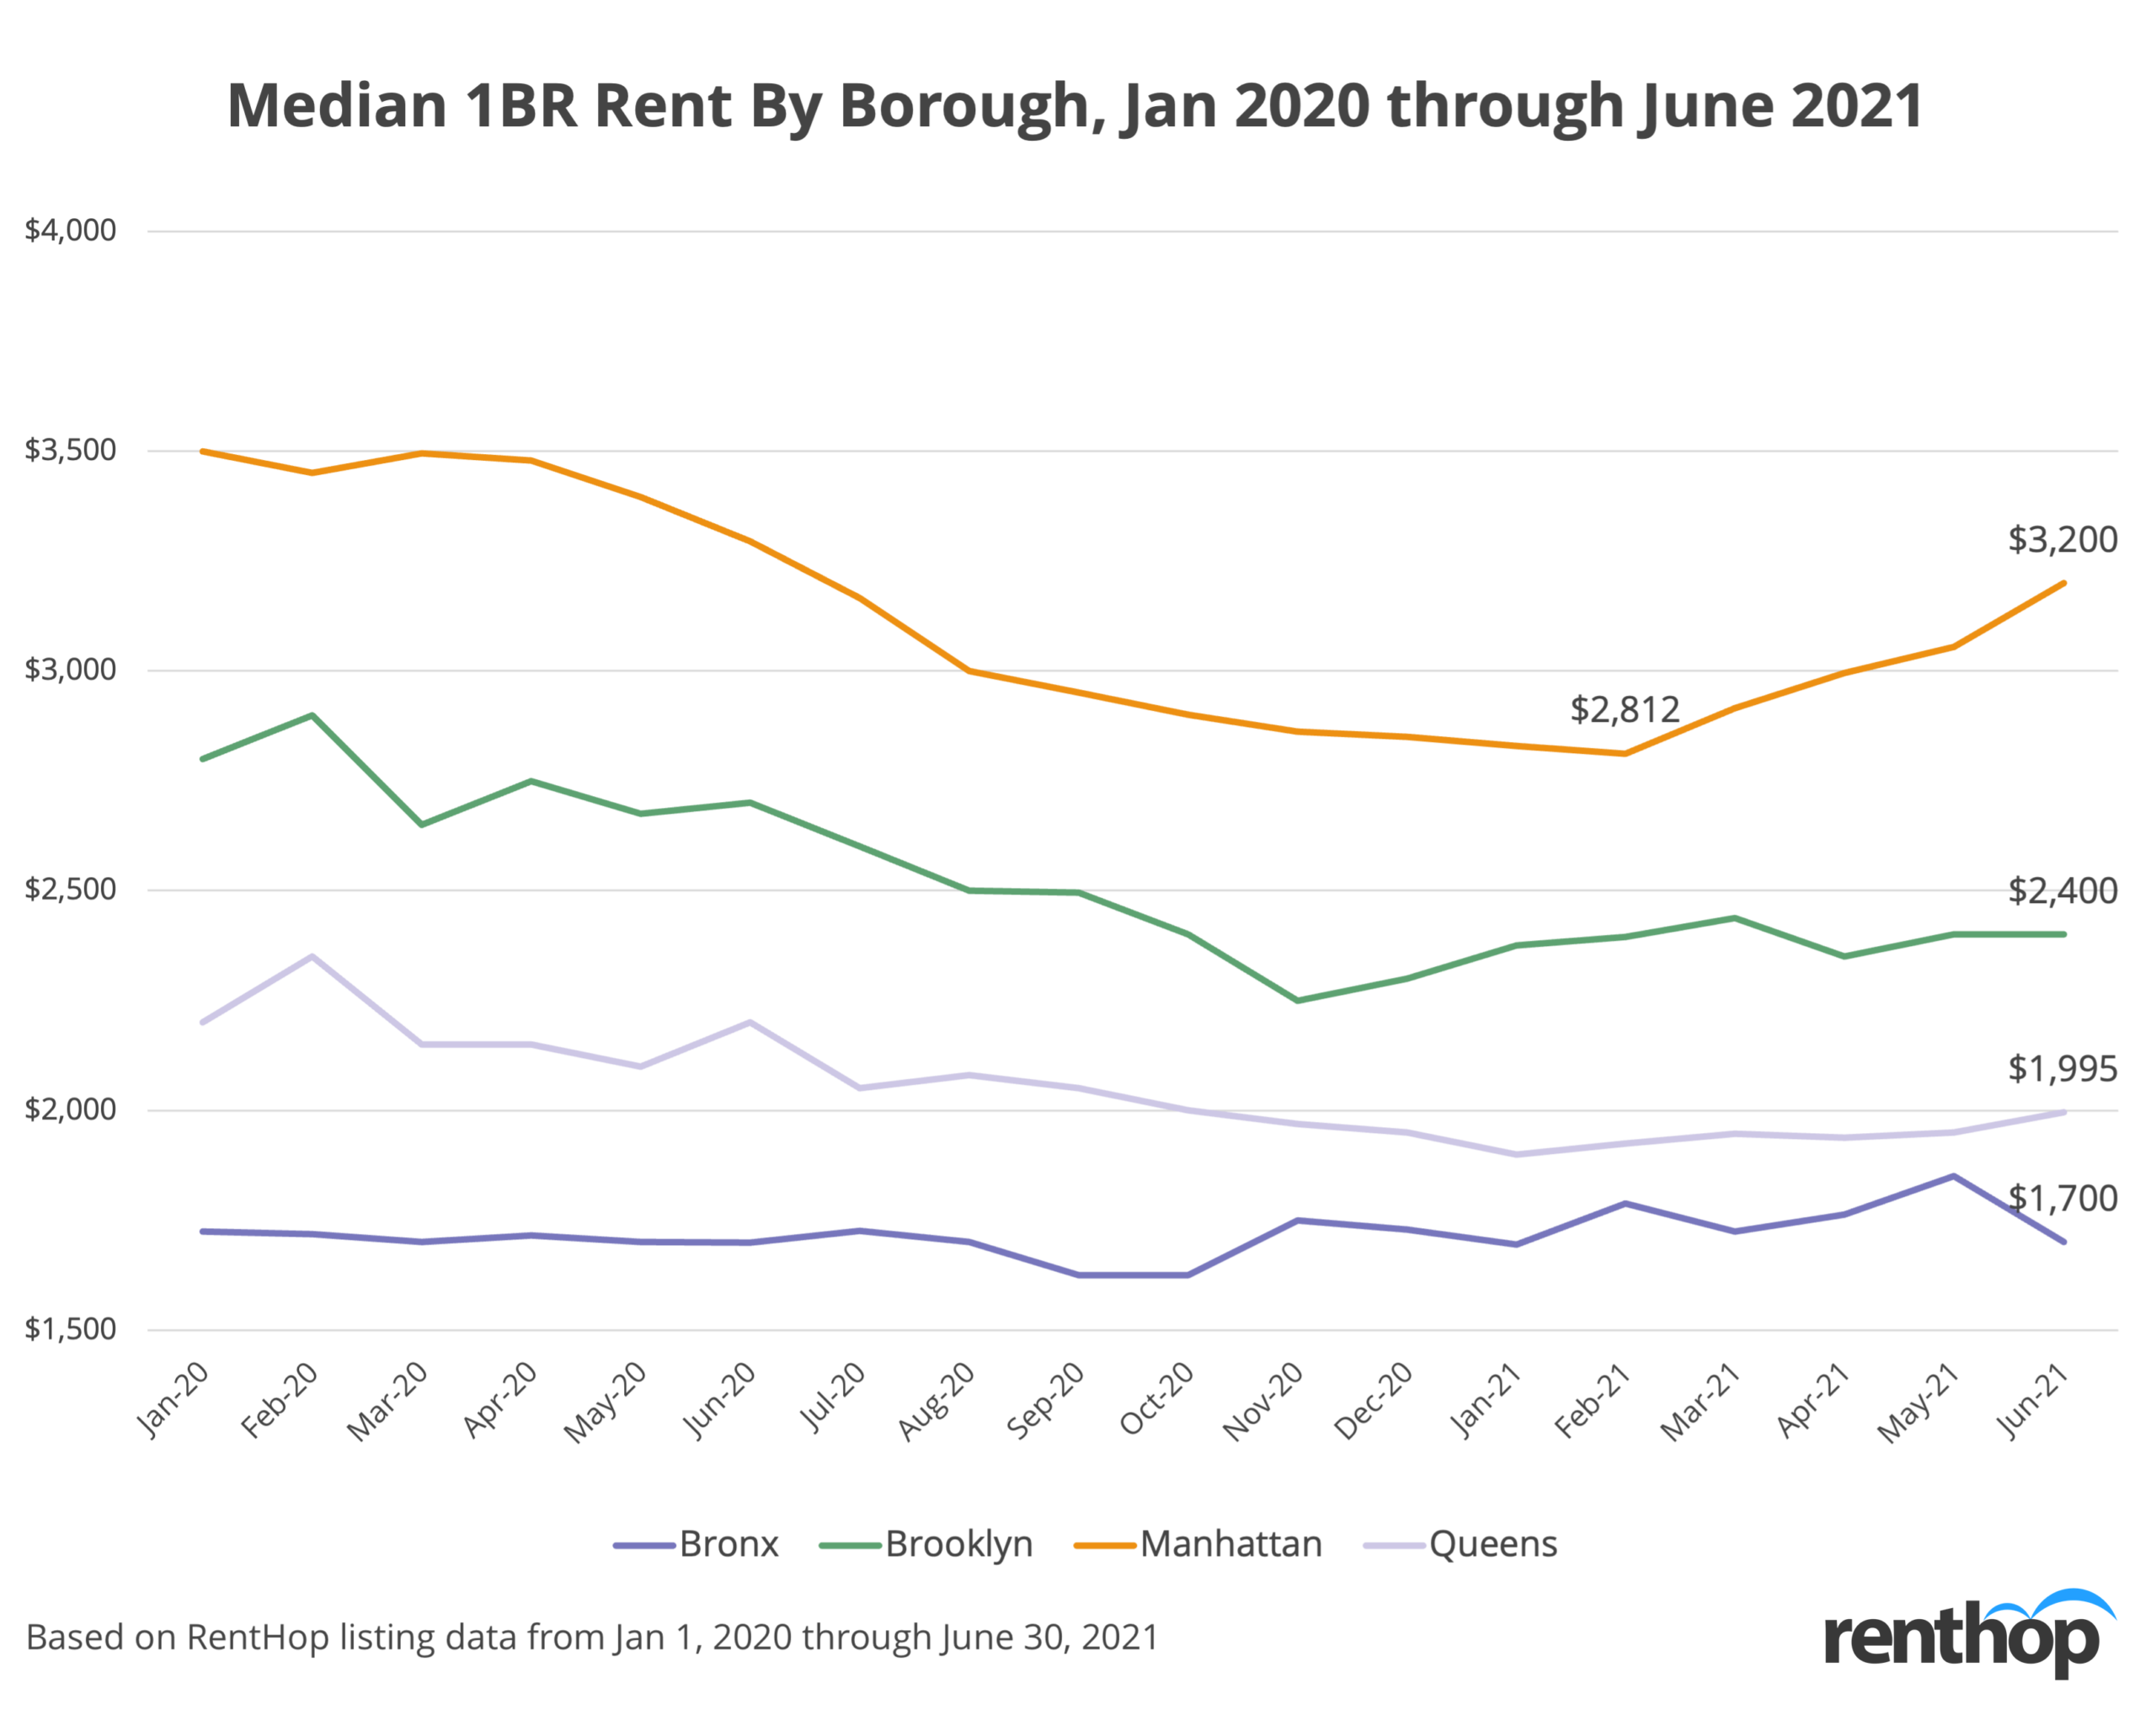
- In Manhattan, median 1BR rent fell just 2.9% year-over-year as landlords slowly hike up prices and fill vacancies.
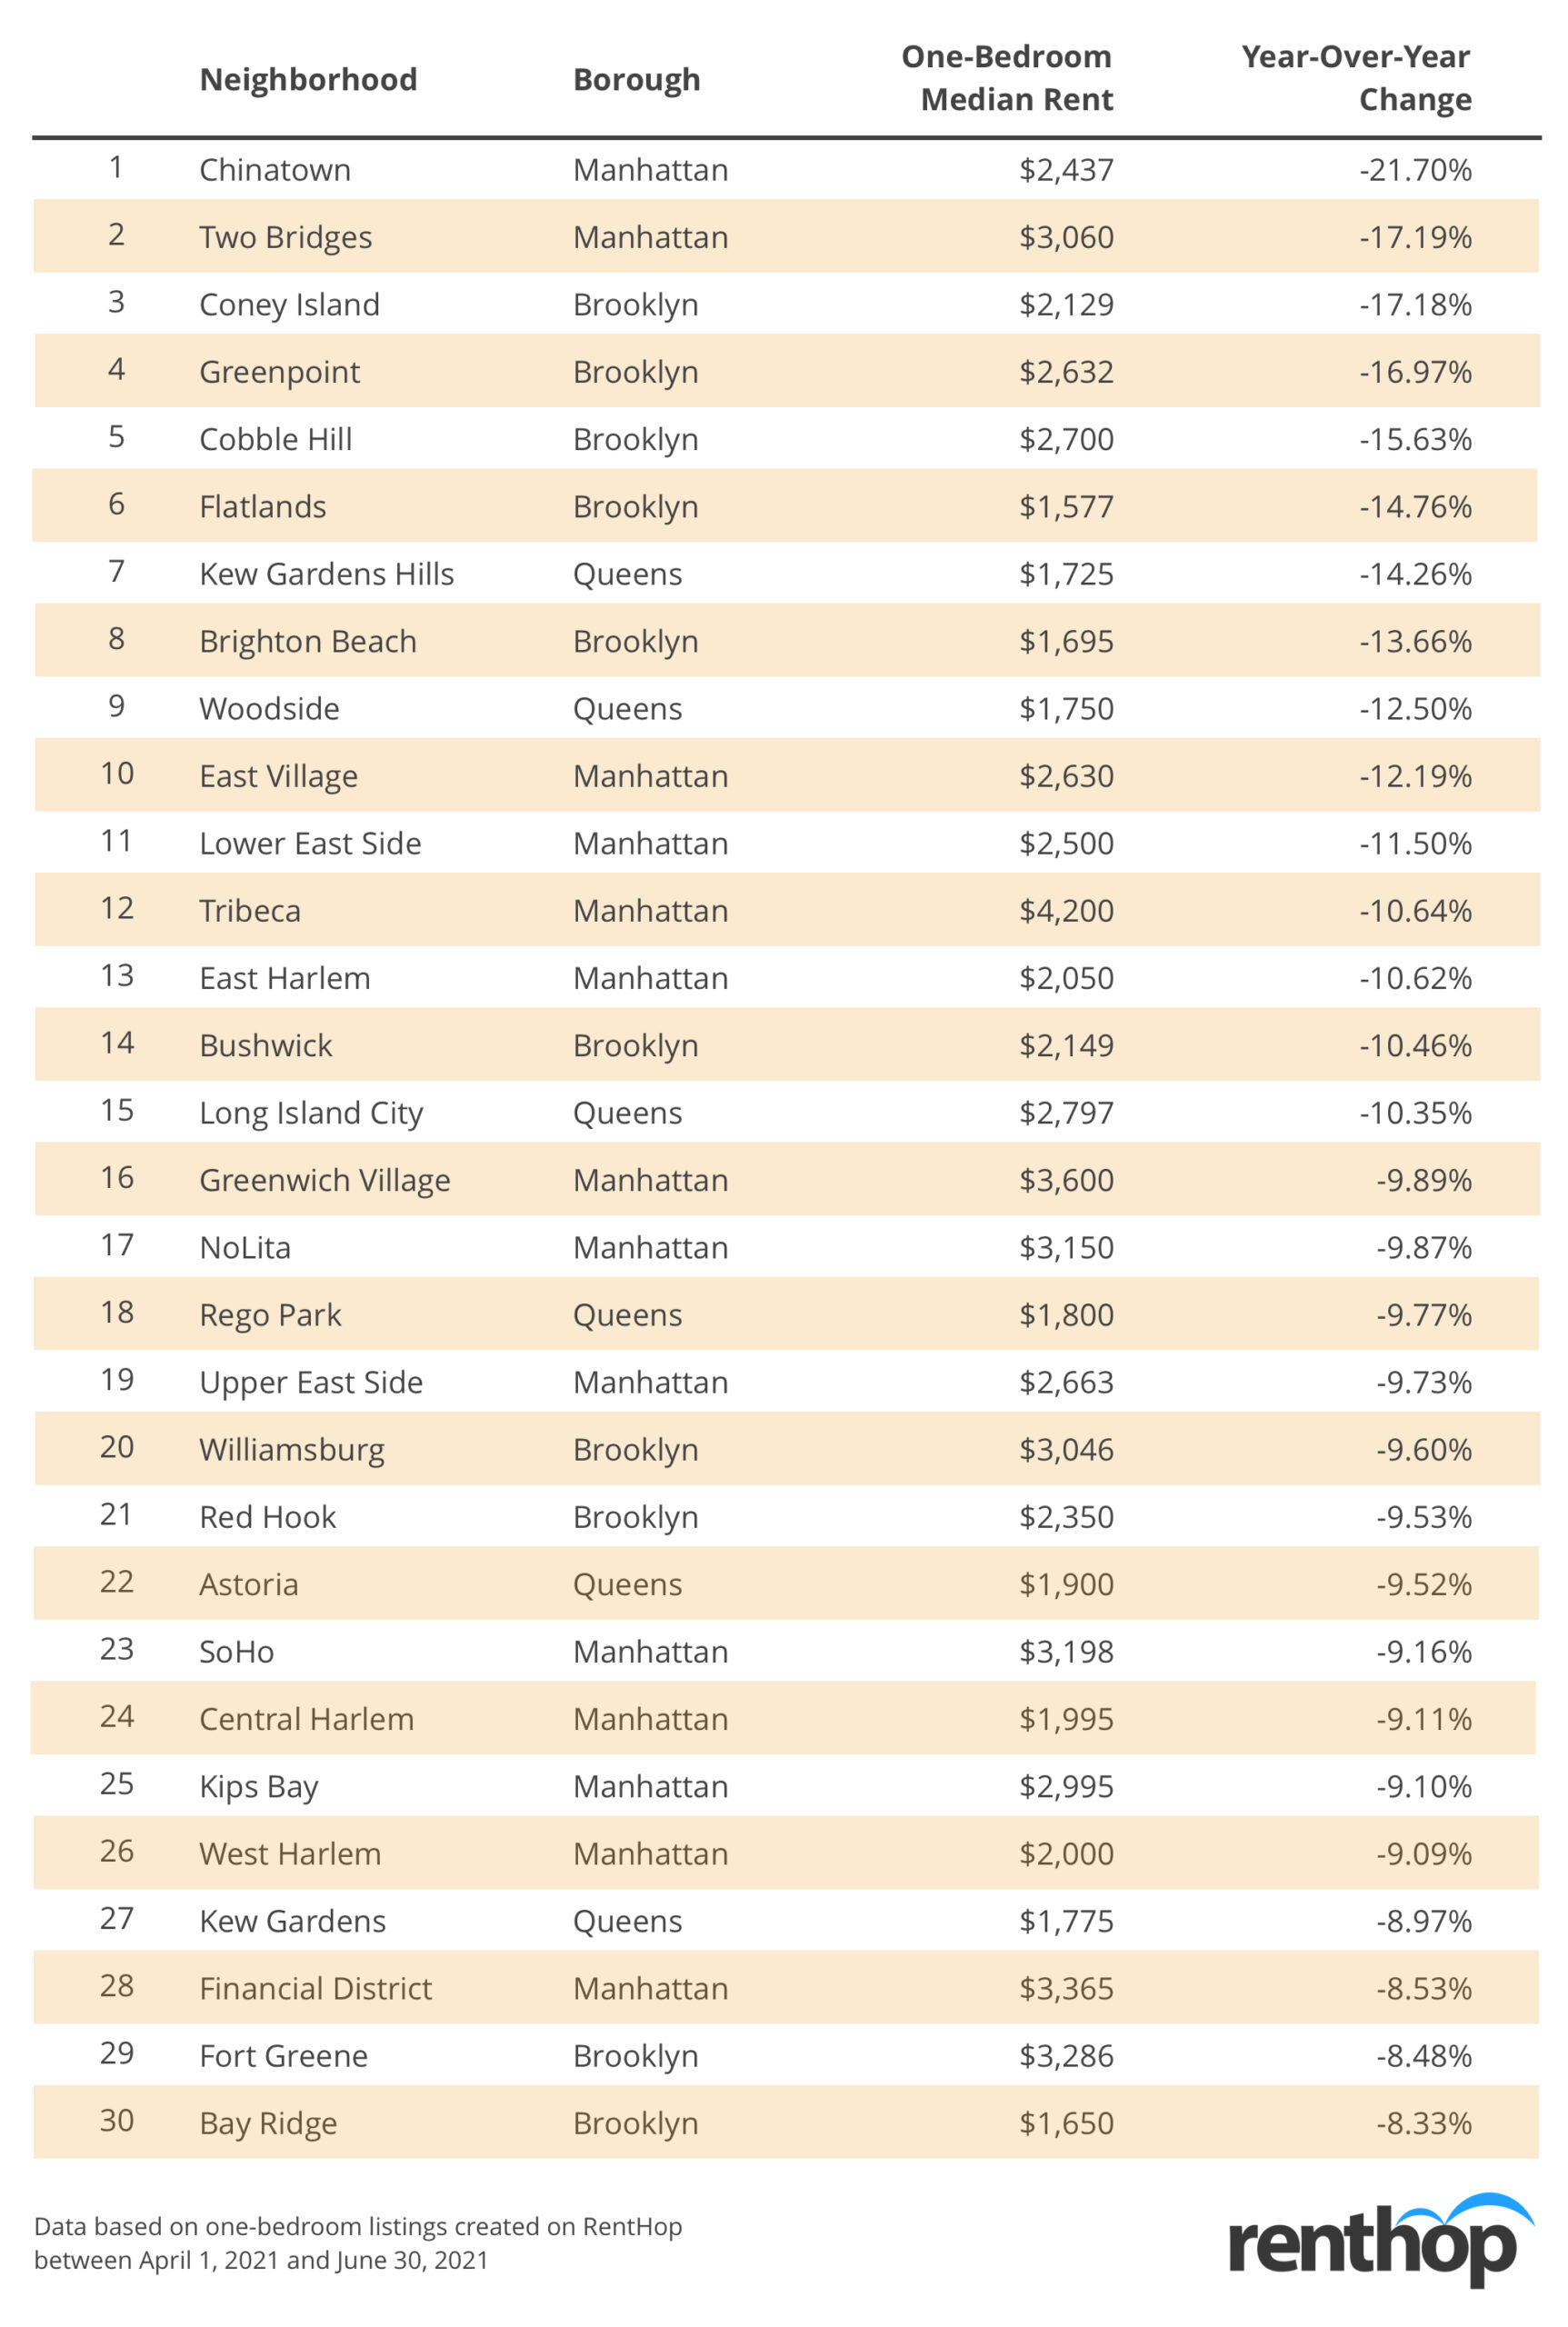
- Manhattan neighborhoods with the most drastic declines in rental prices include Chinatown (YoY demand -21.7%), Two Bridges (17.2%), East Village (-12.2%), and Lower East Side (-11.5%).
- In Brooklyn and Queens, median 1 bedroom rents fell 11.1% and 9.3% year-over-year, respectively. Coney Island (-21.43%) and Kew Gardens (-14.3%) are the neighborhoods that saw the biggest price changes in each borough.
- The Bronx was the only borough that showed a steady increase in rental prices.
- While year-over-year rents are down across the city, median 1BR rent was up 1.82% month-over-month from $2,750 in May to $2,800 in June 2021. We expect prices to keep climbing as more of the city’s population gets vaccinated, and cyclical rental demand increases in the summer months.
Manhattan Market
New Yorkers are still taking advantage of affordable city rent even though many neighborhoods across the five boroughs experienced an uptick in prices throughout 2021 so far. And some of the priciest neighborhoods are considerably less expensive when compared to the previous year. Upper West Side, Upper East Side, and Tribeca exemplify the trend.
Meanwhile, median 1BR rents are just 2.9% below where they were a year ago when there were record price declines. This year, it’s a different scenario: lease signings are up and landlords are pulling back on rent concessions.
NYC’s rental market is turning the corner
Rental prices have climbed roughly 8.5% since January 2021. Given the recent success of the vaccine rollout, coupled with Manhattan’s summer spike in activity, we expect rents to climb again in the autumn months and defy the fall season’s traditional market chill.
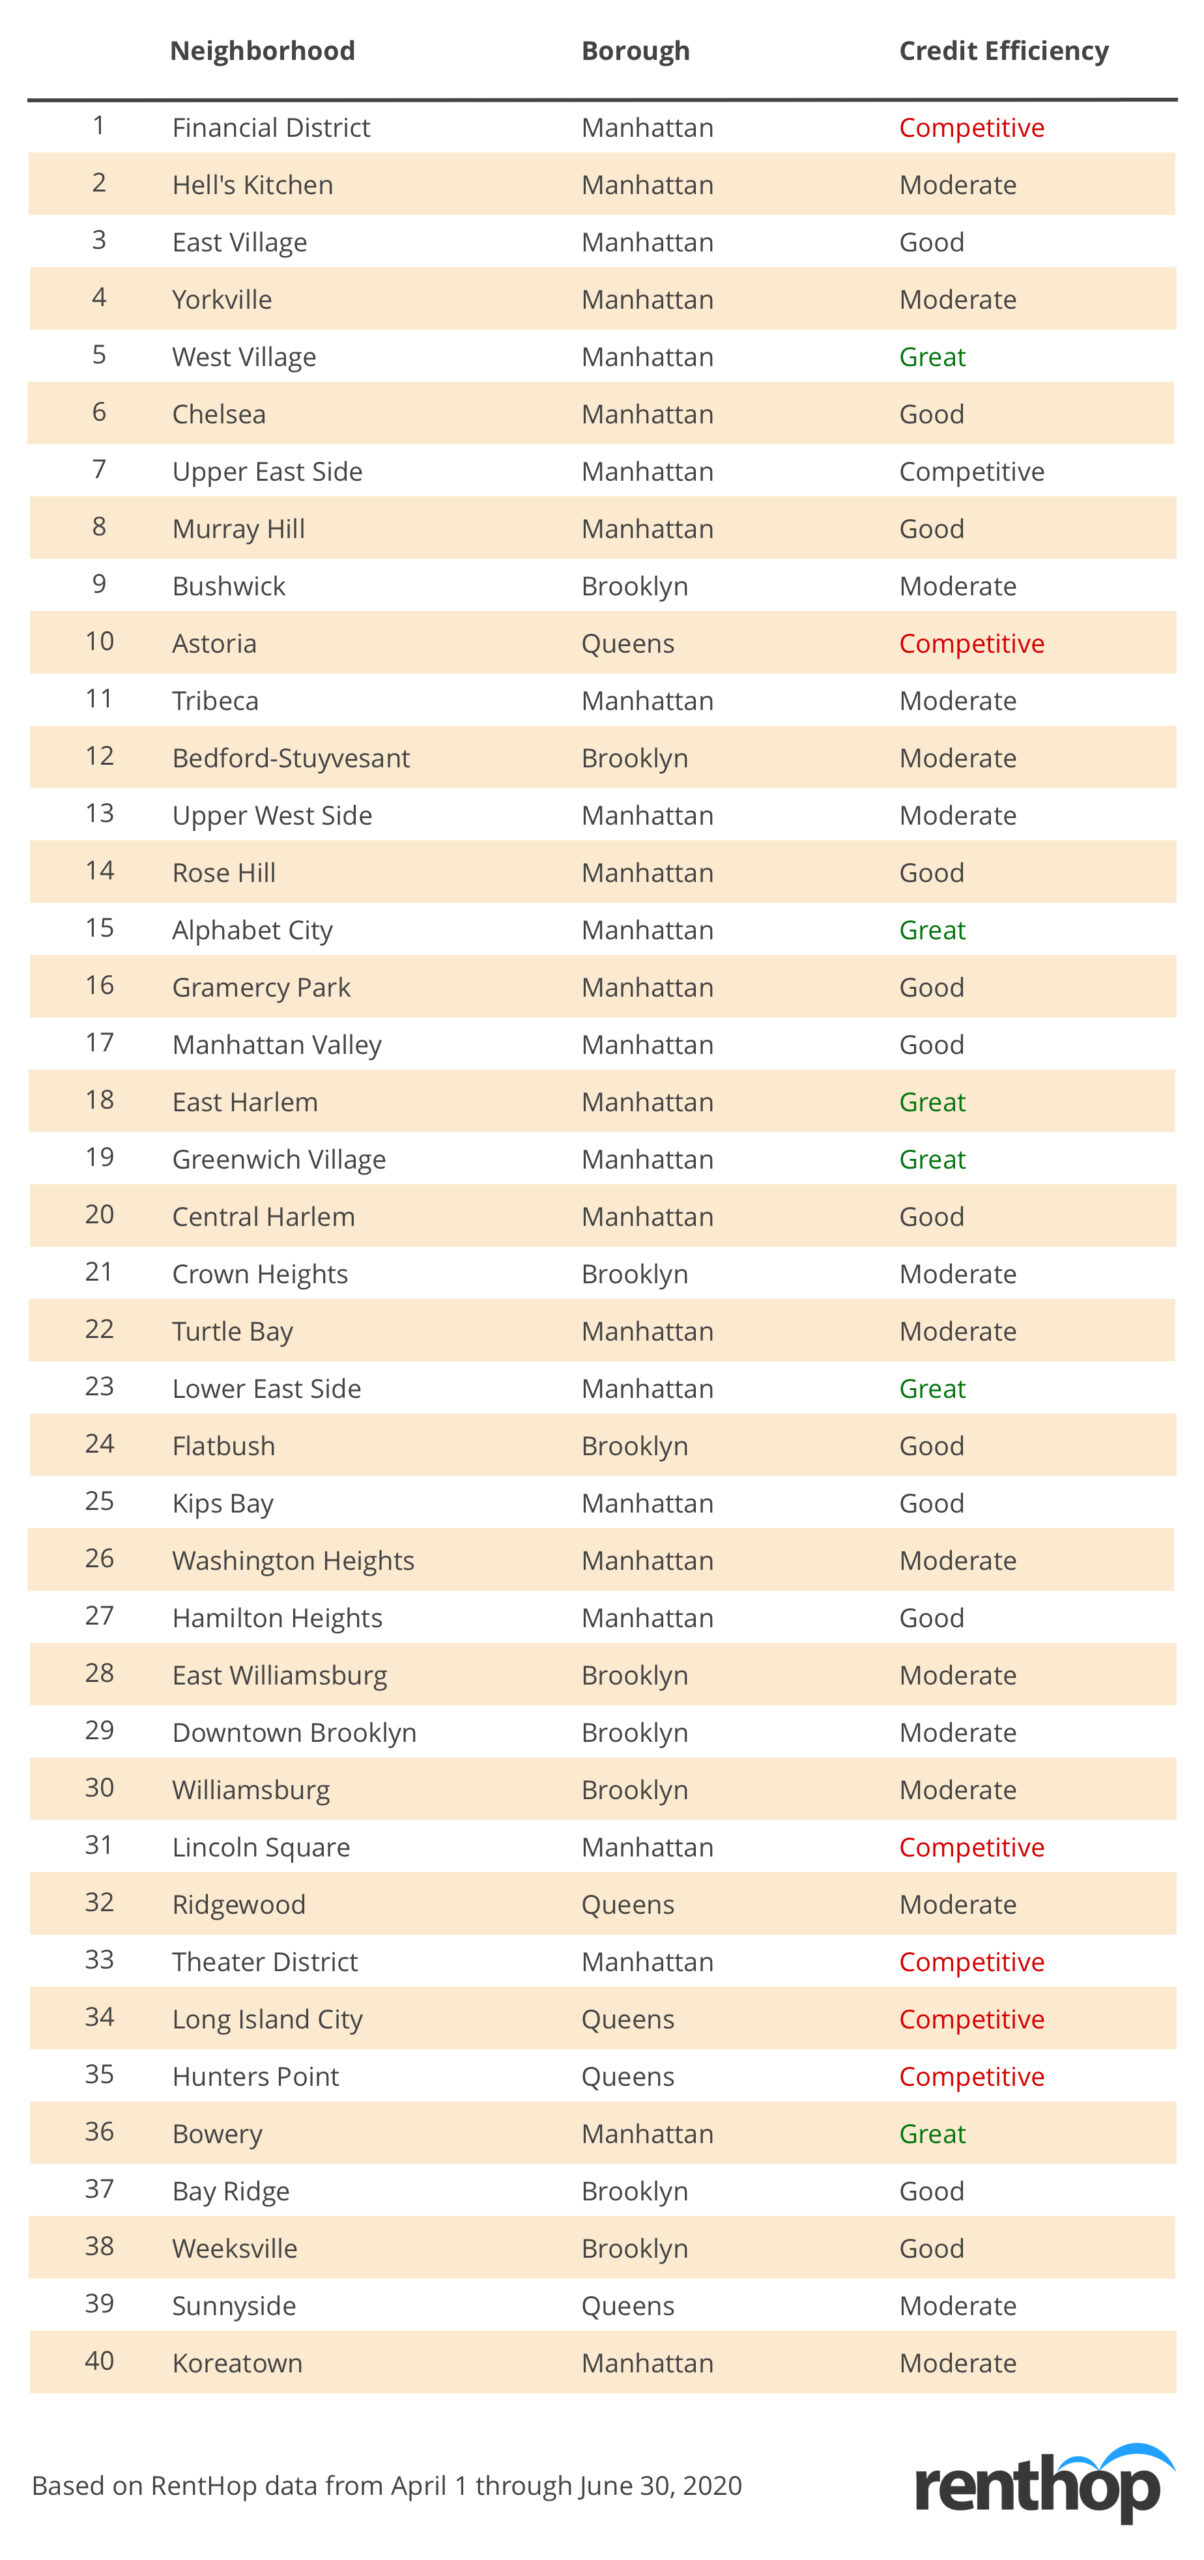
Most Popular NYC Neighborhoods by Lead Generation and How Competitive They Are
Top Growing Neighborhoods
Demand for full apartments in Manhattan has gone up significantly as people flock back to the city. Neighborhoods that saw the biggest spikes in inquiries include NoHo, TriBeCa, K-town, Theather District, and Greenwich Village. Meanwhile, leads went up over 400% year-over-year in Downtown Brooklyn, a neighborhood known for high-rise apartment rental buildings.
Top Declining Neighborhoods
As demand for rentals in Manhattan grows, the number of inquires in outer-borough neighborhoods that are farther away from the city center drops. Inquiries dropped 73.4% in Kew Gardens Hills, Queens. Other neighborhoods experiencing lower lead volumes this quarter compared to last year include Flatlands (Brooklyn), Borough Park (Brooklyn), Concourse (Bronx), Corona (Queens), Rockaway Beach (Queens), and Coney Island (Brooklyn).
Methodology
Released on a quarterly basis, the RentHop Rental Report analyzes the NYC rental market using the platform’s rental listings and traffic data. The lead volume, most inquired apartment type, and year-over-year changes are determined based on inquiries sent by renters visiting the RentHop site. The median asking rent is calculated using all listings created between April 1, 2021, and June 30, 2021, across all apartment types, whereas median 1BR rent is calculated using only one-bedroom listings created during the same time period. Please email press@renthop.com for a detailed report covering all NYC neighborhoods. Note that, unlike other RentHop studies that analyze and summarize data using the Neighborhood Tabulation Areas, the RentHop Rental Report adopts a more granular neighborhood shapefile for the analysis, which is consistent with the listing search criteria on the consumer side.


