


RentHop Rental Report – Q2 2020
The NYC housing market continues to suffer in Q2 2020 as the COVID-19 pandemic persists. Given the unprecedented health, economic, and social disruptions inflicted upon the city, it should come as no surprise that NYC apartment hunters are changing their preferences as to where to live and landlords are forced to adapt by reducing rents.
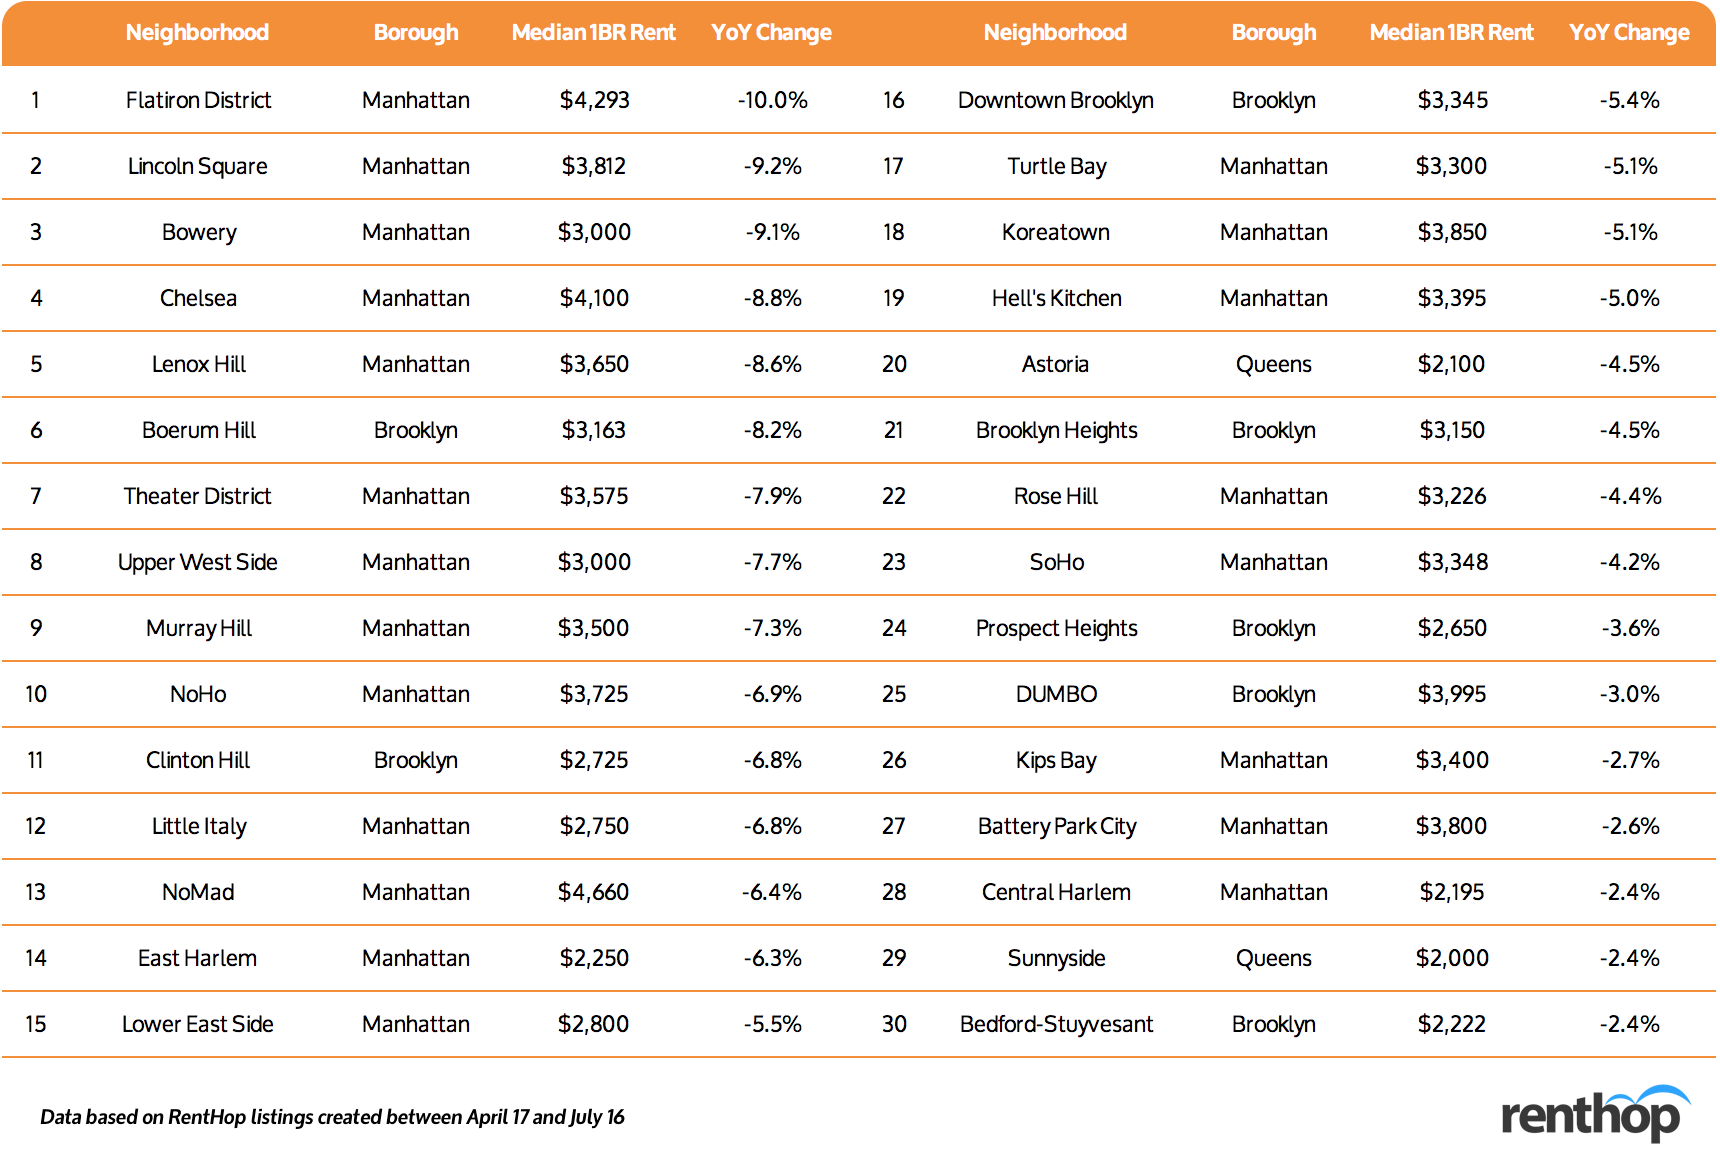
Manhattan Market Softened, with Median 1BR Rent Lowered by 5% Year-over-Year
The coronavirus pandemic has had severe impacts on the New York City housing market. Many neighborhoods across the five boroughs experienced price reduction due to reduced demand. Specifically, in Manhattan, one of the most expensive real estate markets in the nation, rent dropped in most luxury neighborhoods, including Chelsea, Flatiron, and NoMad. The borough saw a 5% decrease in median 1BR rent, and some premium neighborhoods saw even more drastic cuts, as landlords increased concessions to attract renters. The weak demand will likely continue as the pandemic remains a threat and companies extend their remote-working policies.
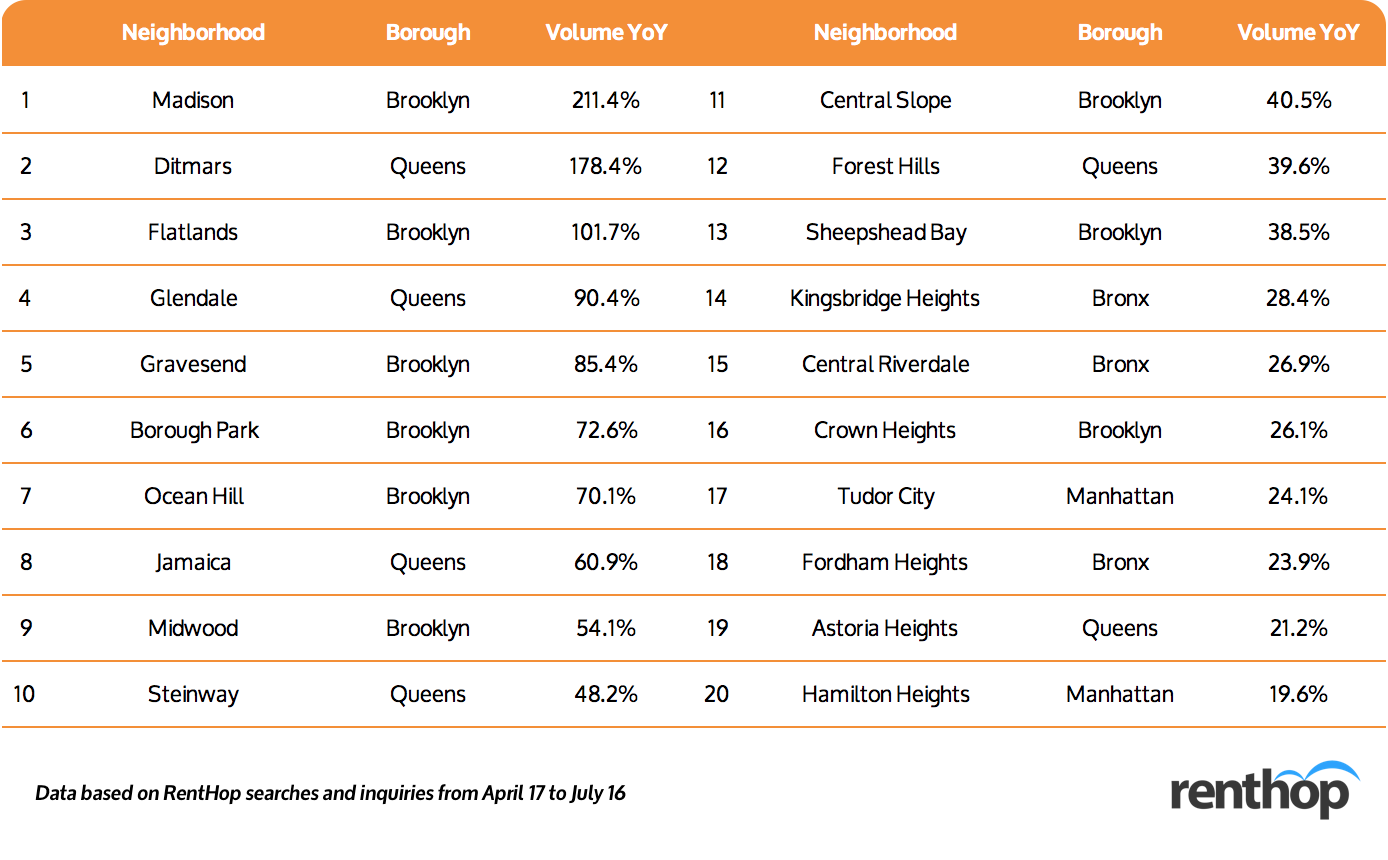
Renter Interest Shifted to Outer Boroughs
Meanwhile, rental demand seemed less affected by COVID-19 in outer boroughs. In Brooklyn, specifically, searches were only down by 8.1% year-over-year, and some neighborhoods farther away from the city center even saw spikes in inquiries, including Ocean Hill (+70.1%), Central Slope (+40.5%), Crown Heights (+26.1%), and East Flatbush (+15.8%). In Queens, similarly, demand was slightly affected by the pandemic, pushing the searches down by 7.8% year-over-year. Demand, however, soared in affordable neighborhoods including Steinway (+48.2%), Forest Hill (+39.6%), and Astoria (+10.5%).
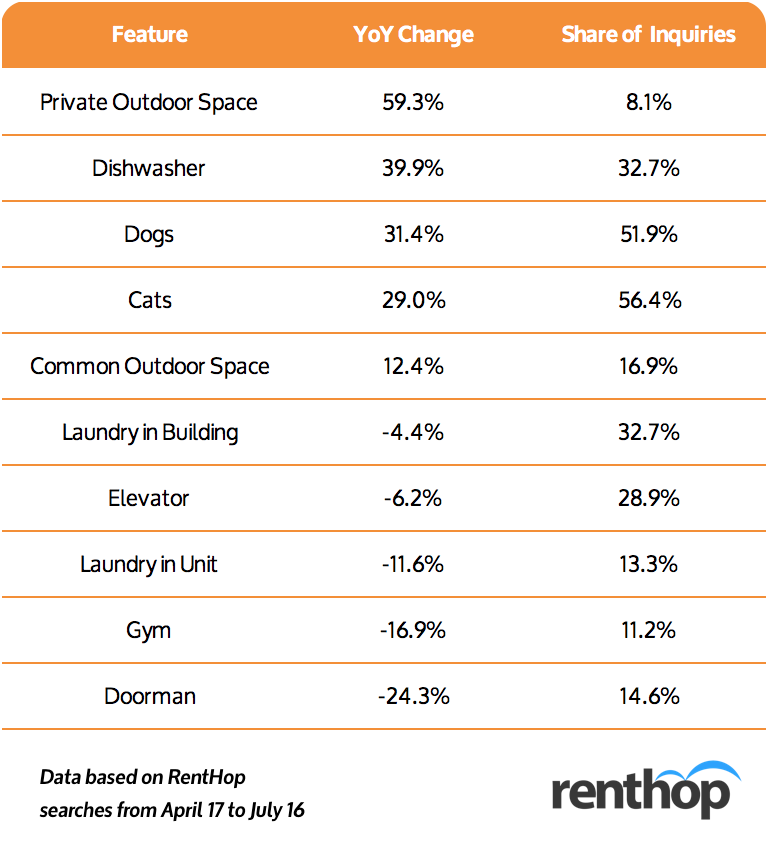
Private Outdoor Space Became the Hot Amenity, Replacing Doorman and Gym
Doorman and gyms had long been key features driving the rental rates in New York City until COVID-19 hit. Now, people tend to avoid large residential rental buildings to minimize the risk of catching the coronavirus. According to our renter search data from April 17 to July 16, 25% of the searches involving private or common outdoor space, while only 14.6% of the searches included doorman and 11.2% gym. While elevator remained one of the more popular features, the demand fell by 6.2% when adjusting to listing and lead volumes.
Most Popular NYC Neighborhoods by Lead Generation
The table below summarizes the 50 most popular neighborhoods in New York City, the cost per lead (in terms of RentHop credits), and year-over-year changes in lead counts.
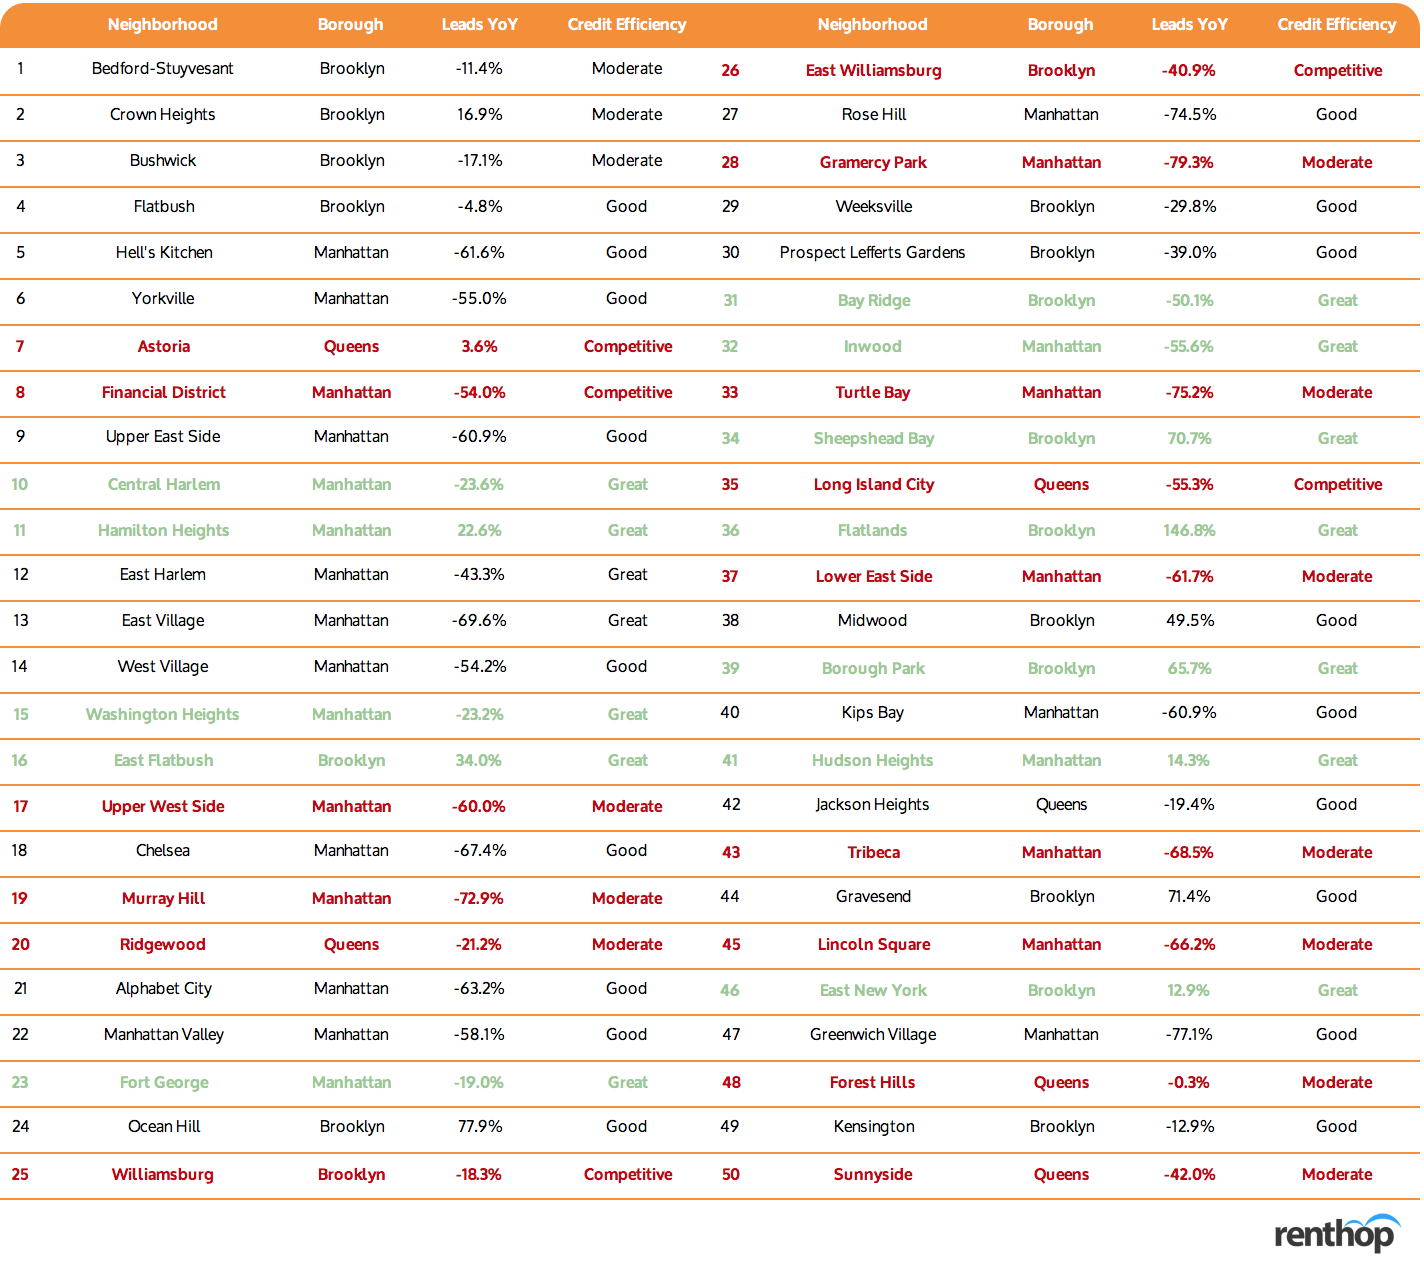
Top Growing Neighborhoods
With respect to renters seeking full apartments, certain popular neighborhoods have seen an outsized increase in renter leads year-over-year from the second quarter of 2019 to the second quarter of 2020. Looking at the most inquired about neighborhoods, the neighborhoods with the highest growth appear concentrated in Brooklyn, with Flatlands seeing a 146.8% incease in leads, Ocean Hill a 77.9% increase, Gravesend a 71.4% increase, and Borough Park a 65.7% increase.
Top Declining Neighborhoods
At the same time, many popular neighborhoods in the city have seen a substantial decrease in renter leads year-over-year in the second quarter of 2020. The majority of these large declining neighborhoods are concentrated in Manhattan, with Gramercy Park seeing a 79.3% decrease, Greenwich Village a 77.1% decrease, and Turtle Bay an 75.2% decrease. Leads also dipped 74.5% in Rose Hill. Meanwhile, Williamsburg, the most popular neighborhood in Brooklyn, saw a 18.3% reduction in lead volume year-over-year.
Methodology
Released on a quarterly basis, the RentHop Rental Report analyzes the NYC rental market using the platform’s rental listings and traffic data. The lead volume, most inquired apartment type, and year-over-year changes are determined based on inquiries sent by renters visiting the RentHop site. The median asking rent is calculated using all listings created between April 17, 2020 and July 16, 2020, across all apartment types, whereas median 1BR rent is calculated using only one-bedroom listings created during the same time period. Please email press@renthop.com for a detailed report covering all NYC neighborhoods. Note that unlike other RentHop studies that analyze and summarize data using the Neighborhood Tabulation Areas, the RentHop Rental Report adopts a more granular neighborhood shapefile for the analysis, which is consistent with the listing search criteria on the consumer side.


