Have you ever come across rats carrying bits and pieces of leftover food? Or maybe you’ve seen them in your kitchen and gone completely wild trying to kill them? It is known that rats are rampant in the city and live among us, taking refuge and shelter on the streets, and even sometimes in our homes. What’s worse is that rodents are a major public health problem, and more and more resources are invested in rodent inspection and prevention.
Each year, we at RentHop examine the data from major U.S. cities, hoping to help renters and homeowners make an informed decision when it comes to housing. This year, we again reviewed the rat sightings data, and what we discovered isn’t great. Our study this year includes Boston, Chicago, and Washington D.C., and unfortunately, all three cities saw a drastic increase in the number of rodent complaints.
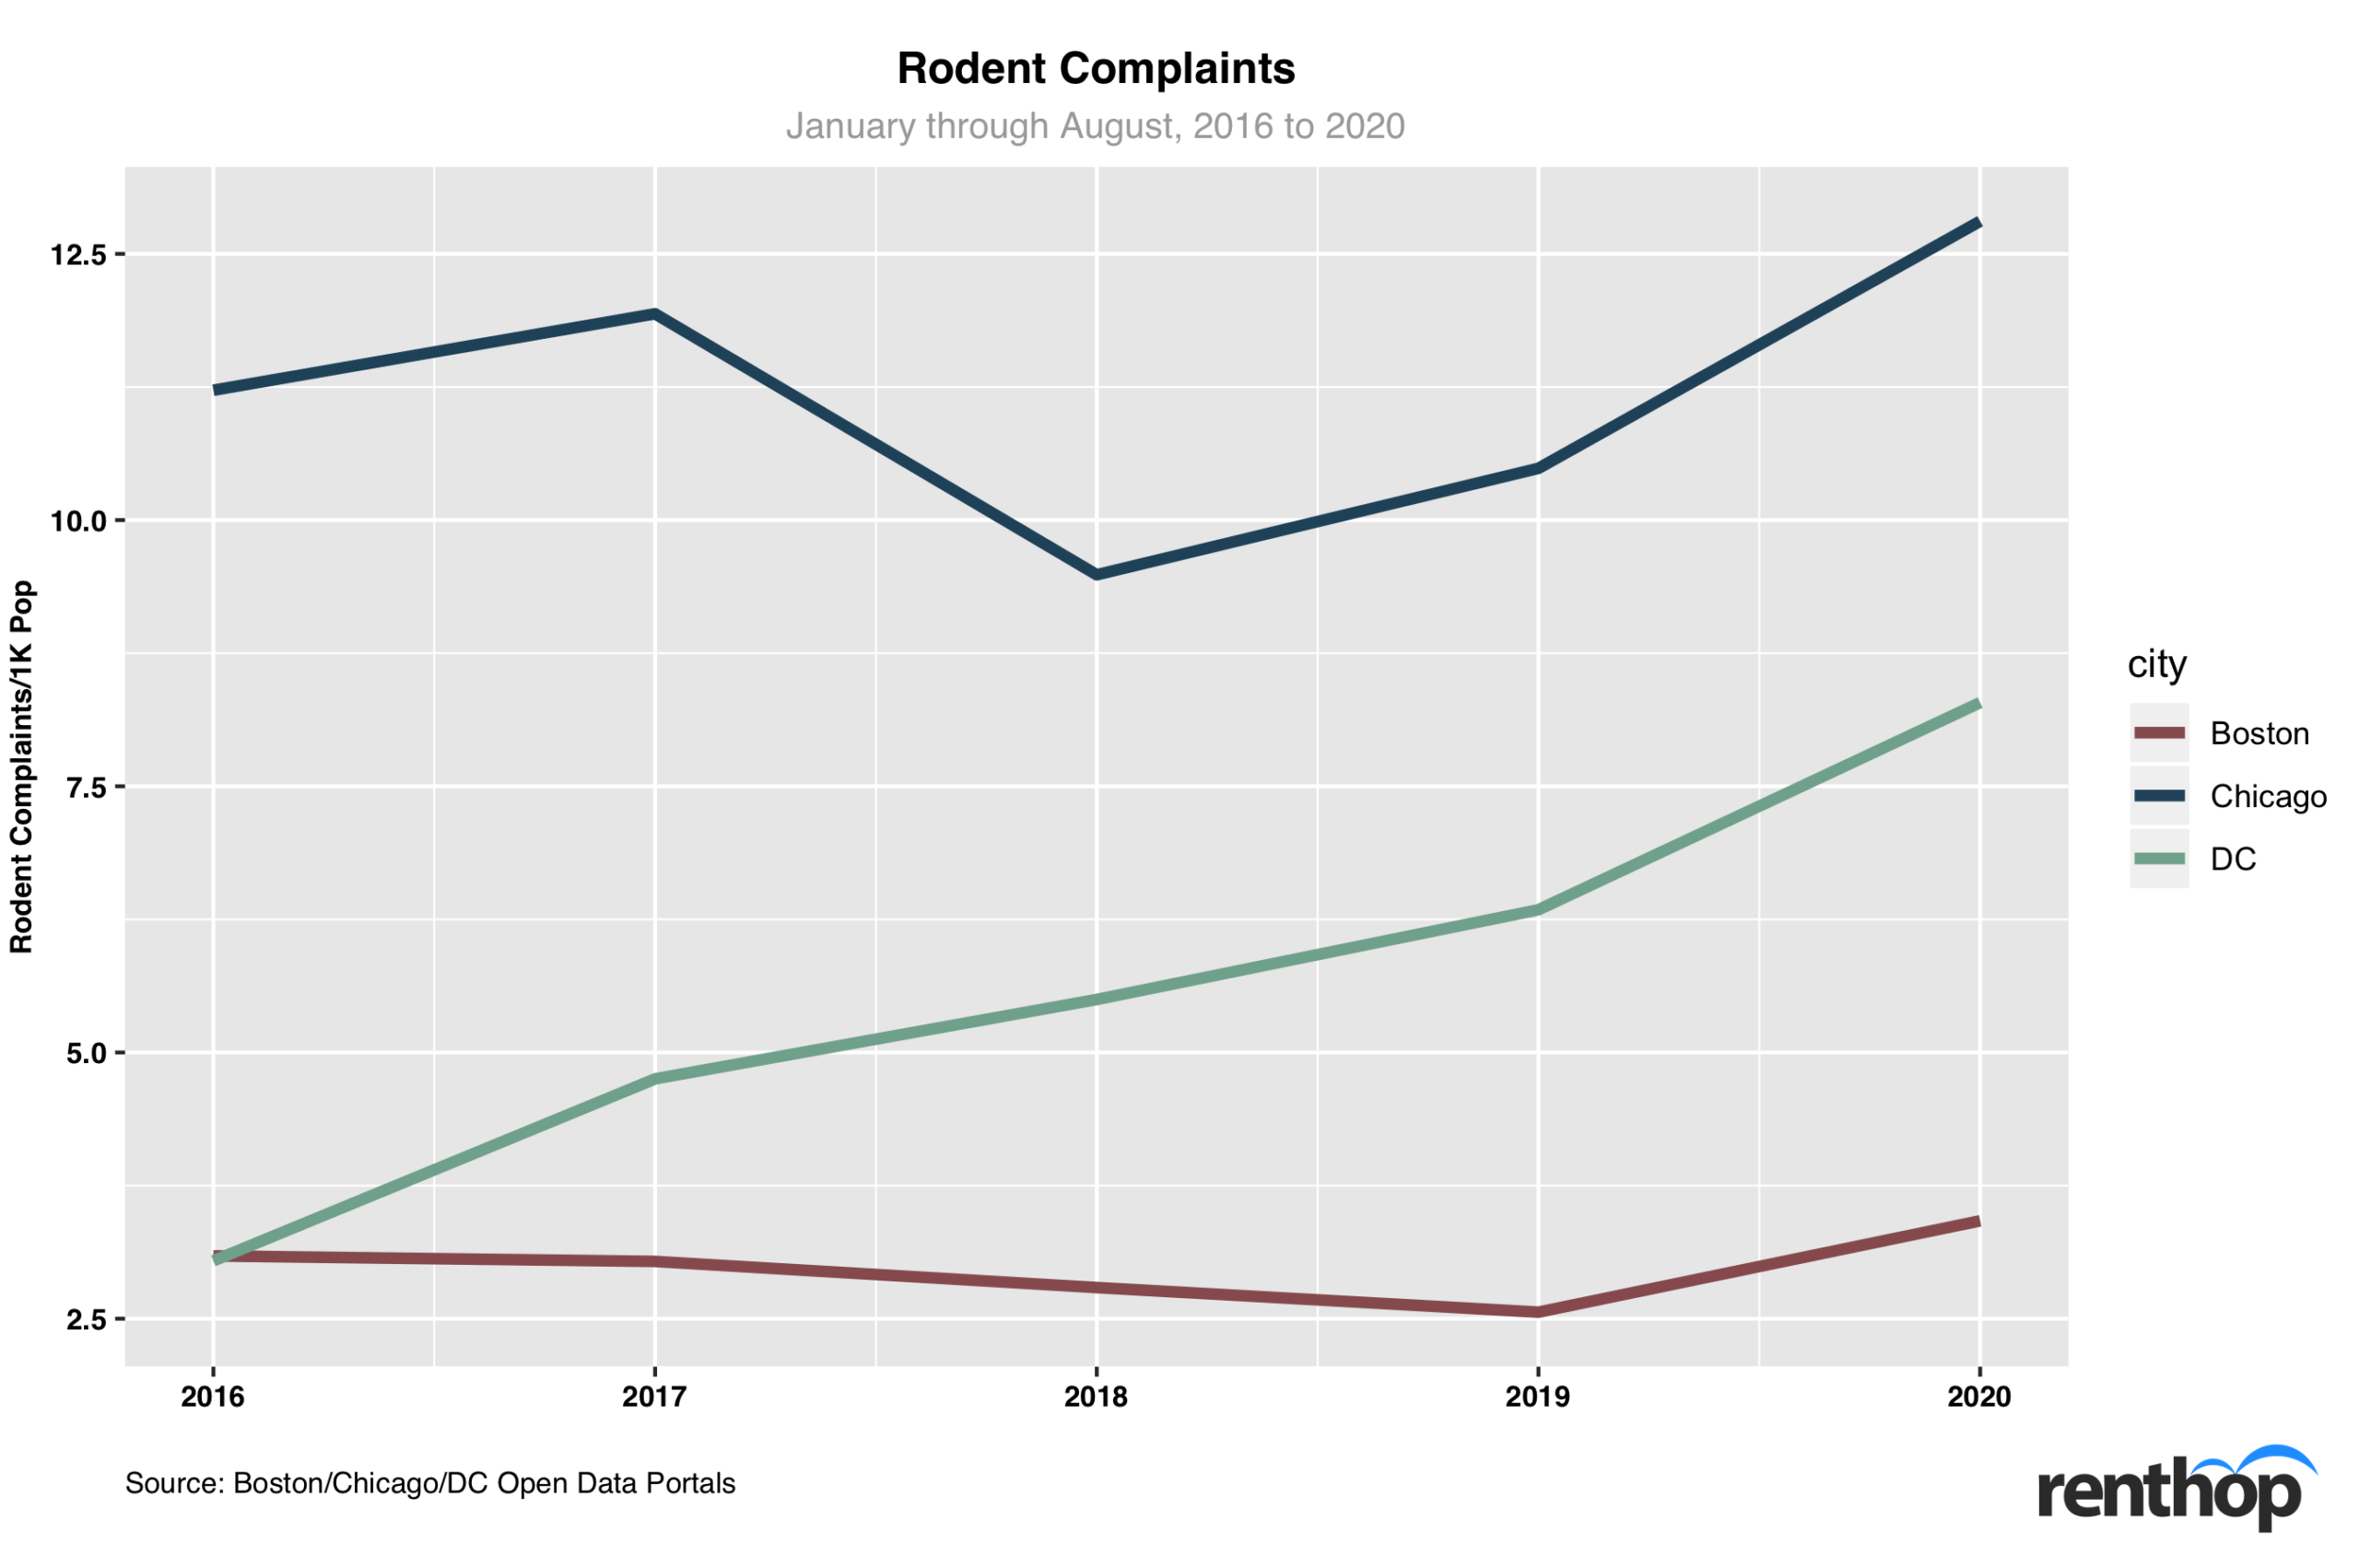
Figure 1 below illustrates the number of rodent complaints from January through August in the past five years. In Boston, the number went up 33.5% to 3.42 rodent complaints/1,000 population. In D.C., the number is slightly worse. As of August 31, 2020, DC 311 has received 5,848 rodent complaints, or 8.29 complaints/1,000 population. This number is 30.7% higher than in 2019.
Chicago, a.k.a. the rat capital, not surprisingly, has had the greatest number of rat sightings/1,000 population among the cities included. The number reached its lowest in 2018 but has since been rising significantly. From January 2019 through August 2019, the city’s 311 reporting system received 28,249 rodent complaints or 10.5/1,000 population. This number since jumped to 34,501, or 12.8/1,000 population in 2020, a 22.1% increase.
Select one of the cities below to learn more:
Rodent complaints rose 33.5% in Boston
Founded in 1630 by the Puritans, Boston is one of the oldest cities in the United States and played a crucial part in our history. As we all know, old infrastructure often makes perfect habitats for rats. Rodents thrive in outdated subway systems, sewers, parks, and in foundations of old homes and buildings, and pose a threat to humans.
And this summer, Boston has to deal with a serious rodent crisis.
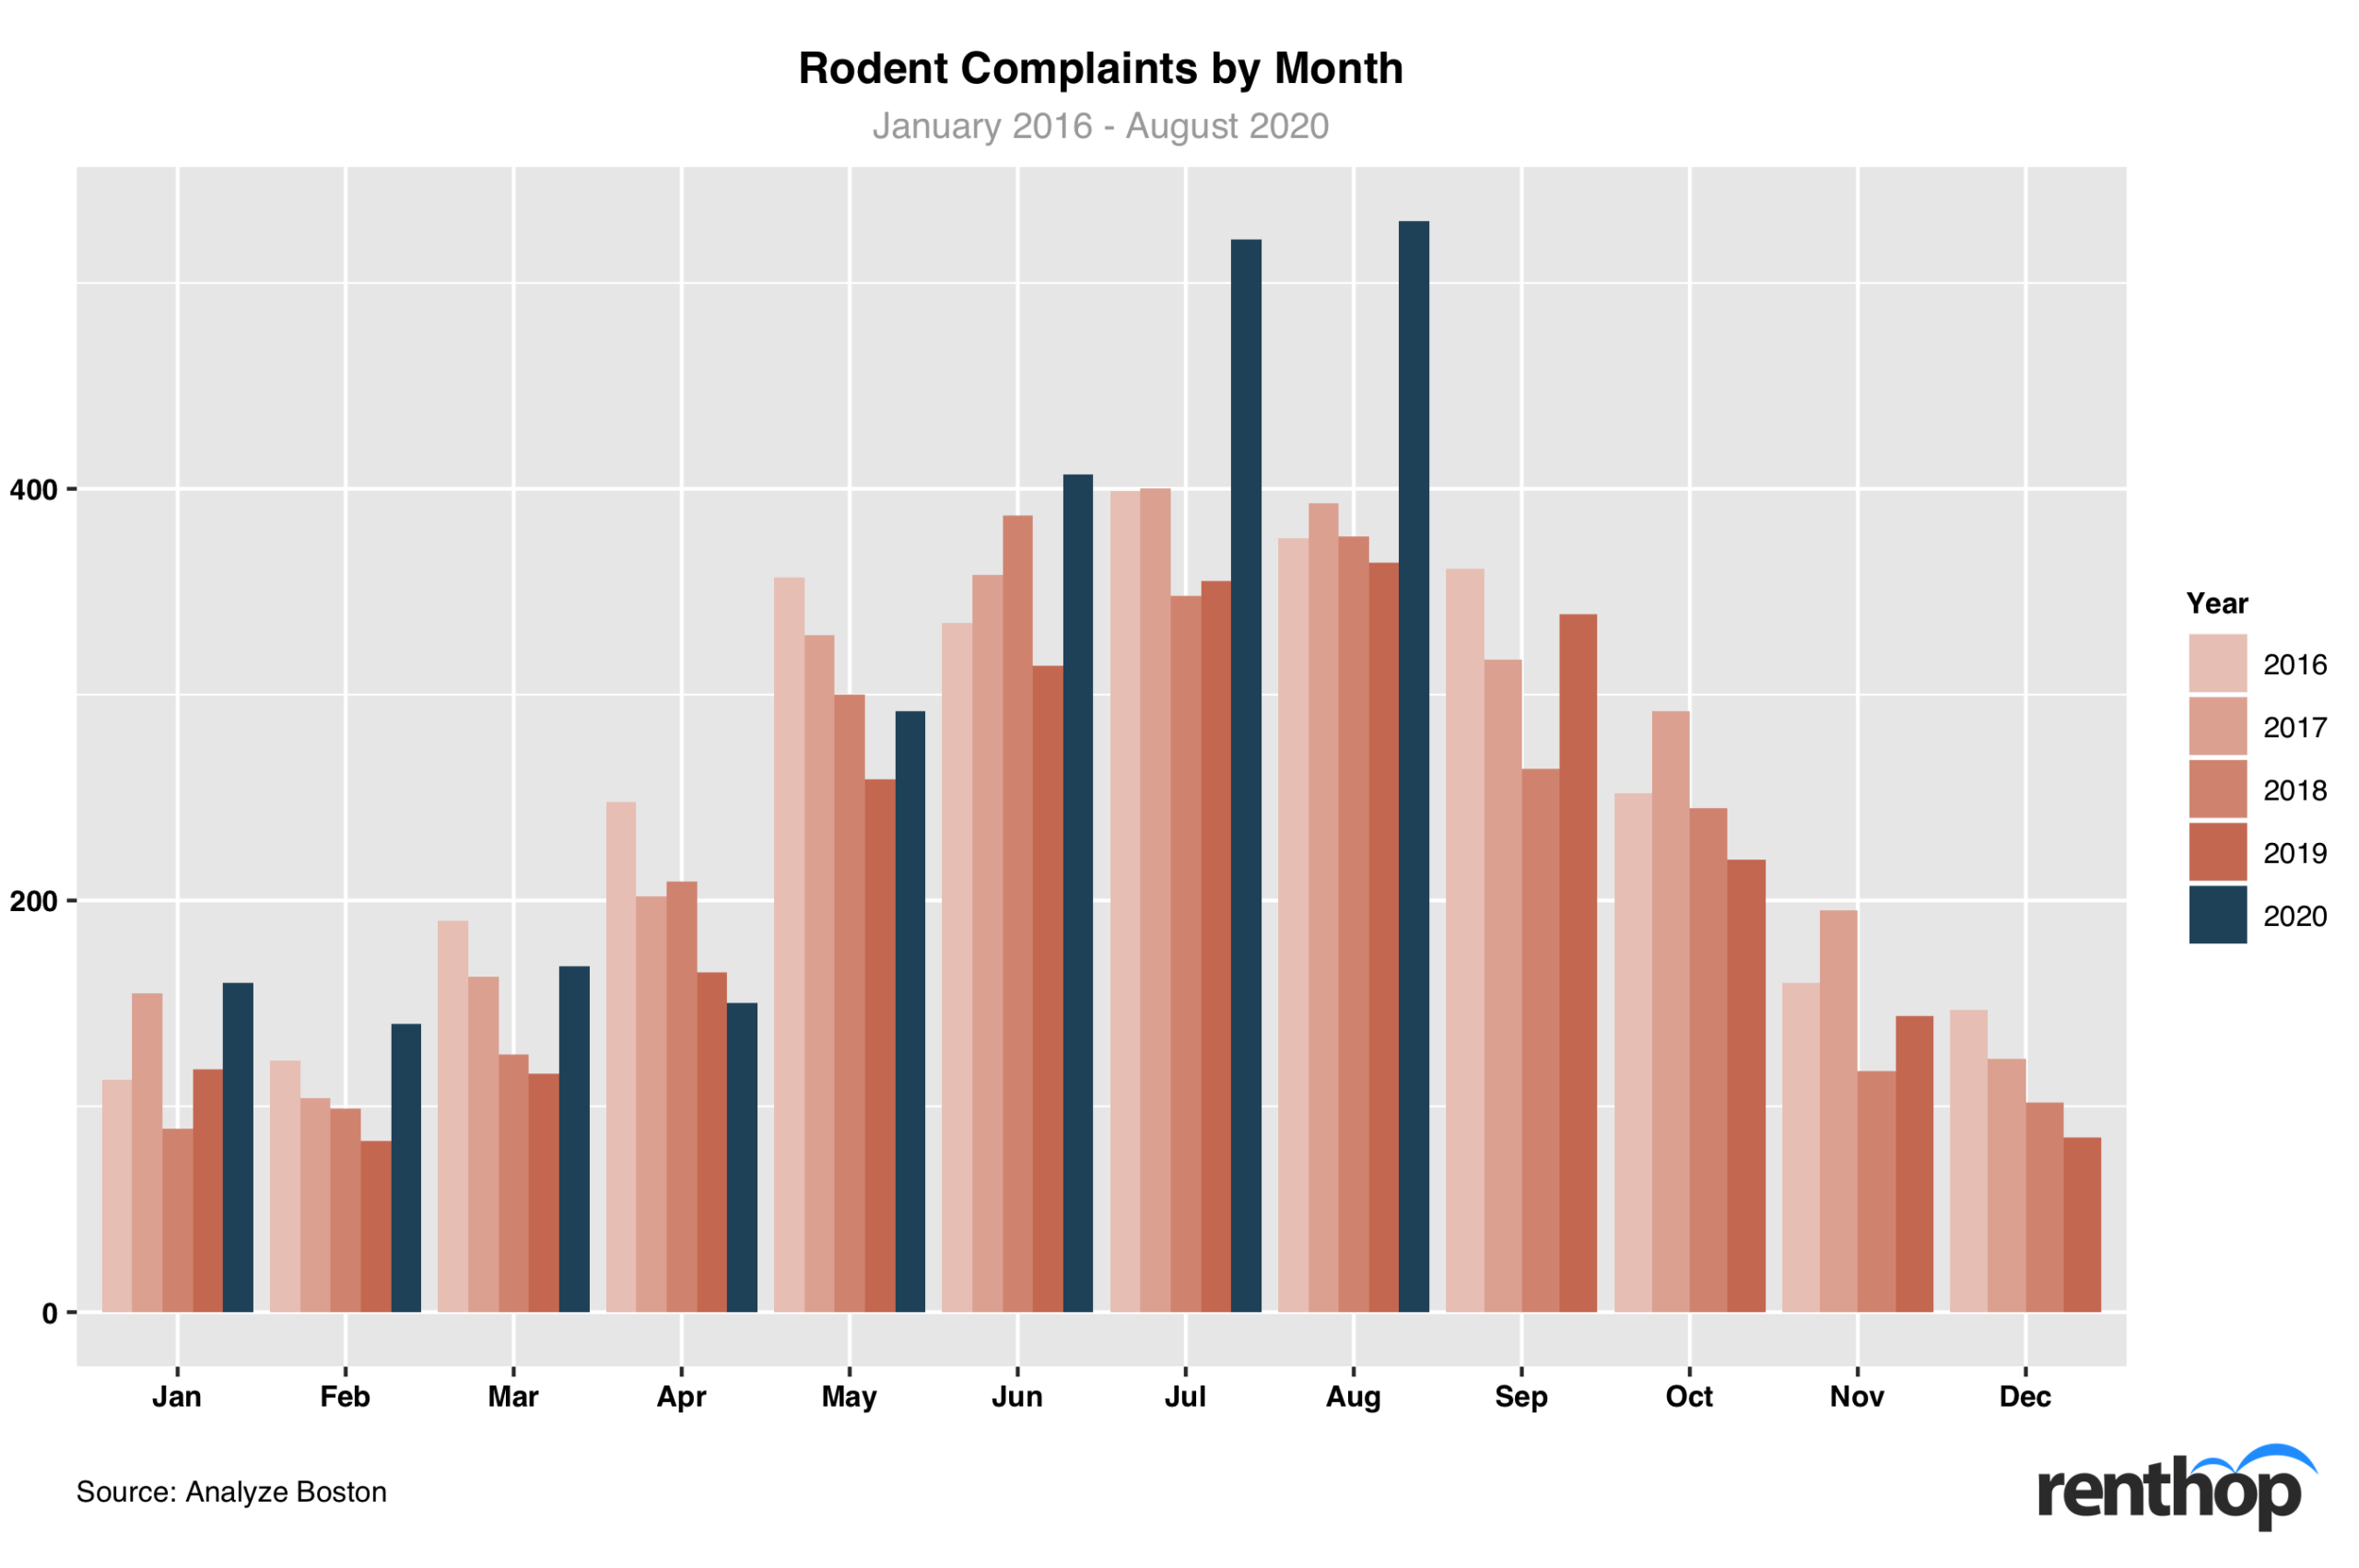
As of August 31, Boston 311 has received 2,368 rodent complaints in 2020, which translates to 3.4 complaints per 1,000 population. Now, while it might seem very few compared to Chicago or DC, this number, however, is 33.5% higher than the same period in 2019.
The CDC attributed such an increase to the coronavirus lockdown. The agency warned that a possible increase in rodent sightings as restaurants and other sources of food shut down due to the coronavirus pandemic. It is worth noting, however, that the number had been increasing since January 2020, way before the first confirmed COVID-19 case and lockdown were announced in Boston. The rats were particularly active this past summer. August 2020 marked the worst month in the past five years, with a total of 530 rodent complaints filed to the city’s 311 reporting system. Could it be the warm weather? After all, winter 2019-2020 ended over 2°F above the twentieth-century average, making it one of the warmest winters on record.
Which neighborhoods are run by rats this year?
According to the city’s Inspectional Services Department, it is launching a campaign to reduce the rodent population that has been running wild around neighborhoods. Do you know if your neighborhood will be one of the firsts visited by the agency? Well, let’s find out!
The interactive map below indicates the concentration of rodent complaints in Boston. Neighborhoods in darker shades have a higher concentration of rodent complaints in 2020. It is highly possible that larger neighborhoods receive more complaints than smaller neighborhoods, and so we normalized the number of rodent complaints by land size. You can click on the polygons to learn more about each neighborhood.
The ISD will most likely show up in these neighborhoods
- Downtown – 312 complaints in 2020, 502.3 complaints/sq mi
- North End – 55 complaints in 2020, 277.4 complaints /sq mi
- South End – 153 complaints in 2020, 207.6 complaints /sq mi
- Beacon Hill – 56 complaints in 2020, 179 complaints /sq mi
- Back Bay – 107 complaints in 2020, 171.5 complaints /sq mi
Rodent complaints spiked in these neighborhoods
- South Boston Waterfront – 1 complaints in 2019, 7 in 2020 (+600%)
- Allston – 75 complaints in 2019, 189 in 2020 (+152%)
- Brighton – 99 complaints in 2019, 213 in 2020 (+115.2%)
- Back Bay – 55 complaints in 2019, 107 in 2020 (+94.5%)
- Mattapan – 23 complaints in 2019, 41 in 2020 (+78.3%)
Rodent complaints dropped in these neighborhoods
- Longwood – 2 complaints in 2019, 0 in 2020
- Chinatown – 29 complaints in 2019, 10 in 2020 (-65.5%)
- Leather District – 8 complaints in 2019, 4 in 2020 (-50%)
- Mission Hill – 40 complaints in 2019, 20 in 2020 (-50%)
- West End – 3 complaints in 2019, 2 in 2020 (-33.3%)
Chicago wins the title of “Rat Capital”, yet again.
In our study from last year, Chicago ranked #1 as the “rat capital” in the country. The abundance of garbage and buildings in the Windy City makes it a great location for rats to seek shelter and food for survival. In 2019, Chicago 311 received in total 42,864 rodent complaints, or 15.9 per 1,000 Chicagoans, 10.2% more than in 2018.
And this year, rodents are once again on the rise.
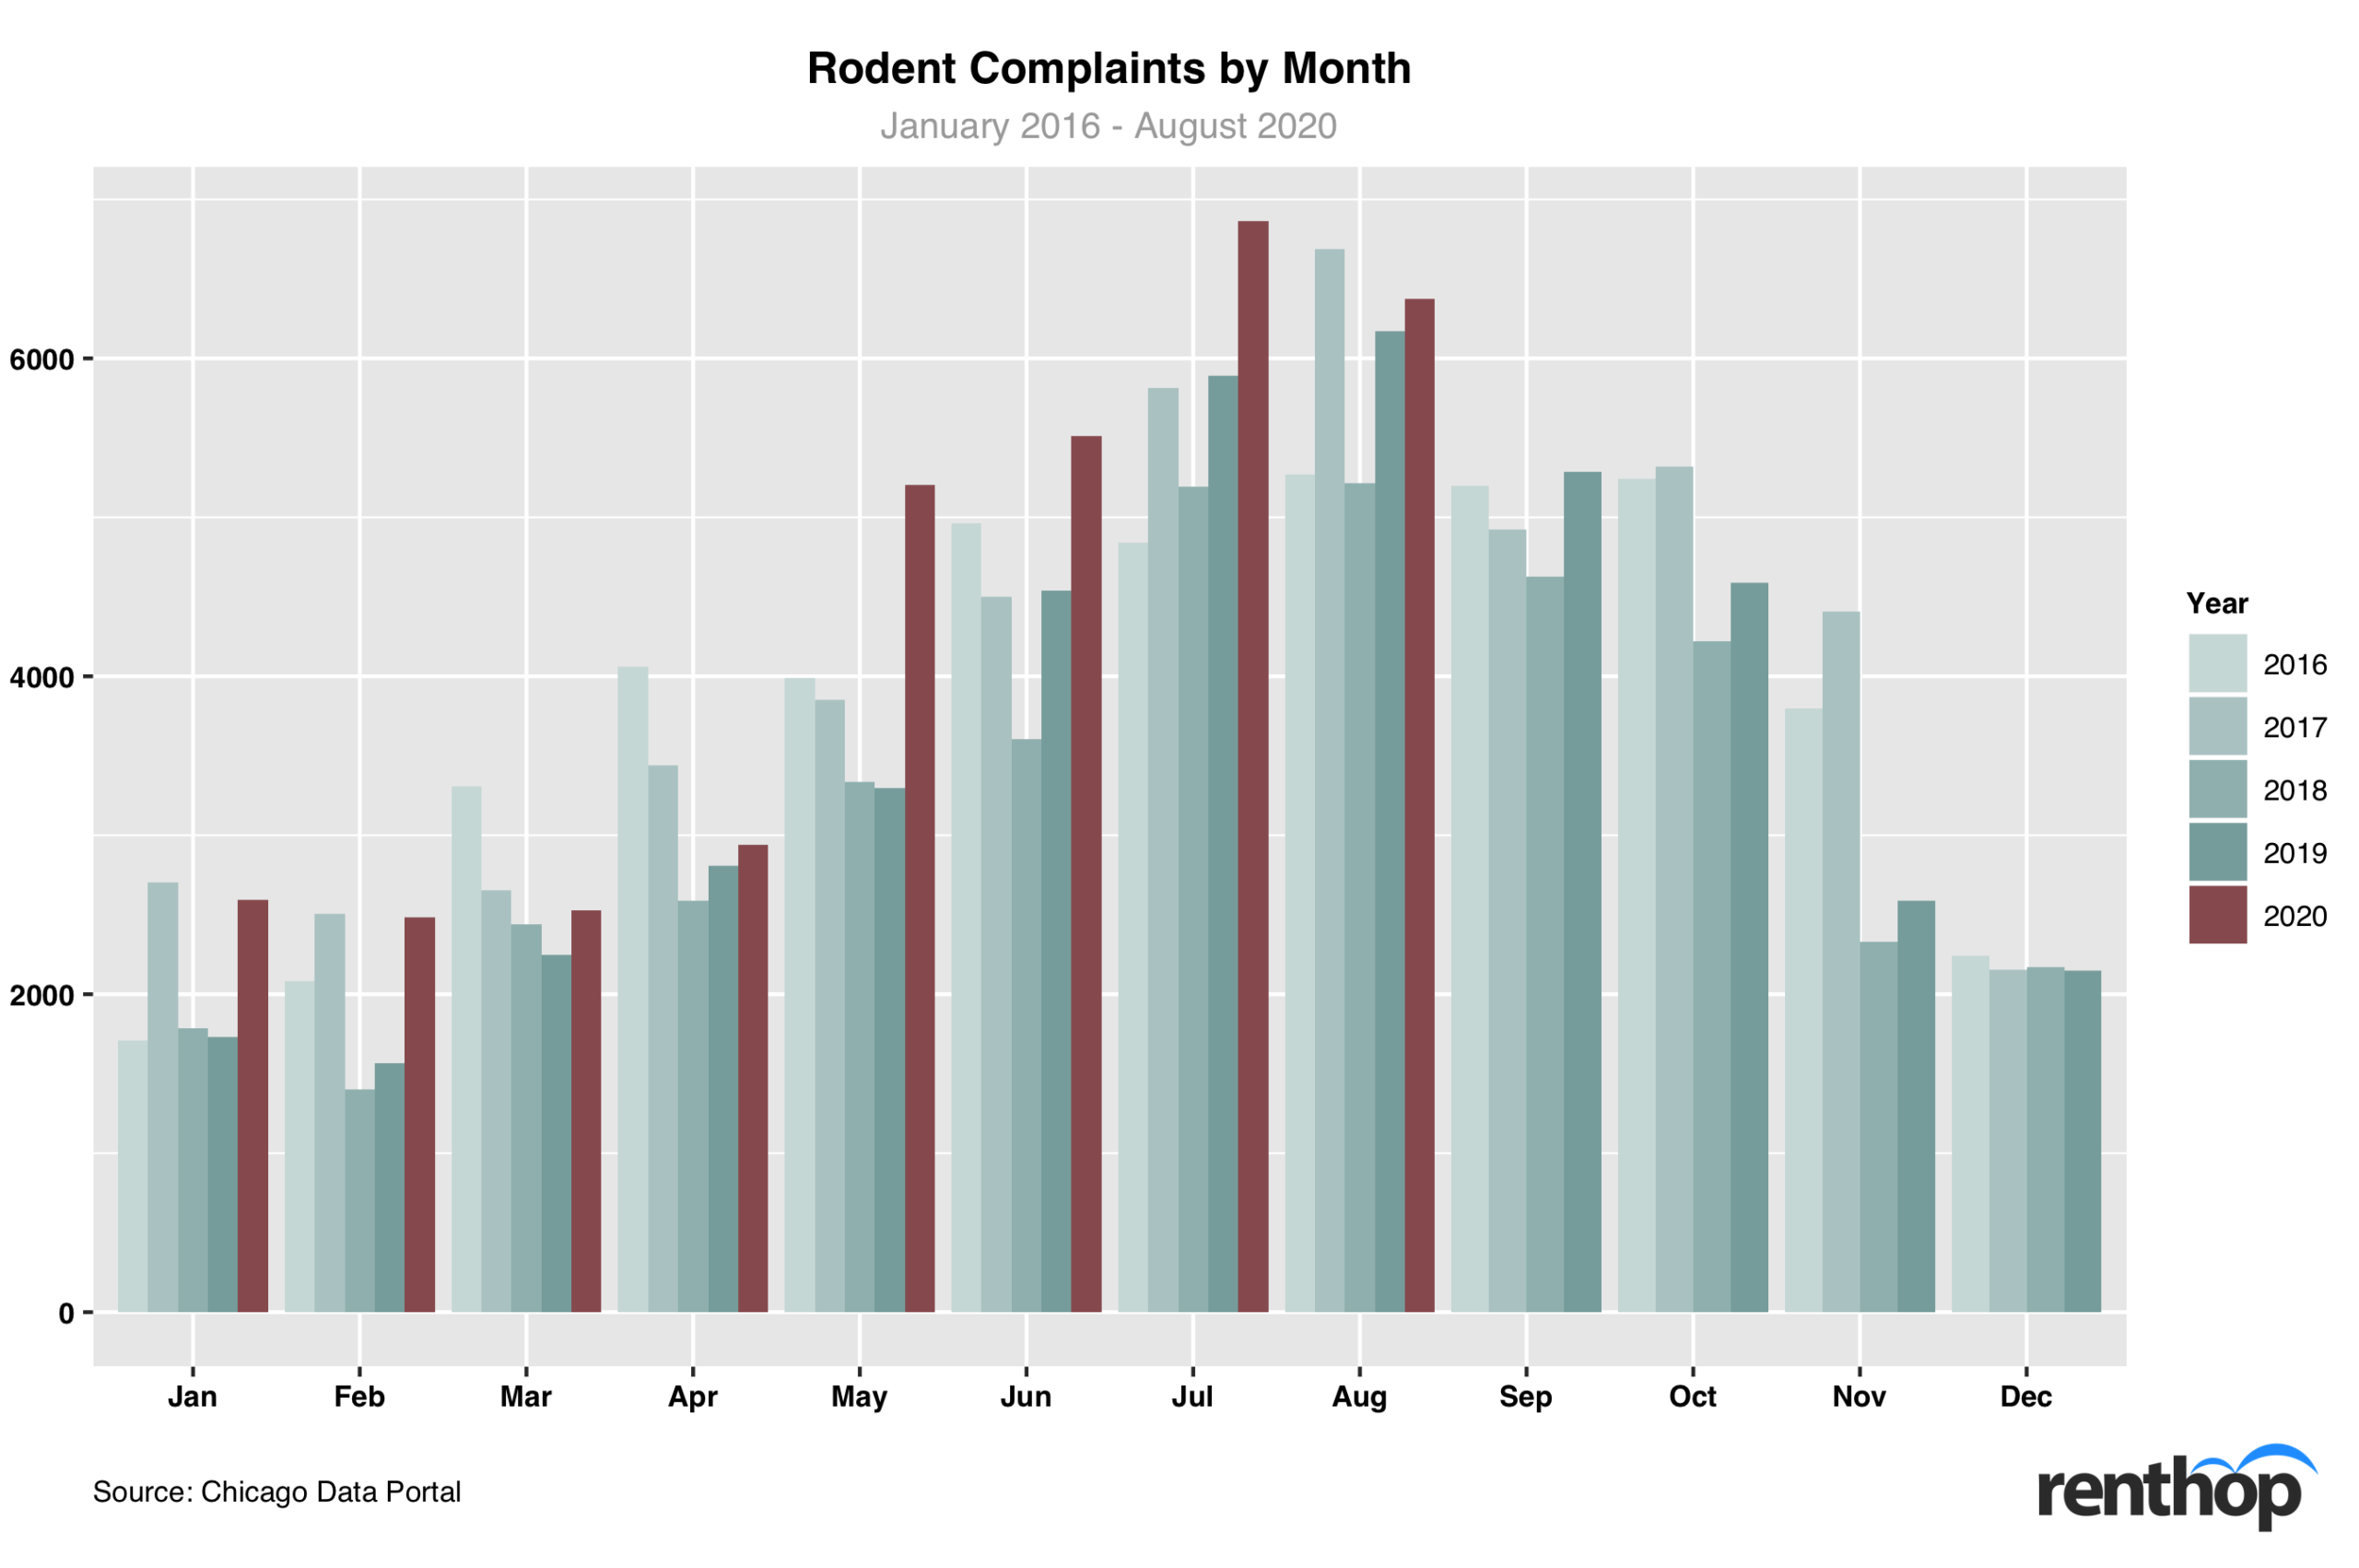
As of August 2020, the Windy City has scored 34,501 rat sighting reports, 22.1% more than the same period in 2019. Indeed, the uptick in rodent sightings might be related to restaurants and other sources of food shut down due to the coronavirus pandemic. It is worth noting, however, that the number had been increasing since January 2020, way before the food establishments were forced to close their doors.
May 2020 marked the worst month of May in the past five years, with a total of 5,203 rat sightings reported to the city’s 311 system, 131.7% higher than May 2019. The number continued trending upward throughout the summer, with 6,863 rodent complaints logged in July 2020 – that’s over 200 complaints per day!
Which neighborhoods are run by rats this year?
The interactive map below indicates the concentration of rodent complaints in Chicago. Neighborhoods in darker shades have a higher concentration of rodent complaints. It is possible that larger neighborhoods receive more complaints than smaller neighborhoods, and so we normalized the number of rodent complaints by land size. You can click on the polygons to learn more about each neighborhood.
Rats are roaming around in these neighborhoods
- Grand Boulevard – 257 complaints in 2020, 147.8 complaints/sq mi
- Printers Row – 5 complaints in 2020, 64.5 complaints/sq mi
- United Center – 124 complaints in 2020, 106.3 complaints/sq mi
- Sheffield & DePaul – 99 complaints in 2020, 263.3 complaints/sq mi
- Humboldt Park – 1039 complaints in 2020, 231.7 complaints/sq mi
Rat sightings spiked in these neighborhoods
- Greektown – 1 complaints in 2019, 12 in 2020 (1100%)
- West Pullman – 191 complaints in 2019, 793 in 2020 (315.2%)
- Gold Coast – 15 complaints in 2019, 47 in 2020 (213.3%)
- Hegewisch – 10 complaints in 2019, 31 in 2020 (210%)
- O’Hare – 2 complaints in 2019, 6 in 2020 (200%)
Rats are migrating out from these neighborhoods
- Jackson Park – 2 complaints in 2019, 0 in 2020
- Grant Park – 6 complaints in 2019, 1 in 2020 (-83.3%)
- Printers Row – 17 complaints in 2019, 5 in 2020 (-70.6%)
- Burnside – 30 complaints in 2019, 14 in 2020 (-53.3%)
- Millennium Park – 2 complaints in 2019, 1 in 2020 (-50%)
Rodent complaints are up 31% this year in Washington D.C.
Washington D.C. is known for many things. It is the capital of the United States of America; it is a cultural center with many monuments and museums, such as the Smithsonian Institution; and it is a walkable and bike-friendly city with many bike lanes in the downtown area. What you probably don’t know about D.C. is that not only our president and government officials reside there, many, many rats also call it home, and this year, the District has seen a spike in rat complaints.
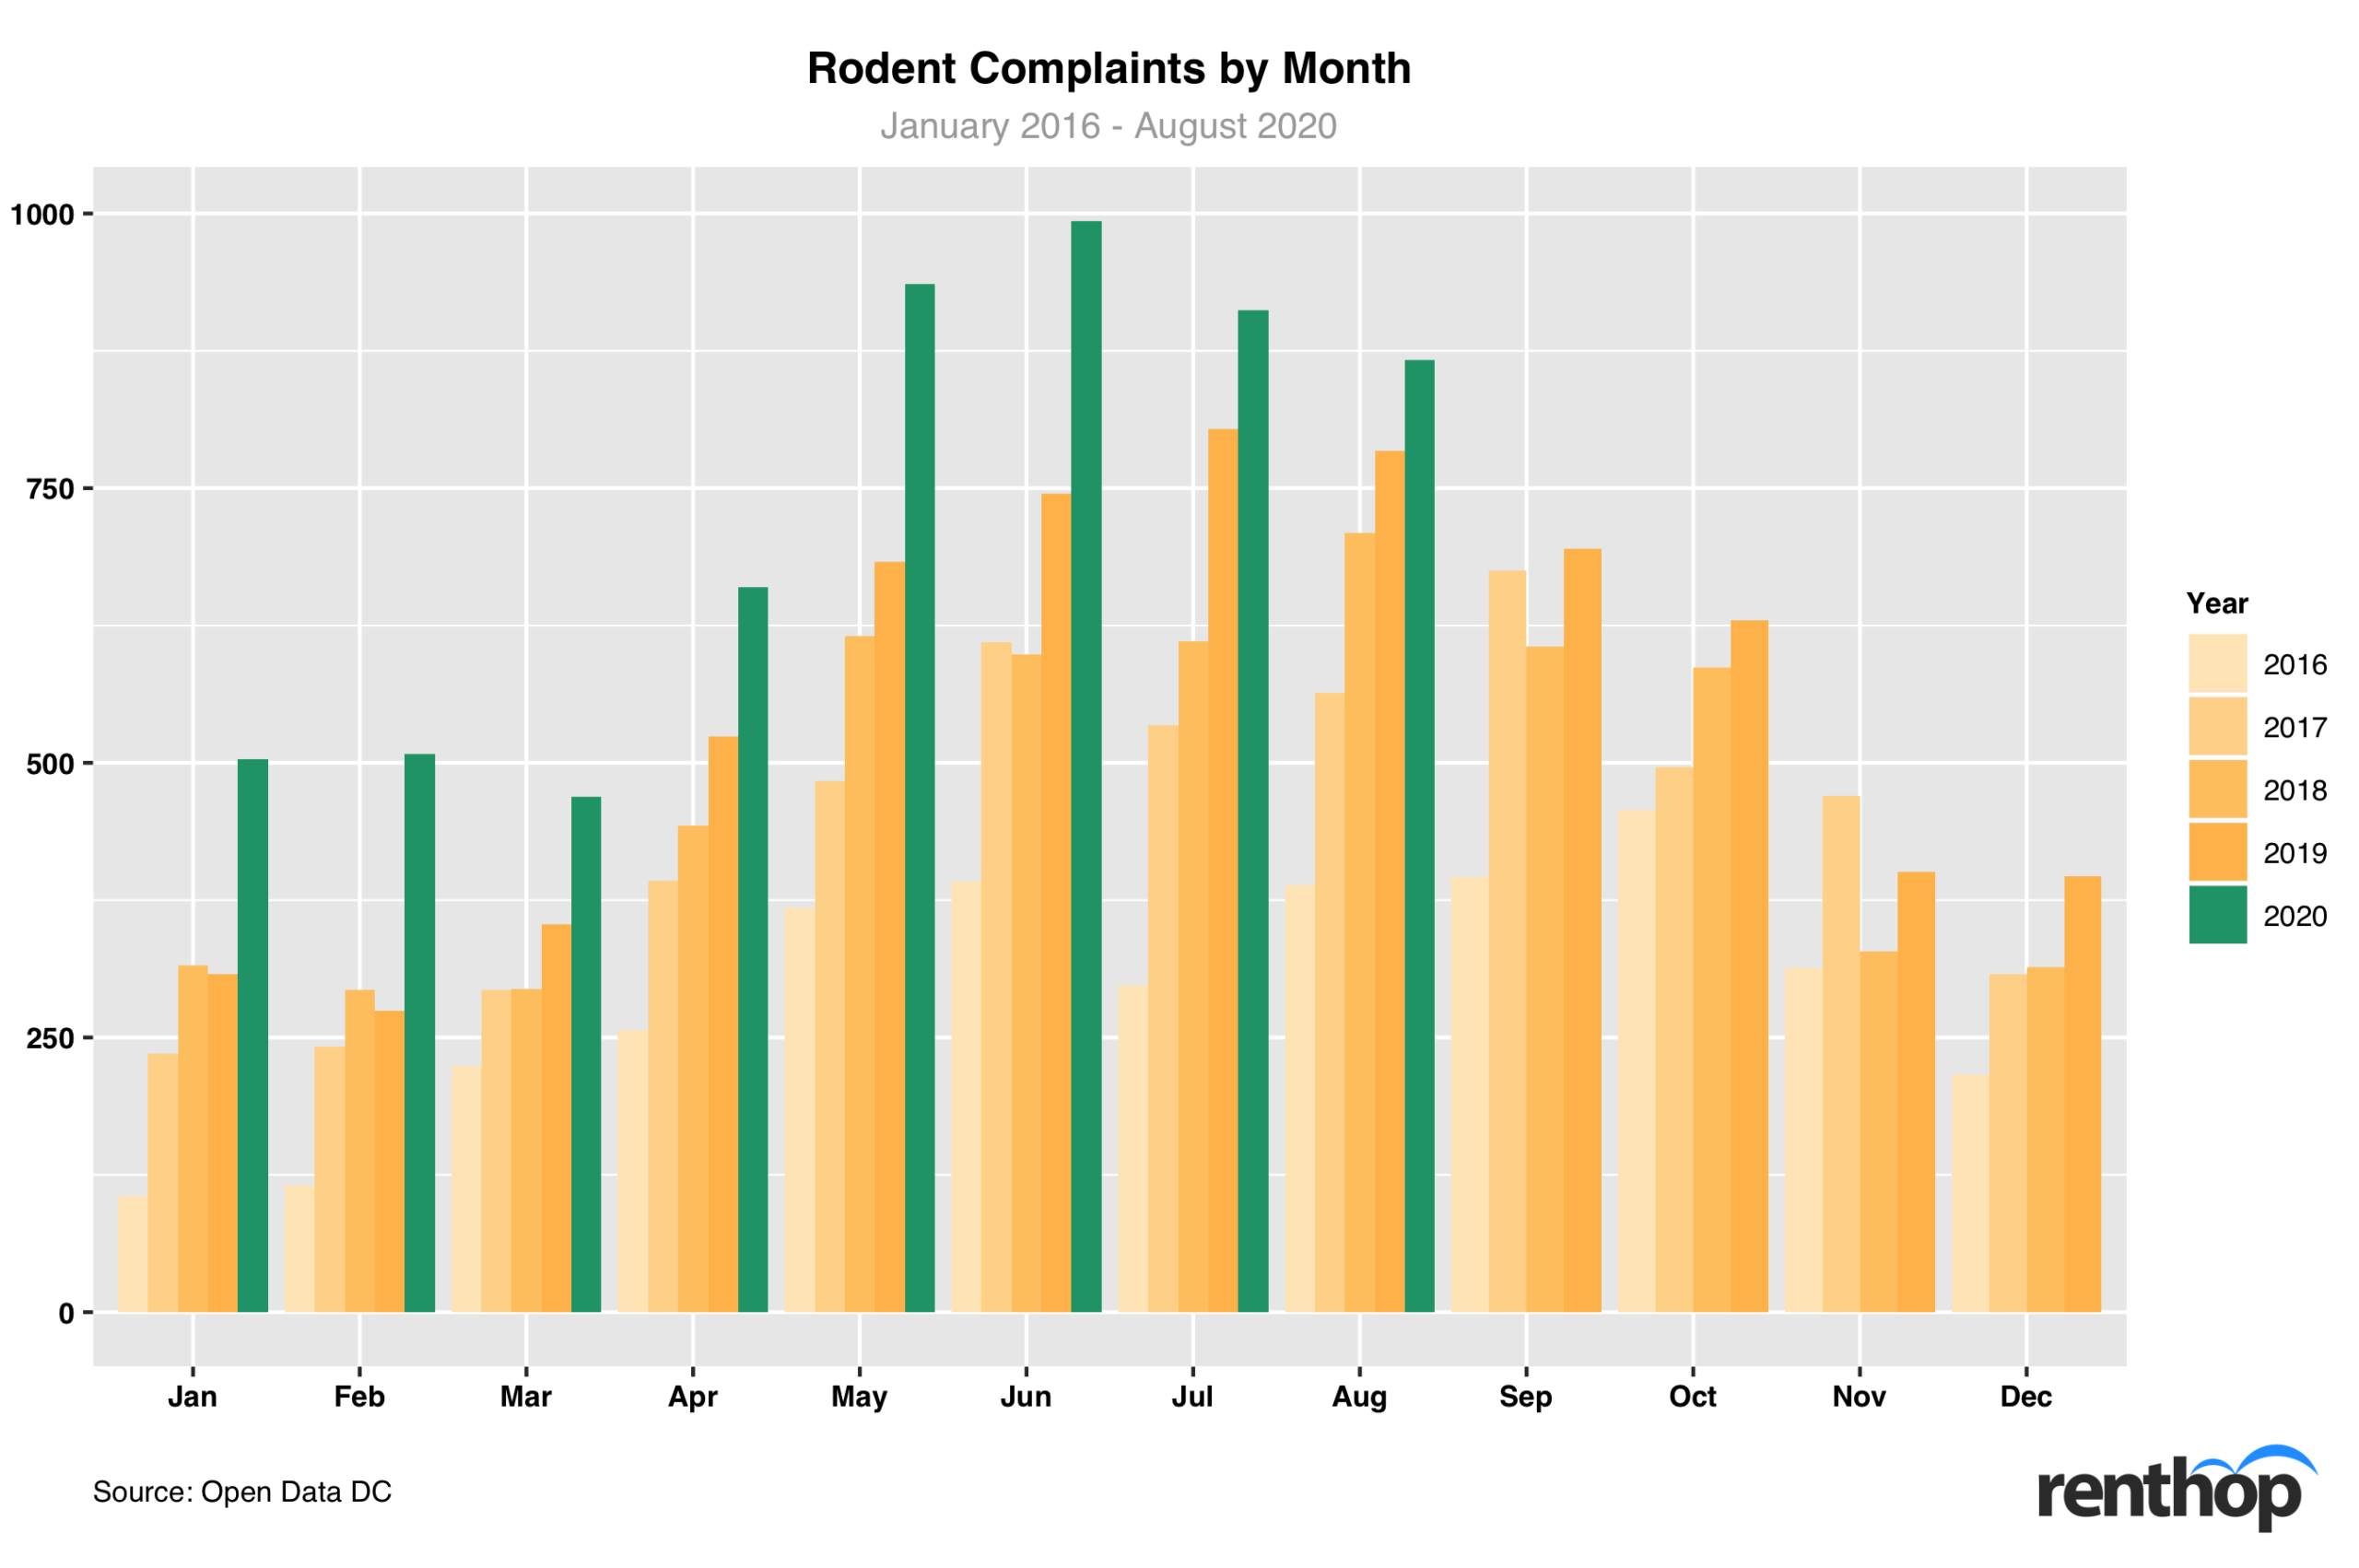
The number of rodent complaints has been trending upward in D.C. since 2016, but 2020 is by far the worst year. By the end of August 2020, D.C.’s 311 reporting system has received a total of 5,848 rodent complaints, 30.7% more than the same period in 2019.
The past summer was particularly bad for D.C. June 2020 marked the worst month since January 2016, with a total of 985 unique complaints made to D.C. 311 by Washingtonians. 37.2% more than June 2019. Could it be that people are more likely to spot rats when they are working from home? Or maybe as the restaurants closed due to COVID-19, these furry critters are forced to invade people’s homes? No one knows for sure. But what we do know is that some neighborhoods are seeing more rodents than others, and that’s bad news for the residents. Now, check out the map and see if your neighborhood is one of them.
Which neighborhoods are run by rats this year?
The interactive map below indicates the concentration of rodent complaints Washington D.C. Neighborhoods in darker shades have a higher concentration of rat sightings. It is possible that larger neighborhoods receive more complaints than smaller neighborhoods, and so we normalized the number of rodent complaints by land size. You can click on the polygons to learn more about each neighborhood.
These neighborhoods are run by rats this year
- Columbia Heights, Mt. Pleasant, Pleasant Plains, Park View – 691 complaints in 2020, 526.3 complaints/sq mi
- Shaw, Logan Circle – 213 complaints in 2020, 376.8 complaints/sq mi
- Brightwood Park, Crestwood, Petworth – 847 complaints in 2020, 337.6 complaints/sq mi
- Howard University, Le Droit Park, Cardozo/Shaw – 214 complaints in 2020, 297.9 complaints/sq mi
- Union Station, Stanton Park, Kingman Park – 461 complaints in 2020, 287.7 complaints/sq mi
Rodent complaints surged in these neighborhoods
- National Mall, Potomac River – 6 complaints in 2019, 35 in 2020 (+483.3%)
- Woodland/Fort Stanton, Garfield Heights, Knox Hill – 3 complaints in 2019, 10 in 2020 (+233.3%)
- Fairfax Village, Naylor Gardens, Hillcrest, Summit Park – 3 complaints in 2019, 9 in 2020 (+200%)
- Cleveland Park, Woodley Park, Massachusetts Avenue Heights, Woodland-Normanstone Terrace – 22 complaints in 2019, 62 in 2020 (+181.8%)
- Colonial Village, Shepherd Park, North Portal Estates – 4 complaints in 2019, 9 in 2020 (+125%)
Rodent complaints dropped in these neighborhoods
- North Cleveland Park, Forest Hills, Van Ness – 4 complaints in 2019, 1 in 2020 (-75%)
- Eastland Gardens, Kenilworth – 3 complaints in 2019, 1 in 2020 (-66.7%)
- Saint Elizabeths – 10 complaints in 2019, 4 in 2020 (-60%)
- Downtown, Chinatown, Penn Quarters, Mount Vernon Square, North Capitol Street – 89 complaints in 2019, 50 in 2020 (-43.8%)
- Douglas, Shipley Terrace – 27 complaints in 2019, 16 in 2020 (-40.7%)
Methodology
This study examines the rodent crisis in major U.S. cities, including Boston, Chicago, and Washington D.C. The rodent complaint data was retrieved from each city’s open data portal, and the population data was collected via U.S. Census Bureau. For this study, we limited the research time frame to January 2016 through August 31, 2020. We then geocoded the complaints using each city’s neighborhood shape file and normalized the complaint count by land size. This allows us to fairly rank each neighborhood and provide better insights.
RentHop is all about data and facts. Our data science team does annual studies on rental data as well as 311 complaints across major U.S. cities. To get to know the city you live in, take a look at our previous studies on rodent complaints, human/animal waste complaints, noise complaints, and more.


