With housing prices skyrocketing over the past year, many young professionals are now faced with high rent prices as single-income earners. But are certain cities more affordable than others for singles?
Each year, RentHop updates the Singles Index to calculate the housing burden – the percentage of income a single renter has to allocate each month to rent a studio home – in the largest cities in the country. In our third annual edition, we further broke down the data this year to understand single renters’ struggles. Using the median nonfamily income and nonfamily household income by sex data released by the U.S. Census Bureau, we found that:
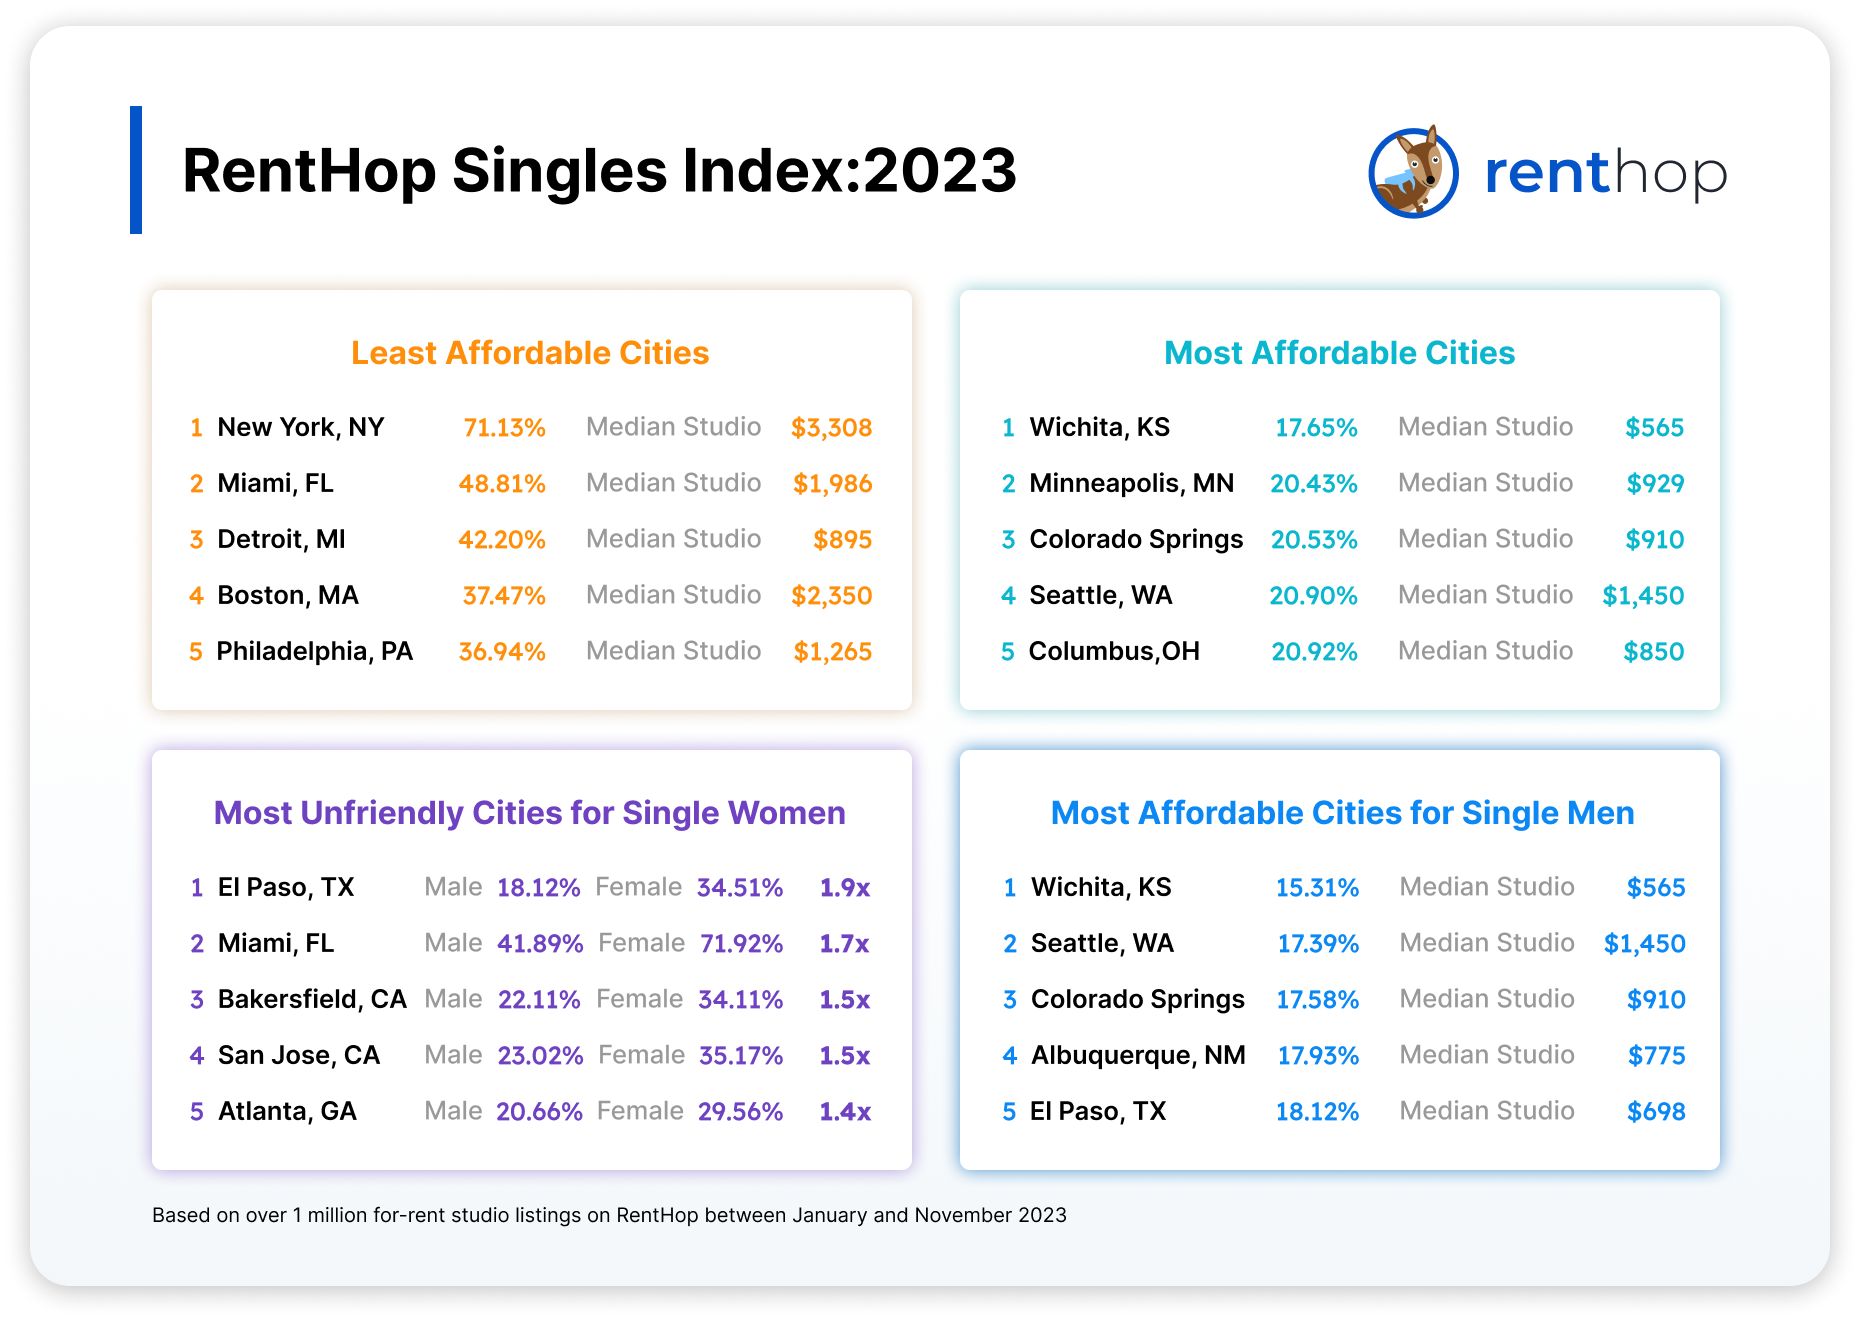
- New York, NY is the least affordable city for single renters. A single renter would have to spend 71.13% of their income on a studio unit.
- New York is also the least affordable city when breaking down the data by sex. Female renters must allocate 79.42% of their annual income vs. 60.99% for single men.
- Meanwhile, Wichita, KS is the most affordable city. With a median studio rent of $565 per month, a single renter only needs to spend 17.65% of their income on rent.
- Single female renters in El Paso, TX would have to spend 1.9 times more of their income to live alone than men. For male renters, the monthly burden is 18.12%, whereas for women, it is 34.51% of their income.
- Arlington, TX is the only city where single women would spend a smaller portion of their annual income on a studio apartment than men. Rent cost as % of Singles Income comes out to be 28.18% for women vs. 28.28% for men.
- While California has some of the smallest gender wage gaps in the country, San Jose has the fourth-highest housing cost gap among all the cities. Single female renters would have to spend 35.17% of their annual income on a studio home, whereas single men would only need to spend 23.02%.
Least Affordable Cities for Singles
1. New York, NY
It is no surprise to those living in New York City that studios are unaffordable for most. The median studio rent in the past year has risen over 9%, reaching $3,308 monthly. Based on a median nonfamily household income of $55,810, a single renter looking to rent a studio would have to spend 71.13% of their income on rent. However, a single renter can reduce their monthly burden by over $600 by having a roommate.
2. Miami, FL
Despite the median studio rent being 4.06% cheaper than last year, Miami remains the second most unaffordable city for single renters. Given the median nonfamily income of $48,826 and $1,986 for a studio, a single person would need to spend 48.81% of their annual income on rent alone.
3. Detroit, MI
Detroit is the third most unaffordable city for singles in the country. While housing costs are relatively low in the city compared to other major cities, the below-average income makes renting a studio challenging for most. With a median studio rent of $895 a month and a median nonfamily income of $25,449, singles in Detroit are required to spend 42.20% of their income to live alone.
4. Boston, MA
Boston is filled with high-income job opportunities, and it has one of the highest median nonfamily incomes, $75,252, in the nation. Even so, the city continues to grapple with expensive housing costs. With a median studio rent of $2,049, singles would have to spend 37.47% of their annual income on housing, meaning it is still unaffordable for renters to rent a studio apartment.
5. Philadelphia, PA
Philly is the fifth least affordable city for singles in America, with rent commanding 36.94% of an average single person’s annual income. On the bright side, studio homes in Philadelphia only saw a slight 1.16% increase in median rent in the past year, currently at $1,264.50.
Most Affordable Cities for Singles
1. Wichita, KS
Wichita is the most affordable U.S. city for singles. The city has the lowest median studio rent, $565 per month, among all 50 cities included in the index. With a median nonfamily income of $38,412, a single renter can expect to spend just 17.65% of their annual income on rent.
2. Minneapolis, MN
Thanks to relatively high nonfamily income and cheap housing, Minneapolis ranks as the second most affordable city for single renters. Given a median studio rent of less than $1,000 each month, singles can expect to allocate a reasonable 20.43% of their annual income toward housing costs. It is worth noting that Minneapolis is the second most friendly city for single female renters.
3. Colorado Springs, CO
Compared to the high housing costs in Denver, studio homes in Colorado Springs are much more affordable for renters, with a median of $910 monthly. Based on a median nonfamily income of $53,185, single renters can expect to spend 20.53% on renting a studio, taking the place on our affordability list.
4. Seattle, WA
Seattle is the fourth most affordable city in the country for singles. Strong income levels boost the average single renter’s ability to live alone despite expensive housing costs. Given a median nonfamily income of $83,237 and a median studio rent of $1,450, singles would only need to spend 20.90% of their income per year on renting a studio. It is the only city among the most affordable markets with a median studio rent exceeding $1K per month.
5. Columbus, OH
Columbus closes out our 2023 rankings as the fifth most affordable city for singles. Median studio rent rose only 0.12% year-over-year. With a median nonfamily income of $48,759, an average single renter in Columbus would only need to spend 20.92% of their annual income on a studio home. Meanwhile, the city ranks as the third most affordable market for single women.
Housing Burden Among Singles, Broken Down by Sex
Many single renters feel the effects of strenuous economic conditions when considering the gender wage gap. According to Pew Research, the gap barely narrowed in 2022 – for every dollar men earned, women earned only 82 cents. Translating to housing, the gap means it is harder for women to buy or even rent a home independently.
Our analysis indicates that across the top 50 U.S. cities, single women, on average, would have to spend 1.24 times more of their annual income on renting a studio than their male counterparts. Given the high rental prices and relatively low single income, New York City, Detroit, Miami, and Boston remain the top four unaffordable cities for single men and women. We see a different story, however, when ranking the cities by the housing burden gap.
El Paso is the Most Unfriendly City for Single Female Renters
The list below highlights the 10 U.S. cities with the worst housing burden gap among single renters. In El Paso, TX, single women would have to spend 34.51% of their income on housing if they wished to rent a studio home and live alone, over the commonly known 30% standard for housing affordability. Meanwhile, single men would only need to spend 18.12% of their income to do so.
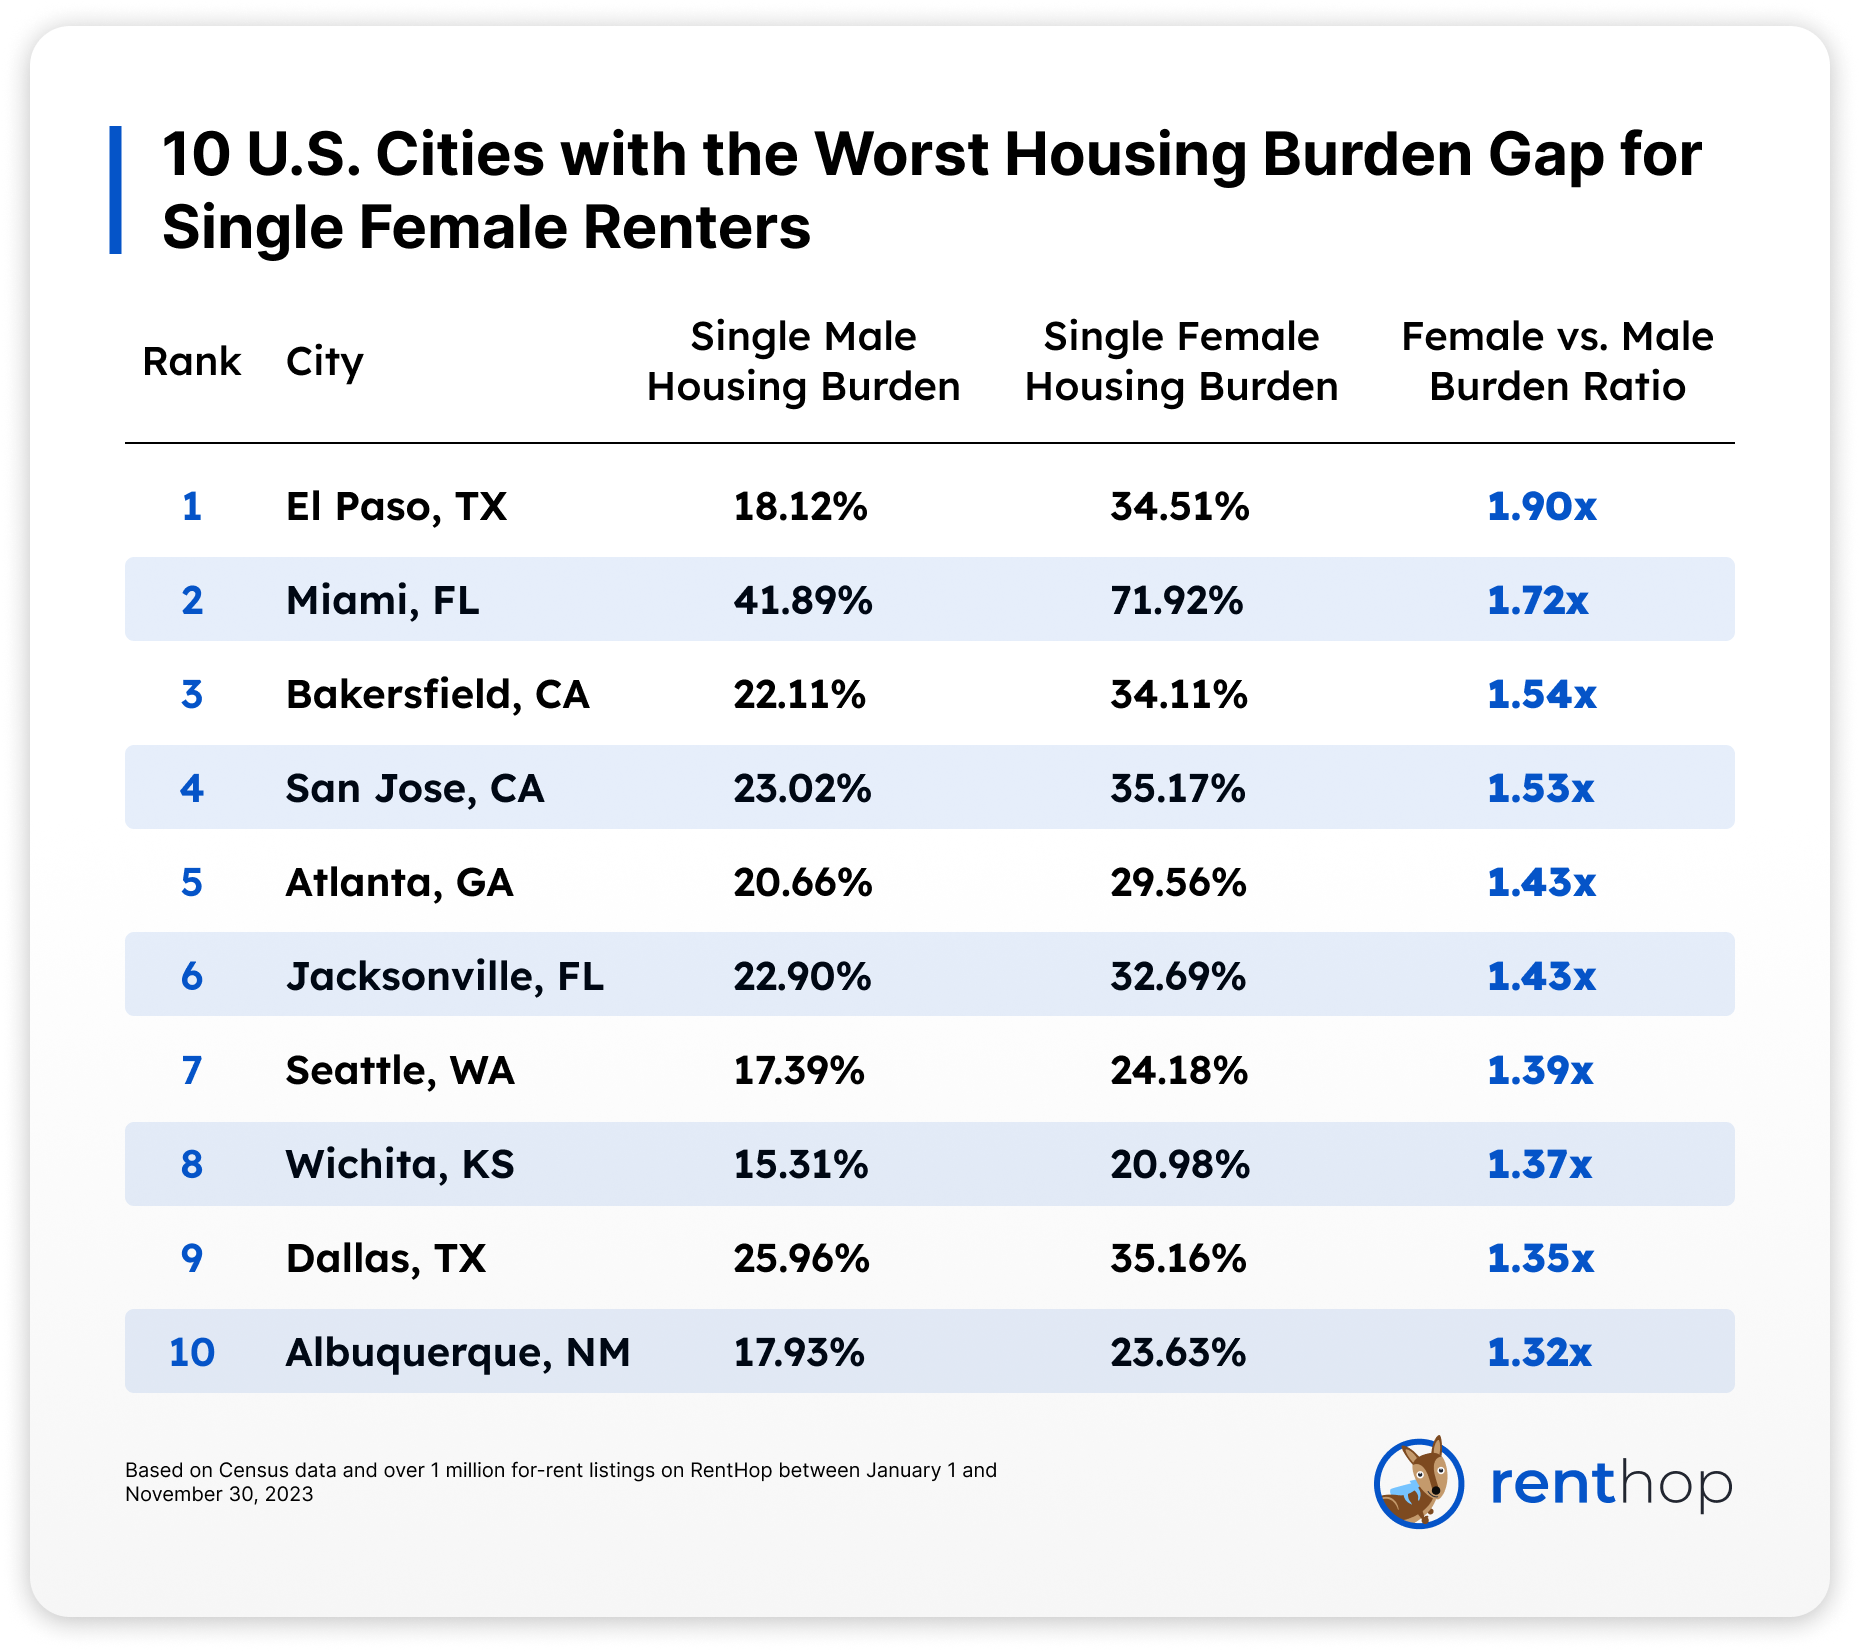
While California has a smaller gender pay gap at the state level compared to many other states, two of its cities, San Jose and Bakersfield, are ranked as some of the most unfriendly cities for single women to rent a studio in. In San Jose, the median studio rent is $2,049. This means that a single female renter making the median nonfamily household income of $69,915 would have to spend 35.17% of their annual income on rent. Single men, on the other hand, would spend only 23.02% of their income on a studio home with a median income of $106,818.
Indeed, studio homes are cheaper to rent in Bakersfield, but single women tend to make much less than in many other California cities, making it challenging for them to live alone. The housing burden for single females is 34.11%, whereas for single men, it is 22.11%, way below the housing affordability standard.
Methodology
The RentHop Singles Index analyzes both proprietary and ACS Census data to provide a snapshot of housing affordability for single-income households across the 50 most populous cities in the country. To compile our housing price data, we pulled every listing for a studio apartment advertised on RentHop from January 1 to November 30, 2023. In theory, a single person can rent a larger space, but we chose this unit type to represent the minimum space in which one can live alone.
To calculate the index, the following statistics were used:
1) Median non-family household income from the U.S. Census
2) Median advertised prices for the “studio” unit type via RentHop data
3) Year-over-year price changes for the “studio” unit type based on RentHop data
4) Population count by city from the U.S. Census
This year, the income factor is updated to median nonfamily household income. Median values are less likely to be skewed by outliers and, therefore, more representative of the income distribution and what typical single Americans make.
For more information on our methodology or to contact our data team, please email press@renthop.com.
Full Data
You can learn more about our index this year using the two interactive tables below. The first table includes overall rankings and housing burden, and the second one further breaks down the data by sex.


