If you live in Boston, you are probably no stranger to moving truck permits. Contacting moving companies and packing up is one hassle. But you also need to apply for a moving truck permit and post the “no-parking” sign. Otherwise, you’ll be in for a rude awakening on move-in day.
Moving truck permits partially reflect the housing demand in Boston. The number of issued moving truck permits usually surges each year from August through the first couple of days of September in accordance with the college move-in days. Generally speaking, the more moving truck permits issued, the more real estate activity there is.
As one of the major cities hit hard by COVID-19, Boston saw a huge decline in renter demand. This year, we examined how the pandemic affected the Boston housing market, specifically by reviewing the number of moving truck permits issued.
The number of moving truck permits issued by the city is down 14.7% this year
Figure 1 below summarizes the number of issued moving truck permits with an expiration date between January and September, from 2015 to 2020. In total, 11,885 permits have been issued so far in 2020, 14.7% less than the same time period in 2019.

Knowing the totals is not good enough. By comparing the number of moving truck permits issued by month in the past six years, we could better understand the impact of the coronavirus pandemic. Figure 2 below breaks down the number of issued moving truck permits by month, covering the period from January 2015 all the way through September 2020.
Moving Truck Permits by Month

The first confirmed case of COVID-19 in the U.S. was reported on January 20, 2020. On February 1, Boston announced its first confirmed case. As cases soared, the city entered the lockdown in mid-March. Moving came to a halt in April, with the total number of moving truck permits issued fell to 458, the lowest since January 2015 and 47.7% fewer than April 2019. The number continued to stay low through June, putting downward pressure on rents. In Boston, one-bedroom median rent was down in 2.6% year-over-year in June 2020, according to RentHop data.
August topped all previous months in terms of the number of moving truck permits issued in recent years. This is mostly because of the college move-ins (for most colleges, the move-ins were twice as long). Remember, many students moved into dorms, not rental properties, and the surge might not fully represent the demand in the Boston rental market. Once the move-in madness passed, the rental demand could fall again. Based on the data, it looks like September 2020 is on track to be the worst month of September compared to previous ones. The pandemic has driven down the rental demand across Boston. The one-bedroom median rent currently sits at $2,350, 6.0% lower than last year.
West Roxbury, Seaport, and Fenway-Kenmore Experienced Drops in Permits Issued
While overall, fewer moving truck permits have been issued so far in 2020, some areas saw more significant drops compared to others. The map below highlights Boston zip codes as well as the number of permits issued in 2020. It highlights the year-over-year change and the difference from the yearly average (2015- 2019). The darker the shades, the fewer issued permits compared to 2019.
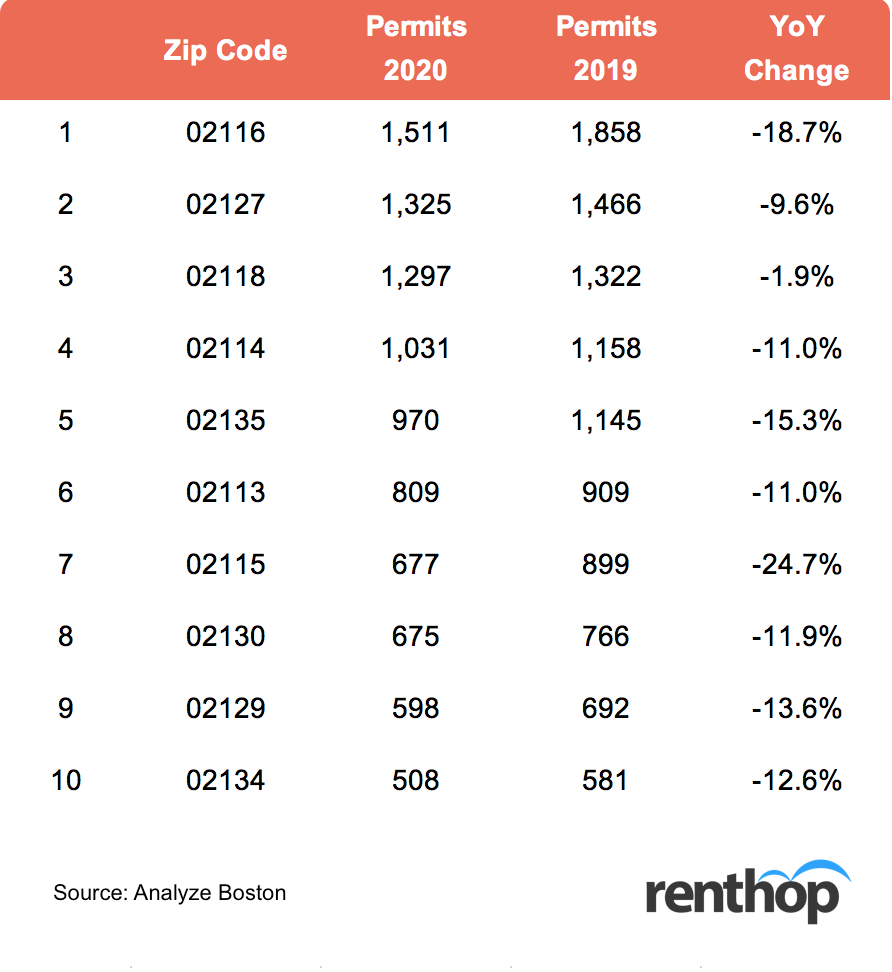
Of the 40+ zip codes included in this map, zip code 02132 (West Roxbury) saw the largest drop in the number of issued moving truck permits (22 permits, YoY -53.2%), followed by zip code 02210 (Seaport), which saw a YoY of -46.7%. Table 1 below features the 10 zip codes with the most number of moving truck permits issued so far in 2020. Note how the numbers are all lower compared to the same period in 2019.
Rent Dropped in Some Zip Codes Amid Moving Downtrend
In addition to grouping and analyzing issued moving truck permits by their expiration dates, we also explored the relationship between rental prices and moving truck permits. To assess the correlation between year-over-year median rental price changes and differences from average yearly issued permits, we plotted the two against one another and calculated the correlation coefficient.
We noticed a slight positive correlation (R2 = 11%) between the year-over-year rent change and the difference from the yearly average of permits issued among zip codes, which states that as zip codes experiencing fewer moving activities compared to the yearly average from 2015 to 2019 saw bigger price drops.

Methodology
This report examines how COVID-19 has impacted the Boston rental market, specifically through the number of issued moving truck permits and rental rate changes. The moving truck permit data is made public by Analyze Boston. Median one-bedroom rents and year-over-year median rent growth by zip code were calculated using RentHop’s proprietary listing data. For the regression analysis, we included only zip codes with over 10 moving truck permits issued in 2020.
Our previous Boston Move-In Day studies can be found here:


