Often a symbol of city living, rats scamper along the streets, appear in restaurants and businesses, and sometimes make their way into residential areas. While many city residents accept rat sightings as a way of life, increasing levels of rat activity can raise concerns about an area’s safety and cleanliness. Rats carry a plethora of diseases that range in severity, and public health officials spend ample time and energy attempting to decrease the amount of rodent foot traffic in their respective cities.
RentHop Rat Study
Every year, RentHop collects data from four major U.S. cities to help renters and homeowners understand the levels of rodent activity in their area, helping them decide where to live. This year, we analyzed 311 rodent complaints in Boston, Chicago, New York City, and Washington D.C. We discovered that three cities had received more rodent complaints compared to the same time frame in 2021. At this rate, those cities will end 2022 with an overall higher amount of rodent activity than last year. Only one city’s rodent activity decreased at a significant enough rate to suggest it will remain lower than 2021’s complaints.
Rodent Complaints by City
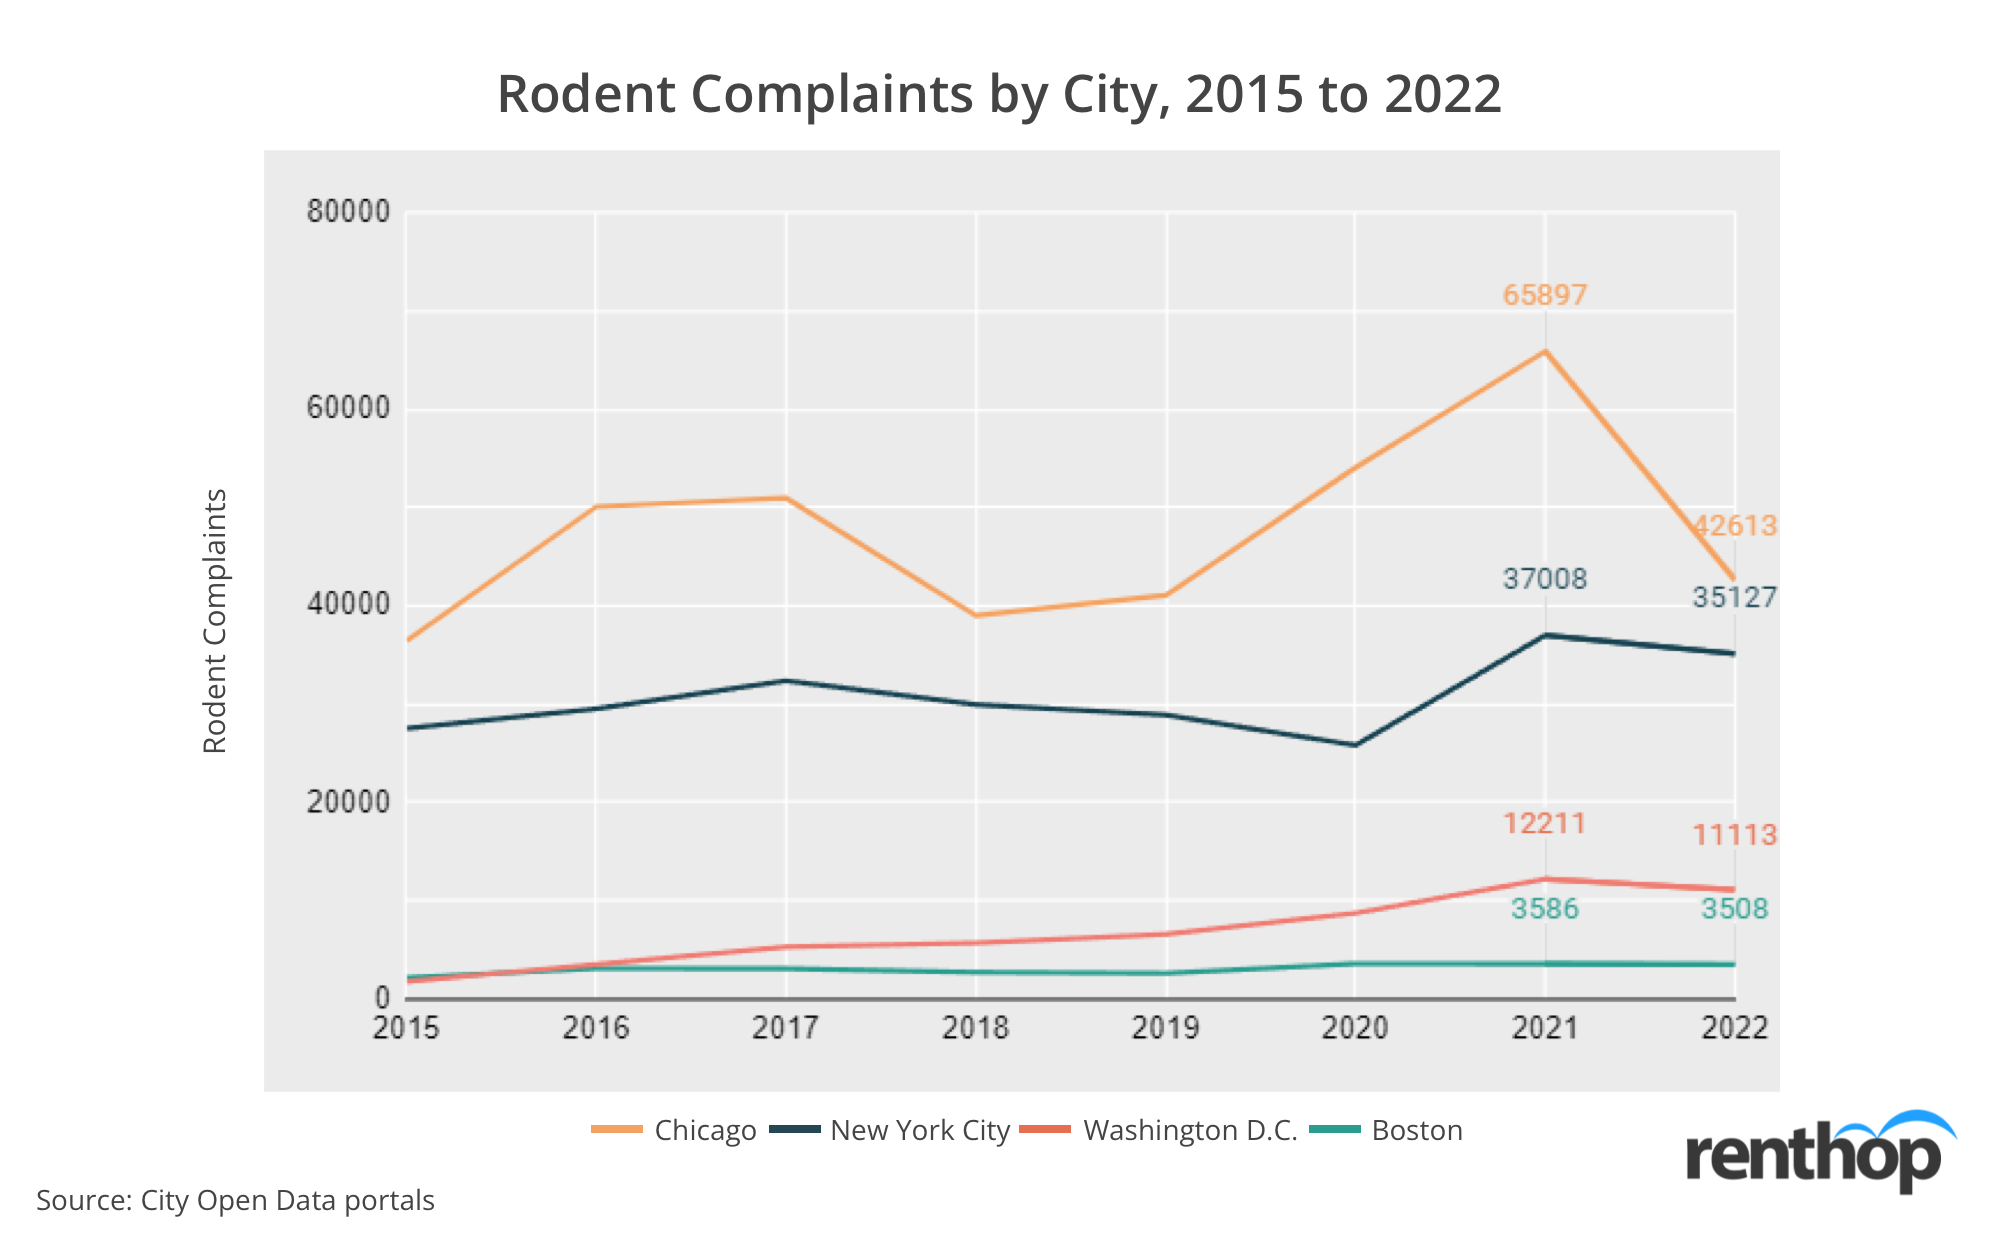
Figure 1 below highlights the number of rodent complaints between January 1 and October 18, from 2015 to 2022. While rodent activity appears to decrease from 2021 to 2022, this chart does not consider that there are still two months worth of data for the remainder of 2022. New York City, Washington D.C., and Boston will likely end 2022 with more rodent complaints than in 2021.
Rodent complaints in NYC
New York is on track to outpace last year’s total number of rodent complaints. This year, rodent complaints in 2022 are higher than they were at the same time in 2021, where last year’s complaints reached a total of 37,008 compared to their year’s 35,127. However, as RentHop collected this data in October of 2022, that still means there is time for more rodent complaints to stack up and ultimately pass 2021’s statistics. By the end of October 2021, NYC’s 311 system received 33,567 complaints, meaning NYC currently has 4.64% more complaints than last year.
Rodent complaints in Chicago
After the number of rodent complaints reached 65,897 in Chicago in 2021, the number has slightly cooled throughout 2022. From January 1st 2022 to October 18, 2022, Chicago has received 42,613 rodent complaints via the 311 system, a 35.33% decrease from last year’s complaints. In October of last year, Chicago had received 60,138 complaints about rodents, meaning that this year’s complaints are down 32.72% compared to October 2021.
At RentHop, we took a deeper dive to understand how rodent complaints changed year over year in four cities across the country, along with the five neighborhoods in NYC.
Select one of the cities below to learn more:
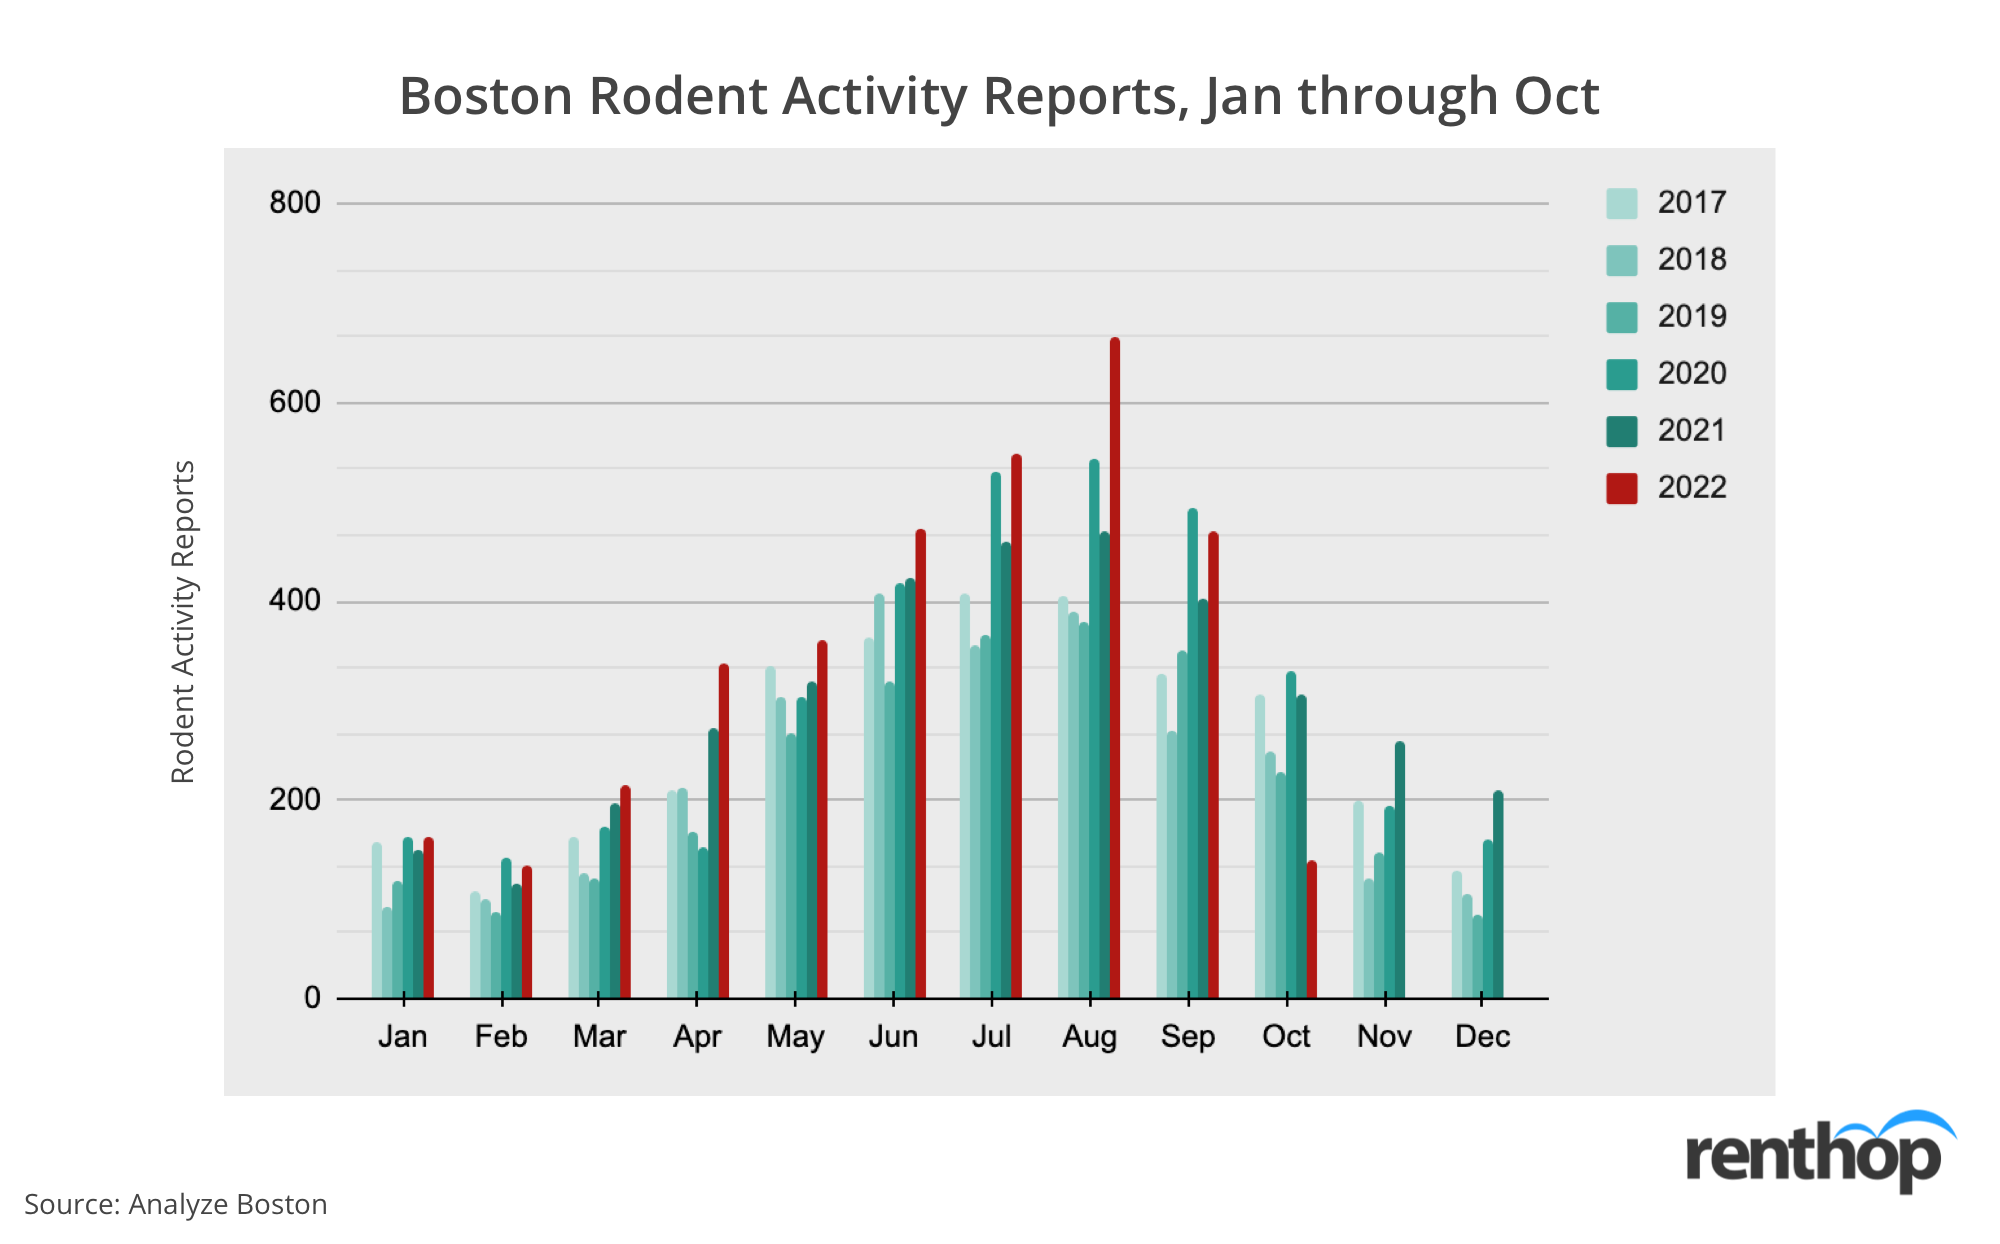
Rats are on the rise in Boston – rodent activity is up 12.6% this year
While rat activity decreased in Boston from 2020 to 2021, residents now report more rodent activity throughout the city. As of October 18th, rodent complaints were 12.6% higher than they were at the same time last year. Rodent activity is the highest it has ever been since RentHop began collecting data on Boston’s rodent activity in 2015. Throughout 2022, Boston’s 311 system received 3,508 complaints, which translates to 5.19 complaints for every 1,000 residents.
Which Boston neighborhoods are run by rats this year?
With the closure of many Boston restaurants and businesses throughout the pandemic, rats in Boston are forced to adapt and find new food sources, forcing them to explore more residential areas. Bostonians now run into rats in neighborhoods at a higher frequency than years prior.
The city recently introduced carbon monoxide systems in an attempt to remove large rat populations throughout the city. Despite the city’s effort to contain a growing population, their new devices cannot keep up with the rodent reproduction rate, further infesting the city. Continue reading to find which neighborhoods are the most rat-prone.
The interactive map below indicates the concentration of rodent complaints in Boston. Neighborhoods in darker shades have a higher concentration of rodent complaints in 2022. It is highly possible that larger neighborhoods receive more complaints than smaller neighborhoods, so we normalized the number of rodent complaints by land size. You can click on the polygons to learn more about each neighborhood.
Downtown Boston is the most rodent-infested neighborhood for the third year in a row, where rodent activity has drastically increased. Last year, the 311 system received 527 reports but is currently up to 550 reports in 2022, outpacing last year’s amount by 4.4%. With two months left in 2022, this difference will likely increase.
The South End slid from the third most-infested neighborhood to the second this year, receiving 283 complaints, 22.3% fewer than last year’s final tally of 364. However, there is still time for their neighborhood to beat out last year’s amount of complaints. Beacon Hill drastically bumped from sixth to third place this year, with 91 complaints compared to 60 complaints from 2021, up a whopping 51.8%.
Residents complain about rats the most often in these neighborhoods
- Downtown – 550 complaints in 2022, 885 complaints/sq mi
- South End – 283 complaints in 2022, 384 complaints /sq mi
- Beacon Hill – 91 complaints in 2022, 290 complaints /sq mi
- North End – 56 complaints in 2022, 282 complaints /sq mi
- Bay Village – 11 complaints in 2022, 265 complaints /sq mi
Rodent complaints spiked the most in these neighborhoods:
- South Boston Waterfront – 6 complaints in 2021, 15 in 2022 (+150%)
- Beacon Hill – 60 complaints in 2021, 91 in 2022 (+51.8%)
- Mission Hill – 62 complaints in 2021, 89 in 2022 (+43.4%)
- Allston – 151 complaints in 2021, 190 in 2022 (+26%)
- Hyde Park – 97 complaints in 2021, 119 in 2022 (+23.8%)
Rodent complaints dropped the most significantly in these neighborhoods:
- Roslindale – 66 complaints in 2021, 50 in 2022 (-26.9%)
- South End – 364 complaints in 2021, 283 in 2022 (-22.3%)
- South Boston – 224 complaints in 2021, 190 in 2022 (-15.2%)
- North End – 66 complaints in 2021, 56 in 2022 (-15.1%)
- East Boston – 213 complaints in 2021, 188 in 2022 (-13.3%)
These are the most rodent-infested addresses in Boston this year
- 1 City Hall Plz, Boston, MA 02108 – 9 rodent complaints
- 40 Vernon St, Boston, MA 02136 – 9 rodent complaints
- 8 Duncan Pl, Boston, MA 02122 – 8 rodent complaints
- 10 Navillus Ter, Boston, MA 02122 – 8 rodent complaints
- 40 Queensberry St, Boston, MA 02215 – 8 rodent complaints
Chicago: Rat City
Last year, Chicago came out on top as the rat capital, receiving more complaints than any other city. While rat activity is slowing in Chicago, the city still receives the most 311 complaints out of the 4 metropolitan cities, with 42,613 reports as of October 18th. At this time last year, the city had already racked up a substantial 58,117 complaints, meaning rodent reports are overall down 23.20% compared to the total complaints they received by the end of October 2021. Per every 1,000 Chicagoans, the city receives 15.5 complaints, 6.7 fewer complaints than in 2021.
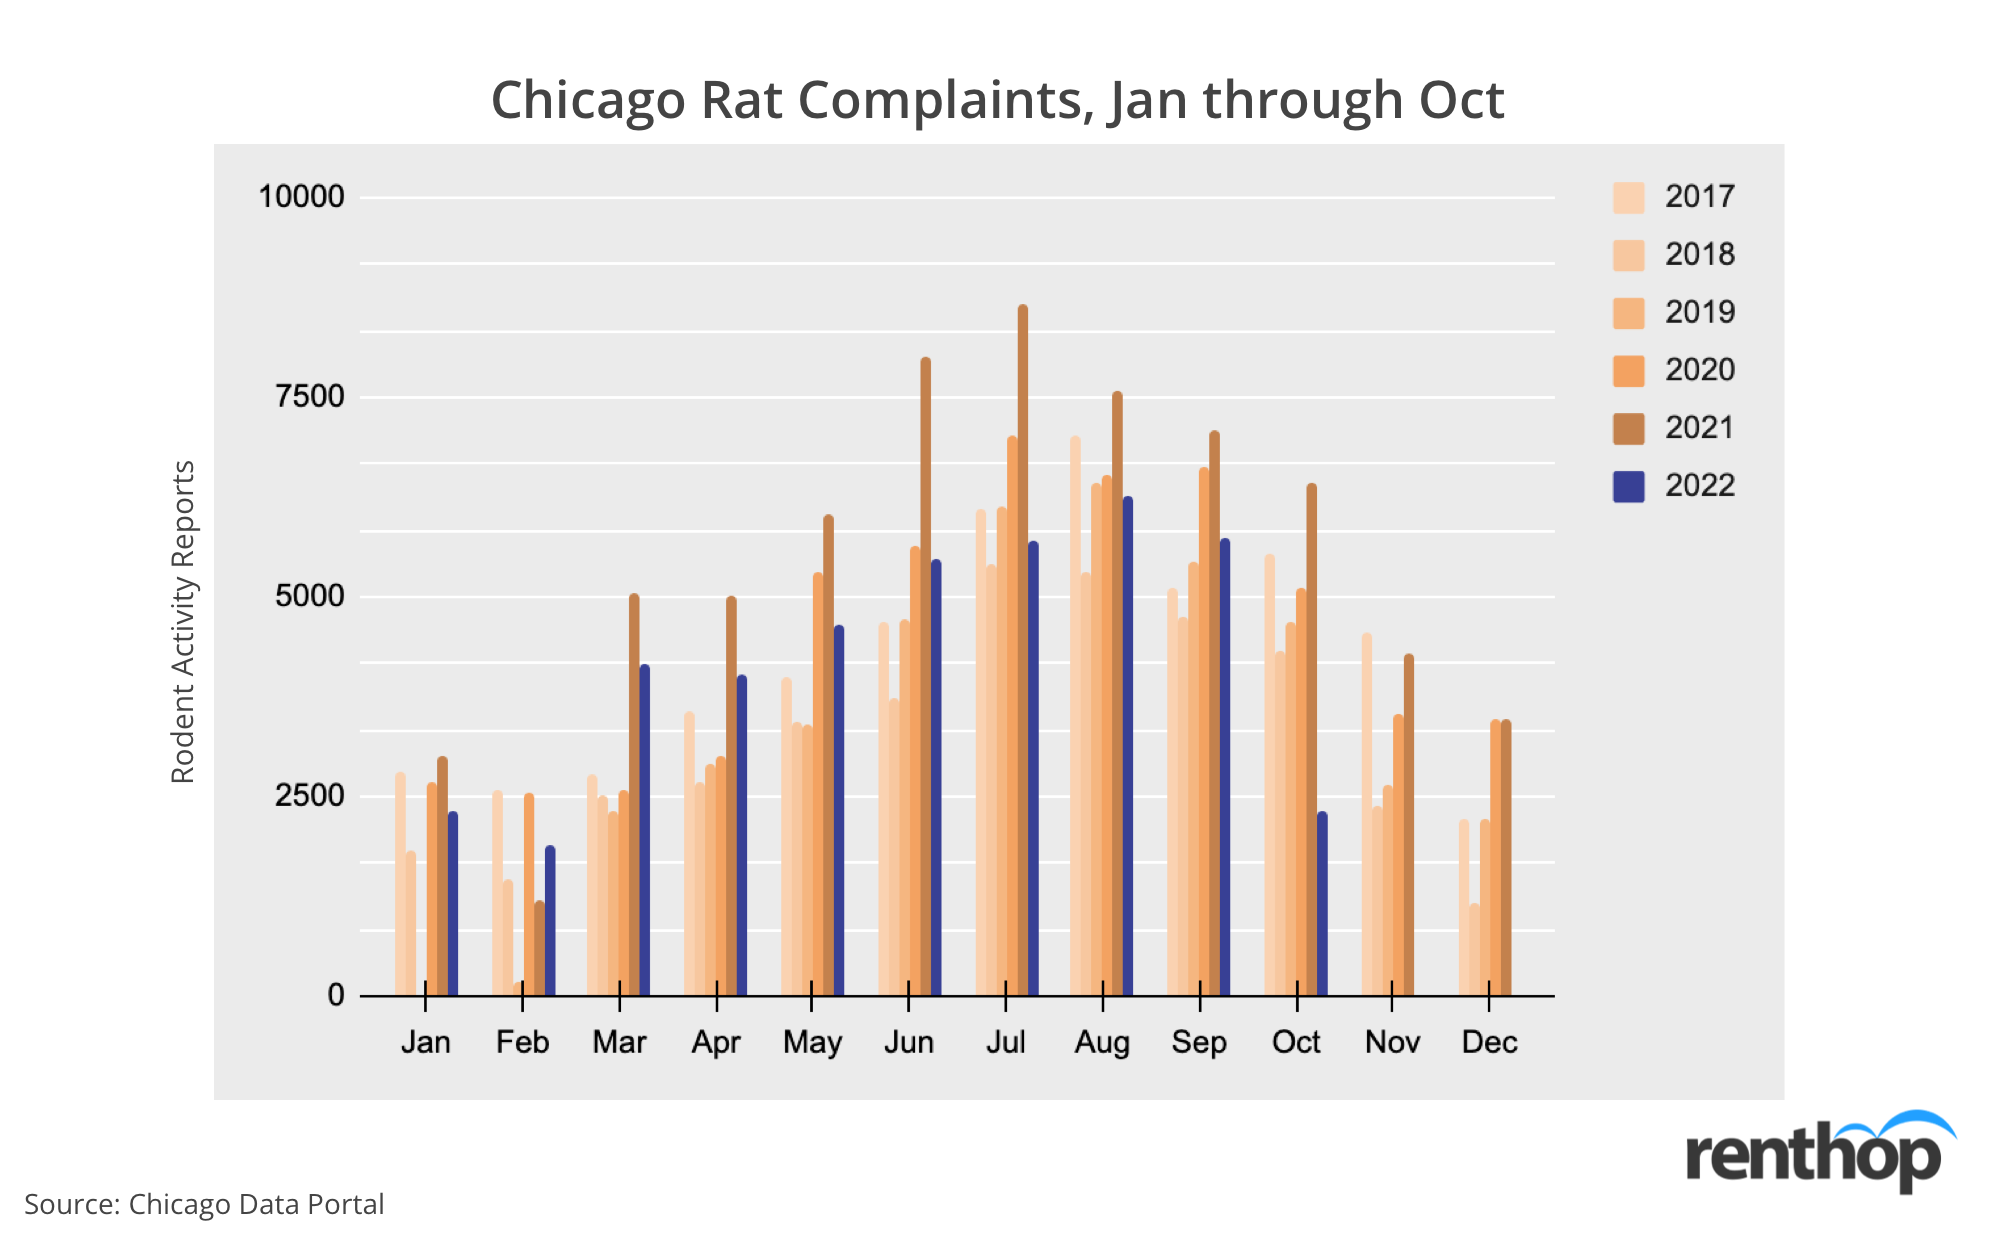
Rodent activity hit its peak in August 2022 when Chicago received 6,275 rodent reports. While this is 21.02% lower than in August 2020, that still meant that the city received 202 rodent complaints every day that month.
Which Chicago neighborhoods are dominated by rodents?
The interactive map below indicates the concentration of rodent baiting/rat sighting complaints in Chicago. Neighborhoods in darker shades have a higher concentration of rodent complaints in 2022. It is highly possible that larger neighborhoods receive more complaints than smaller neighborhoods, so we normalized the number of rodent complaints by land size. You can click on the polygons to learn more about each neighborhood.
This year, rat activity decreased in 98.71% of neighborhoods in Chicago.
Here are the neighborhoods with the most rodent complaints
- Bridgeport – 1,263 complaints in 2022, 604 complaints/sq mi
- Clearing – 1,406 complaints in 2022, 550 complaints/sq mi
- Lake View – 1,582 complaints in 2022, 505 complaints/sq mi
- West Town – 2,233 complaints in 2022, 488 complaints/sq mi
- Rogers Park – 871 complaints in 2022, 473 complaints/sq mi
Residents report more rats in these neighborhoods this year
- Douglas – 40 complaints in 2021, 47 in 2022 (+16.7%)
This year, only Douglas received a higher number of complaints compared to 2021. Out of 77 neighborhoods, only one witnessed growth in rat activity.
Rat sightings decreased the most in these neighborhoods
- West Lawn – 675 complaints in 2021, 297 in 2022 (-56.1%)
- East Garfield Park – 992 complaints in 2021, 462 in 2022 (-53.4%)
- McKinley Park – 314 complaints in 2021, 156 in 2022 (-50.5%)
- O’hare – 27 complaints in 2021, 15 in 2022 (-50%)
- Riverdale – 9 complaints in 2021, 7 in 2022 (-50%)
These are the addresses reported the most this year in Chicago
- 3675 N Elston Ave, Chicago, IL 60618 – 31 rodent complaints
- 2209 W Highland Ave, Chicago, IL 60659 – 25 rodent complaints
- 5238 S Union Ave, Chicago, IL 60609 – 22 rodent complaints
- 345 W 42nd Pl, Chicago, IL 60609 – 21 rodent complaints
- 128 N Laramie Ave, Chicago, IL 60644 – 20 rodent complaints
New York City is set to receive more rodent complaints this year
After rodent activity in New York City spiked in 2021, rodent reports are increasing at a slower pace. So far this year, residents have reported rodent sightings to the 311 system 35,127 times, compared to 37,008 times last year. When comparing these two data points, it could appear that rodent activity has decreased 5.08% from last year. However, with November and December still on the horizon, it appears that this year’s numbers will surpass 2021 complaints. As of October 18th, rodent complaints in NYC are up 11.35% compared to this time last year.
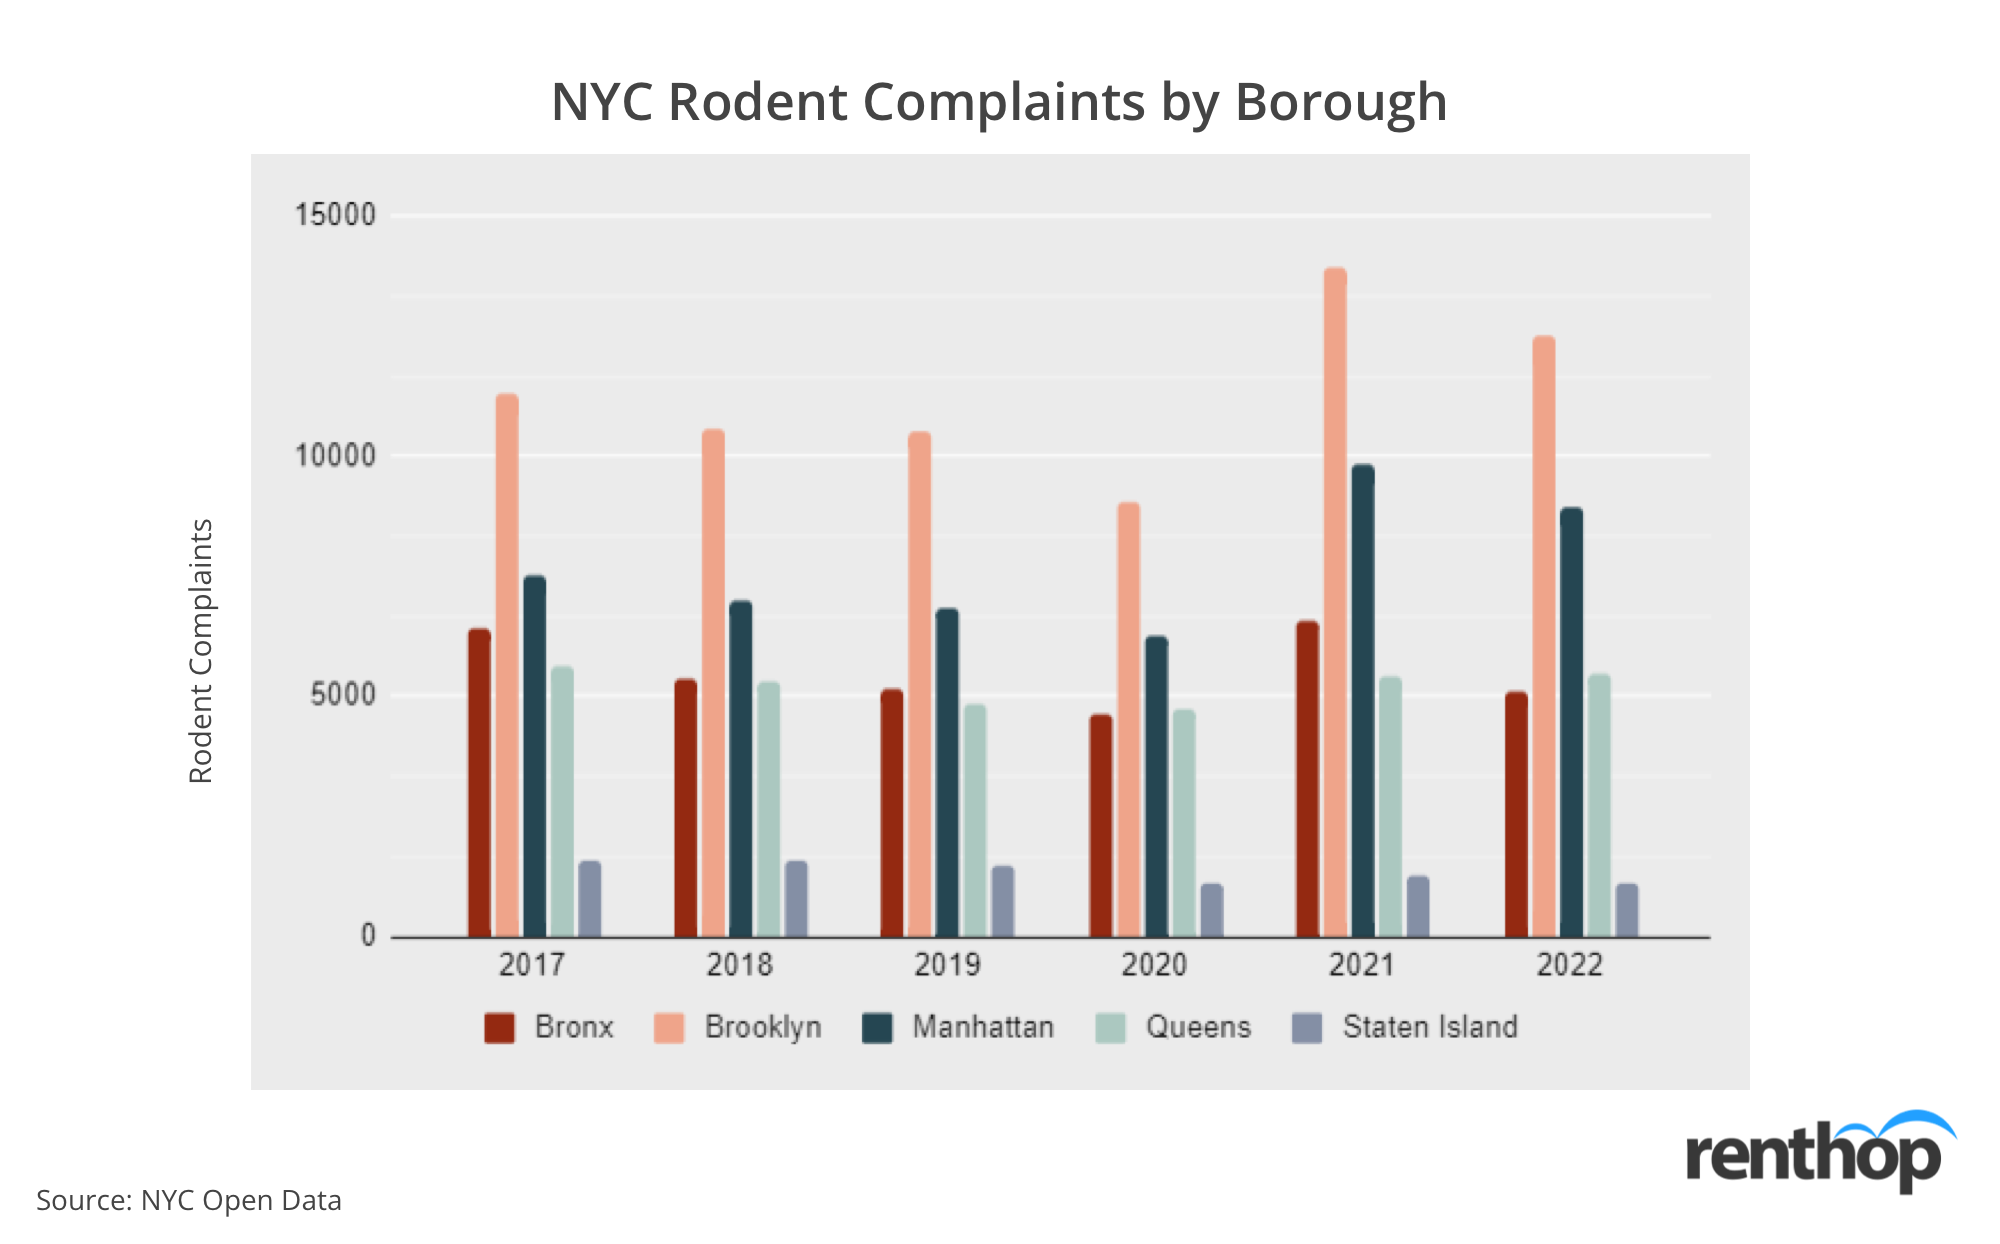
Manhattan tops all other boroughs with 4.3 rodent complaints per 1,000 population
Since New York City consists of five boroughs with their neighborhoods, we first analyzed the number of rodent complaints by borough. Figure 4 below indicates how the numbers have changed by year and by borough since 2017. So far, complaints this year are slightly lower in each neighborhood, but will likely outpace last year’s data by the end of December.
The Bronx
This year in the Bronx, complaints sit at 5,078, down 22.69% from the end of 2022, where the borough recorded 6,568 complaints. For every 1,000 people in the Bronx, the 311 system receives 3.44 complaints. When we released last year’s study, the borough had only received 4,682 complaints, meaning the Bronx is already outpacing last year’s report and witnessing an increasing number of rodent activity.
Queens, NYC
In Queens, the borough reported 5,476 rat sightings this year, compared to 5,425 for all of 2022. While complaints are only up 0.94% this year, there are still over two months left of data to further influence this increase. Queens currently receives 2.28 complaints per 1,000 residents.
Brooklyn, NYC
Similar to last year, Brooklyn continues to witness a growing number of rodents. At this time last year, residents complained 9,749 times, compared to 12,505 complaints so far this year, that’s an increase of 28.27% from this time in 2021. For every 1,000 Brooklyn residents, the borough receives 4.57 rodent complaints. Brooklyn receives the highest number of complaints out of the five boroughs.
Manhattan, NYC
Rats continue to dominate in Manhattan, where so far this year, residents have reported rat sightings 8,934 times. Last year in October, that number only hit 7,217 complaints, and the borough’s complaints have increased by 23.79%. In Manhattan, there are 5.27 complaints per every 1,000 residents, meaning this borough houses the highest concentration of rodents. The 2022 density is greater than any year prior, indicating a growing number of rats in the city.
Rodent-filled July: NYC’s most popular month for rat activity
Figure 5 below breaks down rodent complaints by month from 2017 to 2022. Throughout 2022, rodent sightings continue to surpass the number of complaints from any year prior.
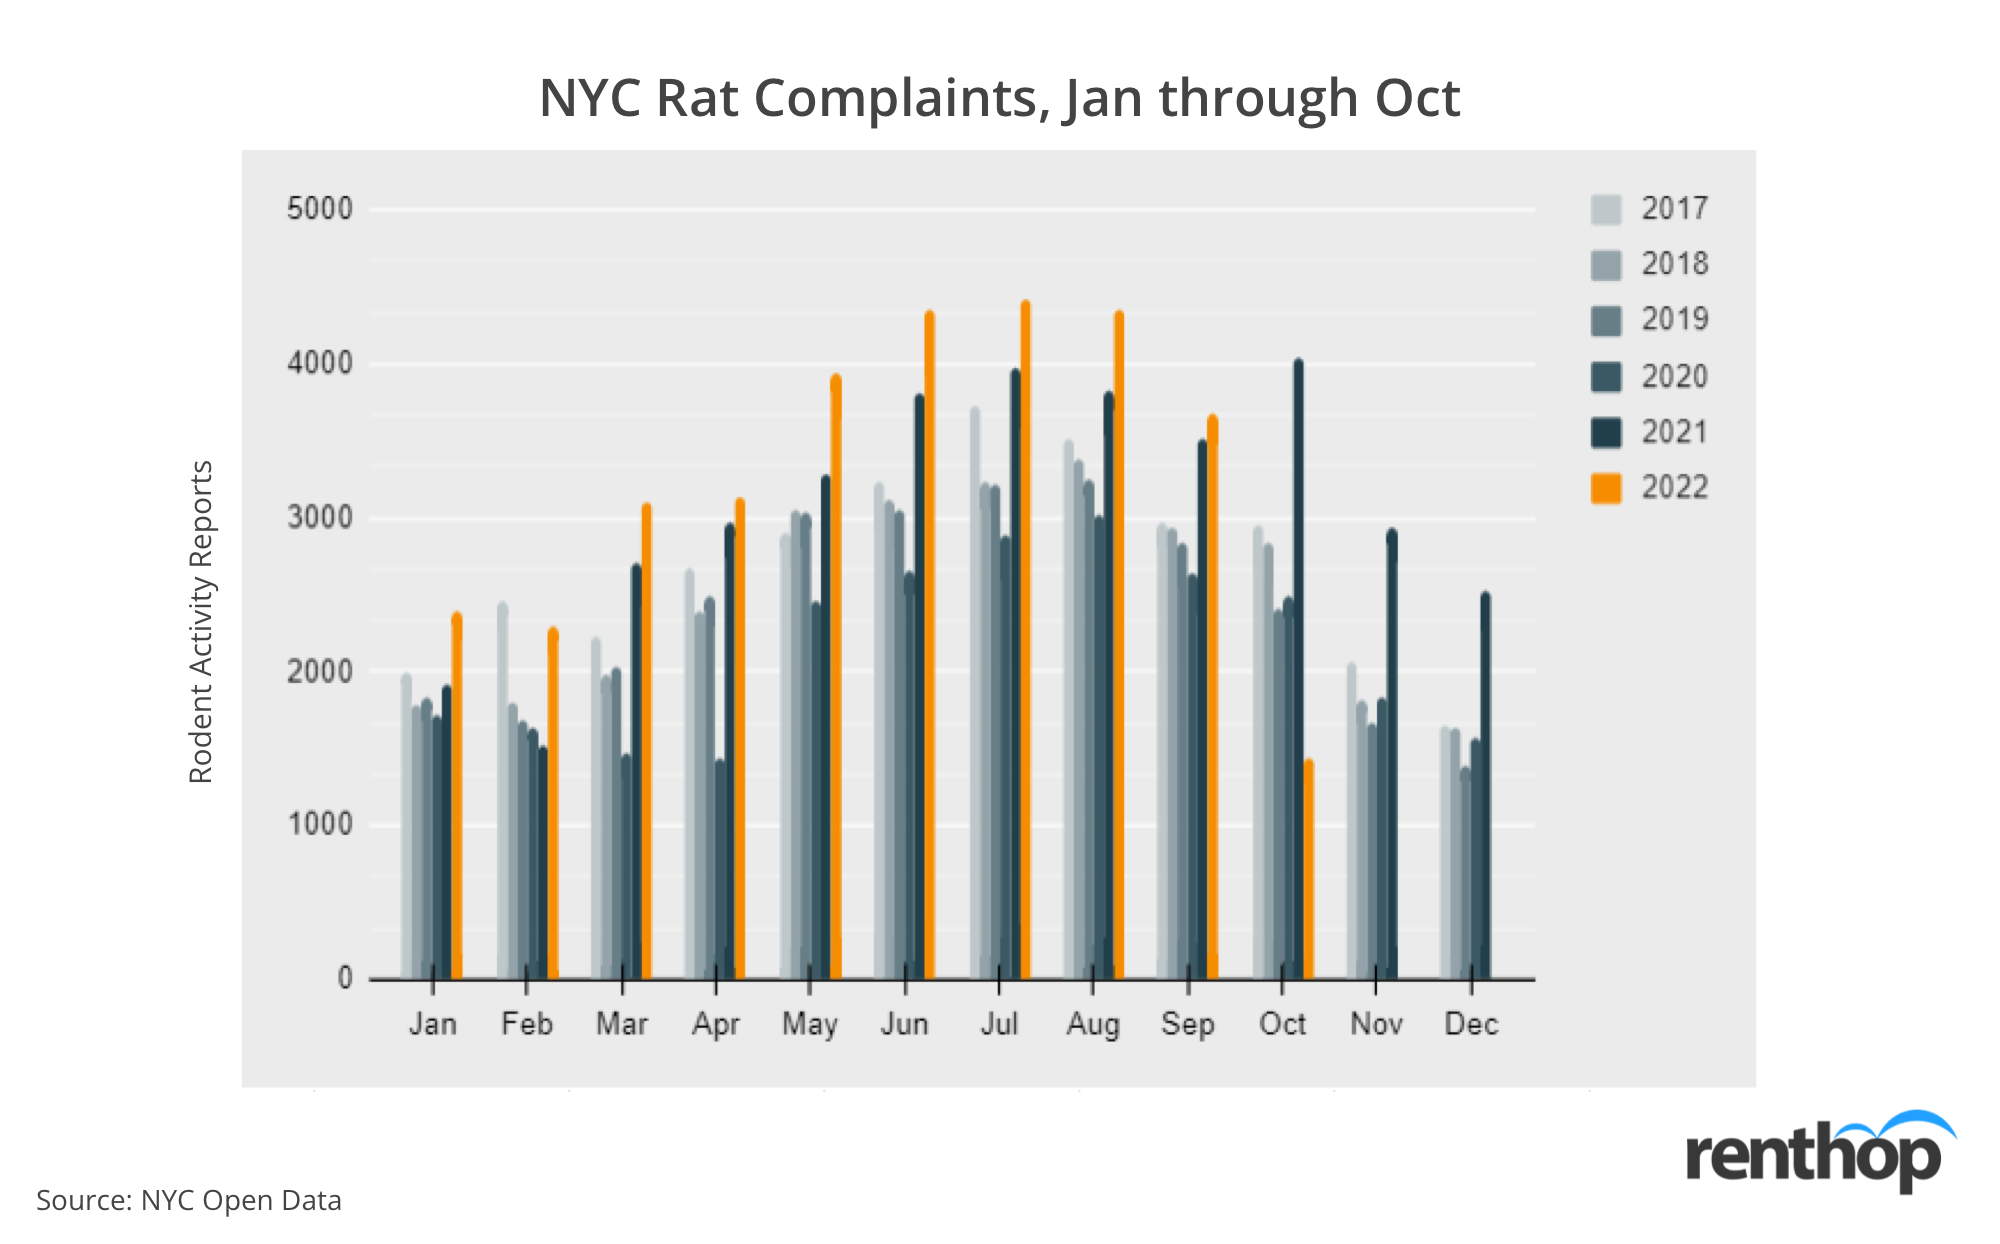
Rat sightings in New York City drastically increase throughout the summer months, when hot trash sits on the sidewalks for hours, inviting large quantities of rodents. Rodent activity peaked in July, with 4,421 complaints to 311, an 11.30% increase from the same period in 2021.
Is your neighborhood rodent-infested?
The interactive map below indicates the concentration of 311 rat/rodent sighting complaints in New York. Neighborhoods in darker shades have a higher concentration of complaints in 2021. It is highly possible that larger neighborhoods receive more complaints than smaller neighborhoods, so we normalized the number of rodent complaints by land size. You can click on the polygons to learn more about each neighborhood.
These neighborhoods received the most rodent complaints in 2022
- Harlem South, Manhattan – 863 complaints in 2022, 1,665 complaints/sq mi
- Upper West Side-Manhattan Valley, Manhattan – 704 rat complaints in 2022, 1,486 complaints/sq mi
- Upper East Side – Yorkville, Manhattan – 448 rat complaints in 2022, 918 complaints/sq mi
- Upper West Side (Central), Manhattan – 820 rat complaints in 2022, 899 complaints/sq mi
- Bushwick (West), Brooklyn – 684 rat complaints in 2022, 824 complaints/sq mi
Rodent sightings spiked in these neighborhoods
- Woodlawn Cemetery, Bronx – 1 complaint in 2021, 6 in 2022 (+800%)
- Dyker Beach Park, Brooklyn – 4 complaints in 2021, 29 in 2022 (+627.3%)
- Bay Terrace-Clearview, Queens – 4 complaints in 2021, 18 in 2022 (+500%)
- Brooklyn Navy Yard, Brooklyn – 1 complaints in 2021, 4 in 2022 (+450%)
- Astoria Park, Queens – 2 complaints in 2021, 8 in 2022 (+315%)
Rodent complaints dropped the most in these neighborhoods
- Pelham Bay Park, Bronx – 6 complaints in 2021, 2 in 2022 (-100%)
- Yankee Stadium-Macombs Dam Park, Bronx – 10 complaints in 2021, 2 in 2022 (-80.8%)
- Tribeca-Civic Center, Manhattan – 162 complaints in 2021, 72 in 2022 (-55.7%)
- Claremont Village-Claremont (East) – 72 complaints in 2021, 32 in 2022 (-55.5%)
- Co-op City, Bronx – 16 complaints in 2021, 8 in 2022 (-53.3%)
These are the addresses with the most complaints filed in New York City this year
- 558 West 184th St, New York, NY 10033 – 180 rodent complaints
- 31-35 Crescent Street, Queens, NY 11106 – 101 rodent complaints
- 1000 5th Avenue, New York, NY 11028– 74 rodent complaints
- Morningside Park, New York, NY 10026– 43 rodent complaints
- Msgr. McGolrick Park, Brooklyn, NY 11222 – 42 rodent complaints
Washington D.C. welcomes more rats in 2022
Washington D.C. witnessed a high volume of rodent traffic throughout 2021, and 2022 is stepping up to the plate. While this summer’s rodent activity did not surpass levels from June and July 2021, August and September of this year welcomed a high volume of rats in the city. At this rate, Washington D.C. could break its record for rodent complaints in a single year.
As of October 18th, Washington D.C.’s 311 system has received 11,113 complaints. At this time last year, the city had only received 10,620 complaints, meaning complaints are up 4.64% in 2022. Figure 6 below further breaks down the complaints by month and year. For every 1,000 people in Washington D.C., the city receives 16.12 complaints. However, this number considers the population of Washington D.C., which does not account for the number of employees who commute into the city to potentially report rats.
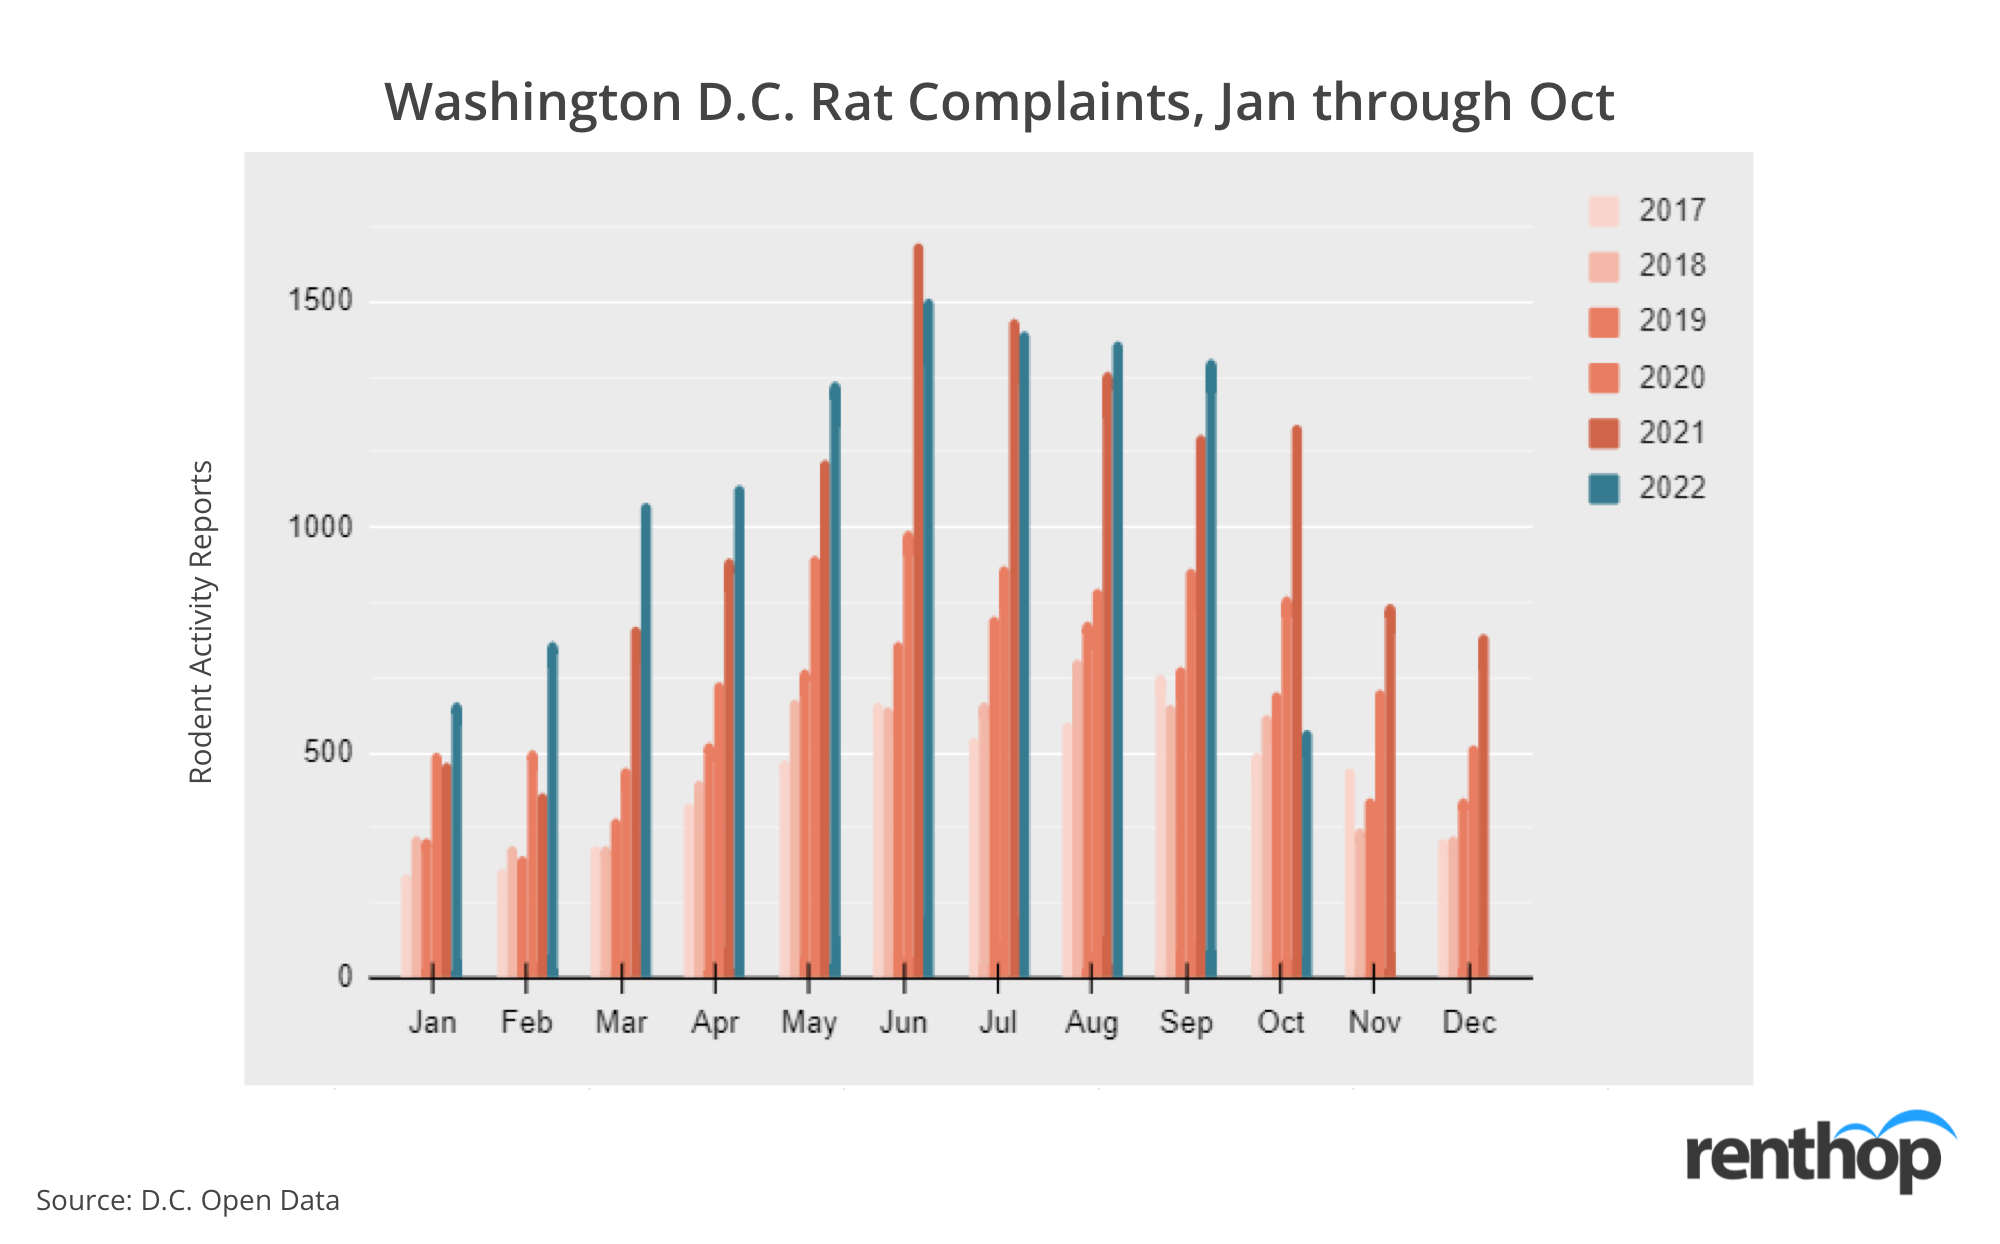
While the rodent population substantially peaked in the summer of last year, the peak and drop-off are less drastic in 2022, where the rodent population throughout the summer and early fall maintained stamina. From June 2022 to September, rodent complaints only decreased by 8.89%, indicating rats are getting comfortable and staying in the area.
Is your neighborhood dominated by rats?
The interactive map below indicates the concentration of rodent complaints in Washington D.C. Neighborhoods in darker shades have a higher concentration of rodent complaints in 2022. It is highly possible that larger neighborhoods receive more complaints than smaller neighborhoods, so we normalized the number of rodent complaints by land size. You can click on the polygons to learn more about each neighborhood.
For the third year in a row, Columbia Heights, Mt. Pleasant, Pleasant Plains, Park View witnessed the largest rodent activity. However, activity decreased by 5.2% this year, with 1,595 complaints, or 1,214 complaints per square mile.
These neighborhoods saw the most rodents this year
- Columbia Heights, Mt. Pleasant, Pleasant Plains, Park View – 1,214 complaints in 2022, 1,214 complaints/sq mi
- Shaw, Logan Circle – 515 complaints in 2022, 911 complaints/sq mi
- Howard University, Le Droit Park, Cardozo/Shaw – 578 complaints in 2022, 804 complaints/sq mi
- Brightwood Park, Crestwood, Petworth – 1,498 complaints in 2022, 597 complaints/sq mi
- Union Station, Stanton Park, Kingman Park – 956 complaints in 2022, 596 complaints/sq mi
Rodent complaints substantially increased in these neighborhoods
- Woodland/Fort Stanton, Garfield Heights, Knox Hill – 3 complaints in 2021, 18 in 2022 (+583.3%)
- Eastland Gardens, Kenilworth – 1 complaints in 2021, 4 in 2022 (+500%)
- Fairfax Village, Naylor Gardens, Hillcrest, Summit Park – 6 complaints in 2021, 20 in 2021 (+237.5%)
- Douglas, Shipley Terrace – 42 complaints in 2021, 69 in 2022 (+66.7%)
- River Terrace, Benning, Greenway, Dupont Park – 197 complaints in 2021, 327 in 2022 (+65.5%)
These neighborhoods witnessed the largest decrease in rodent complaints
- Mayfair, Hillbrook, Mahoning Heights – 67 complaints in 2021, 20 in 2022 (-70.6%)
- Saint Elizabeths – 8 complaints in 2021, 4 in 2022 (-53.8%)
- Hawthorne, Barnaby Woods, Chevy Chase – 38 complaints in 2021, 19 in 2022 (-52.6%)
- Congress Heights, Bellevue, Washington Highlands– 211 complaints in 2021, 134 in 2022 (-36%)
- Spring Valley, Palisades, Wesley Heights, Foxhall Crescent, Foxhall village, Georgetown Reservoir – 36 complaints in 2022, 27 in 2021 (-30%)
These are the addresses with the most complaints filed in D.C. this year
- 1350 Pennsylvania Avenue NW, Washington D.C. 20004 – 23 rodent complaints
- 3829 Kansas Avenue NW, Washington D.C. 20011 – 21 rodent complaints
- 1139 Harvard Street NW, Washington D.C. 20009 – 16 complaints
- 5515 Illinois Avenue NW, Washington D.C. 20011 – 16 complaints
- 600 Keefer Place NW, Washington D.C. 20010 – 15 complaints
Methodology
This study examines the rodent crisis in major U.S. cities, using 311 data from Boston, Chicago, New York City, and Washington D.C., and the population data was collected via U.S. Census Bureau. For this study, we limited the research time frame to January 2016 through October 18, 2022. We then geocoded the complaints using each city’s neighborhood shapefile and normalized the complaint count by land size. This allows us to fairly rank each neighborhood and provide better insights.
RentHop is all about data and facts. Our data science team conducts annual studies on rental data as well as 311 complaints across major U.S. cities. To get to know the city you live in, take a look at our previous studies on rodent complaints, human/animal waste complaints, noise complaints, and more.


