Have you ever come across rats carrying bits and pieces of leftover food? Or maybe you’ve seen them in your kitchen and gone completely wild trying to kill them? It is known that rats are rampant in the city and live among us, taking refuge and shelter on the streets, and even sometimes in our homes. What’s worse is that rodents are a major public health problem, and more and more resources are invested in rodent inspection and prevention.
RentHop Rat Complaint Study
Each year, we at RentHop examine the data from major U.S. cities, hoping to help renters and homeowners make an informed decision when it comes to housing. This year, we again reviewed the rat sightings data, and what we discovered isn’t great. Our study this year includes Boston, Chicago, New York City, and Washington D.C., and three of them saw a drastic increase in the number of rodent complaints.
Figure 1 below highlights the number of rodent complaints between January 1 and November 10, from 2015 to 2021. In Boston, the number went down 10% this year. In D.C., the number is a lot worse. As of November 10, 2021, DC 311 has received 11,029 rodent complaints, or 15.92 complaints/1,000 population. This number is 26% higher than in 2020.
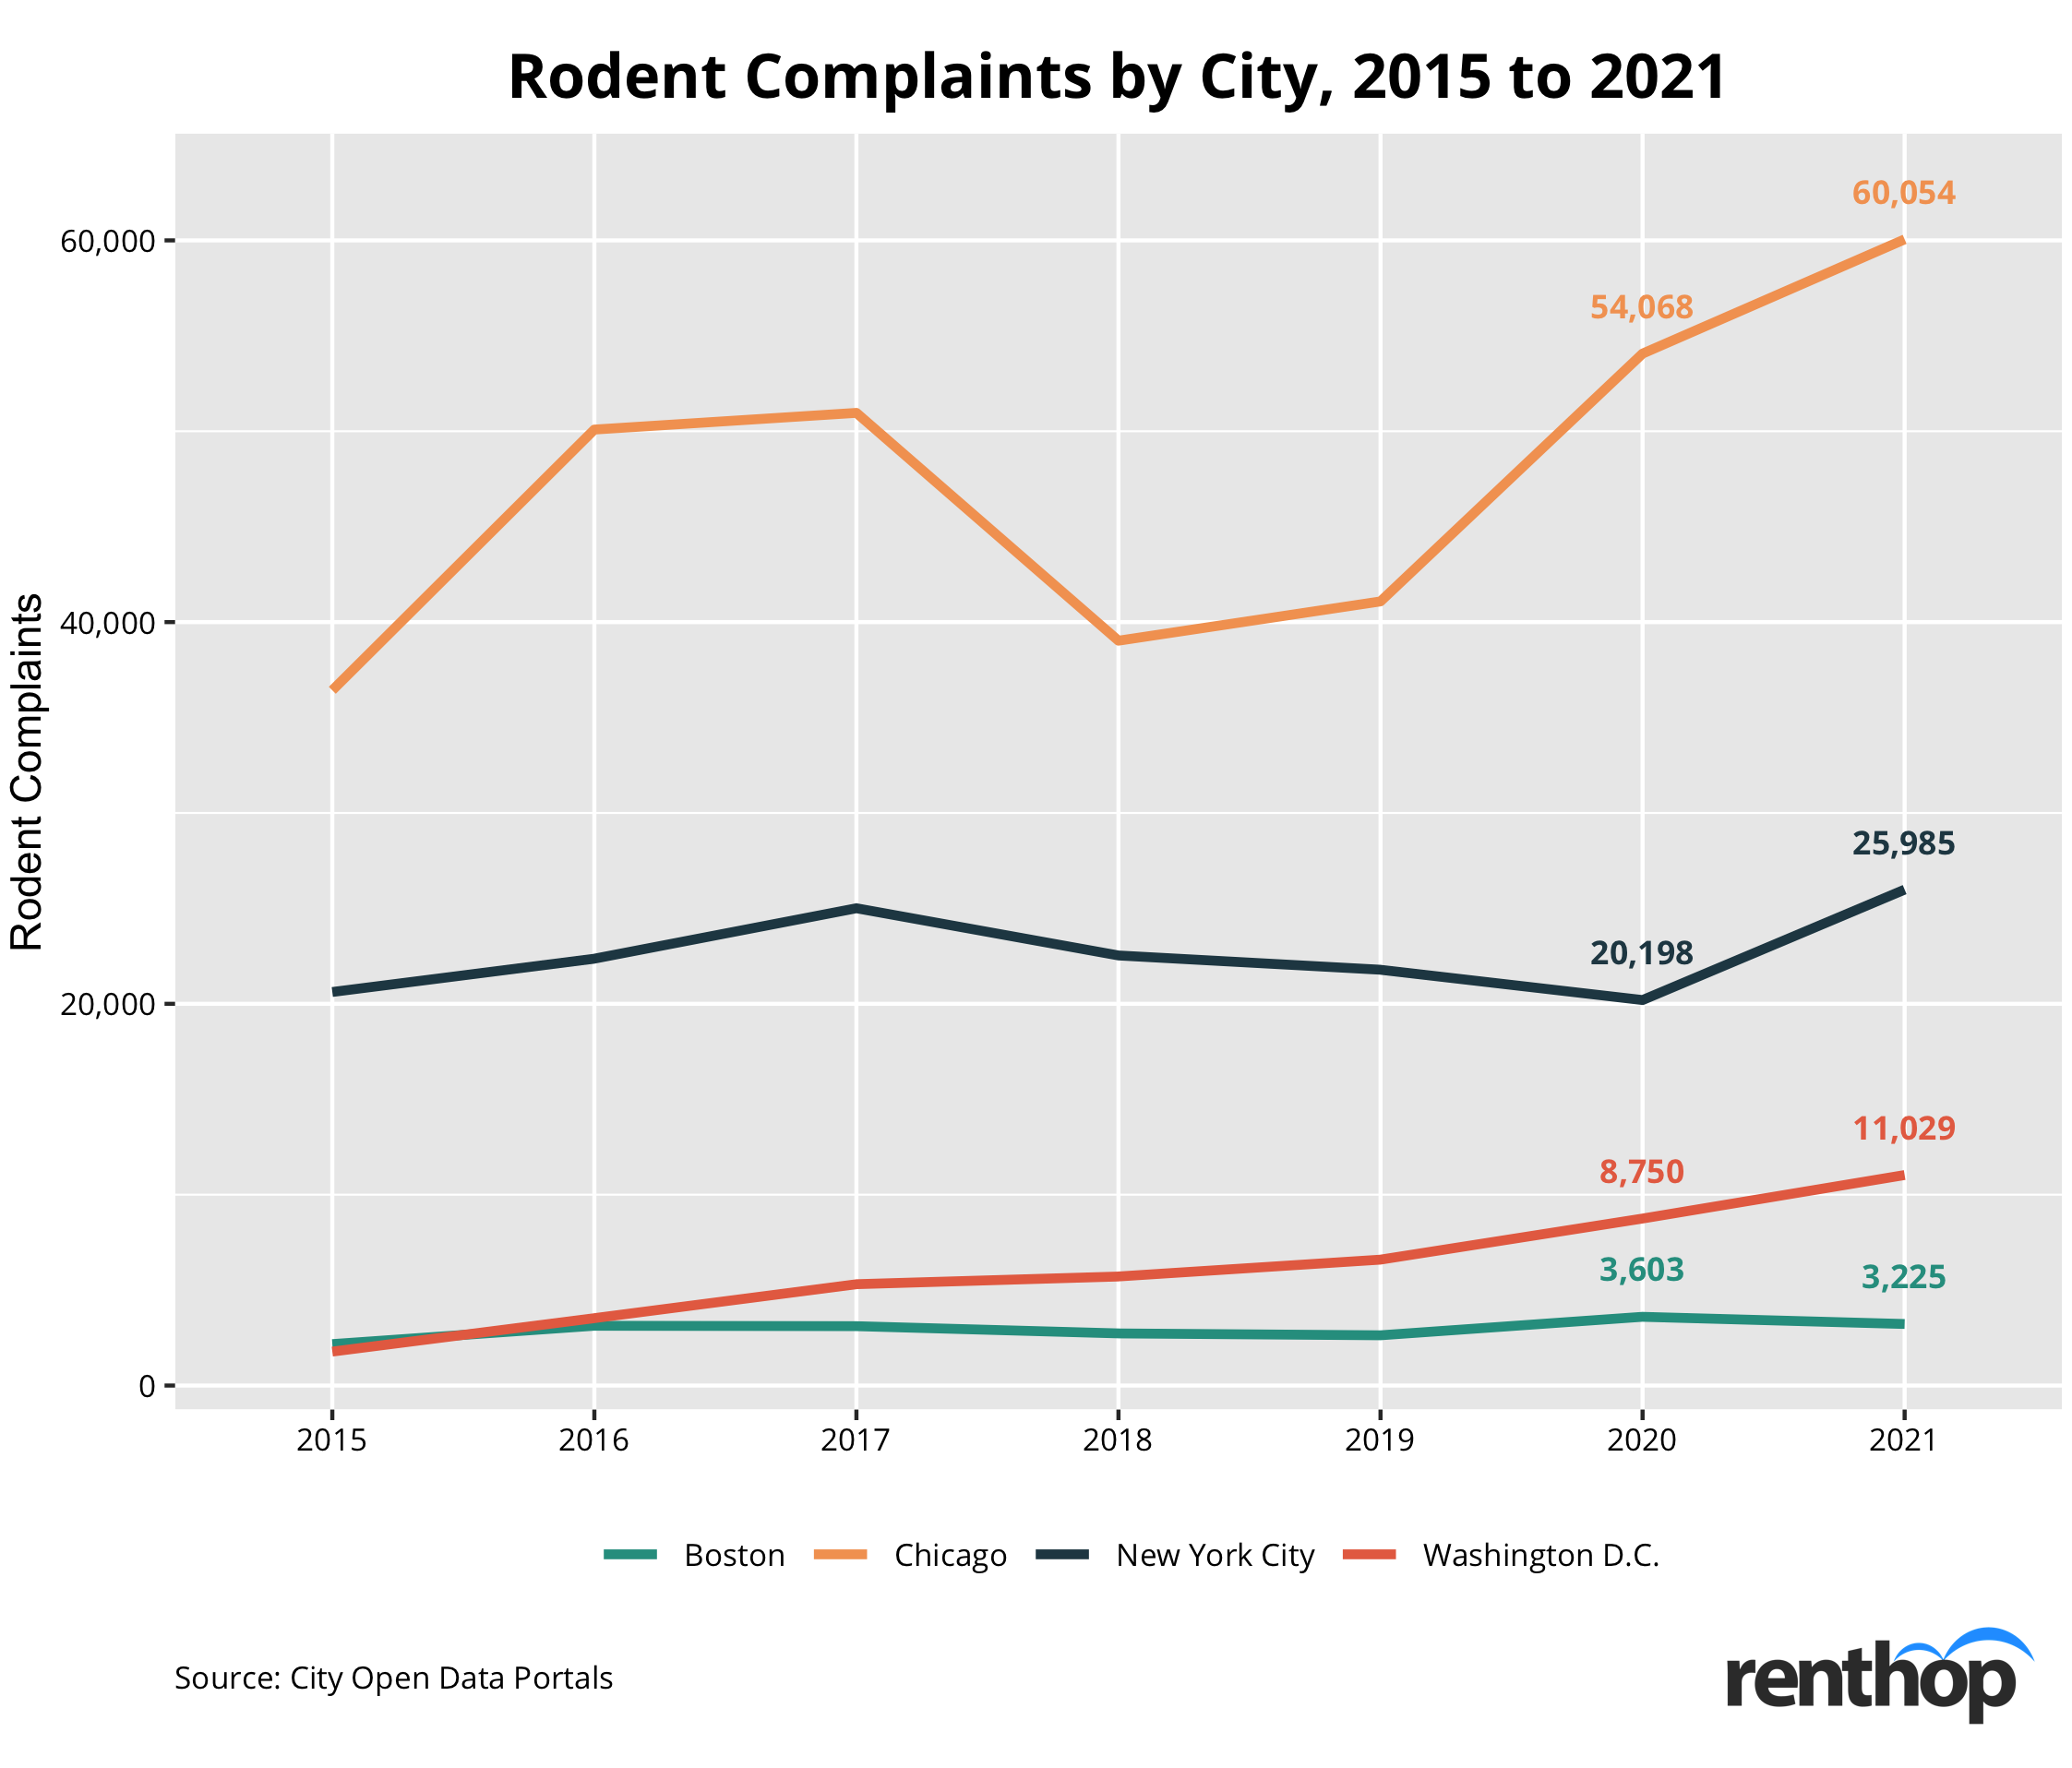
In New York, the number of rodent complaints decreased slightly in 2020, mostly due to reduced population and an overwhelmed 311 system. This year, though, things are quite different. As of November 10, 2021, New York 311 has received over 25,000 reports of rat sightings across the five boroughs, 28.7% more than last year.
Chicago, a.k.a. the rat capital, not surprisingly, has had the greatest number of rat sightings/1,000 population among the cities included. As of November 10, the city’s 311 reporting system received 60,054 rodent complaints or 22.2/1,000 population, an 11.1% increase compared to the same period last year.
Just knowing which city has the most rodent sightings isn’t good enough. We at RentHop further analyzed the data by neighborhood.
Select one of the cities below to learn more:
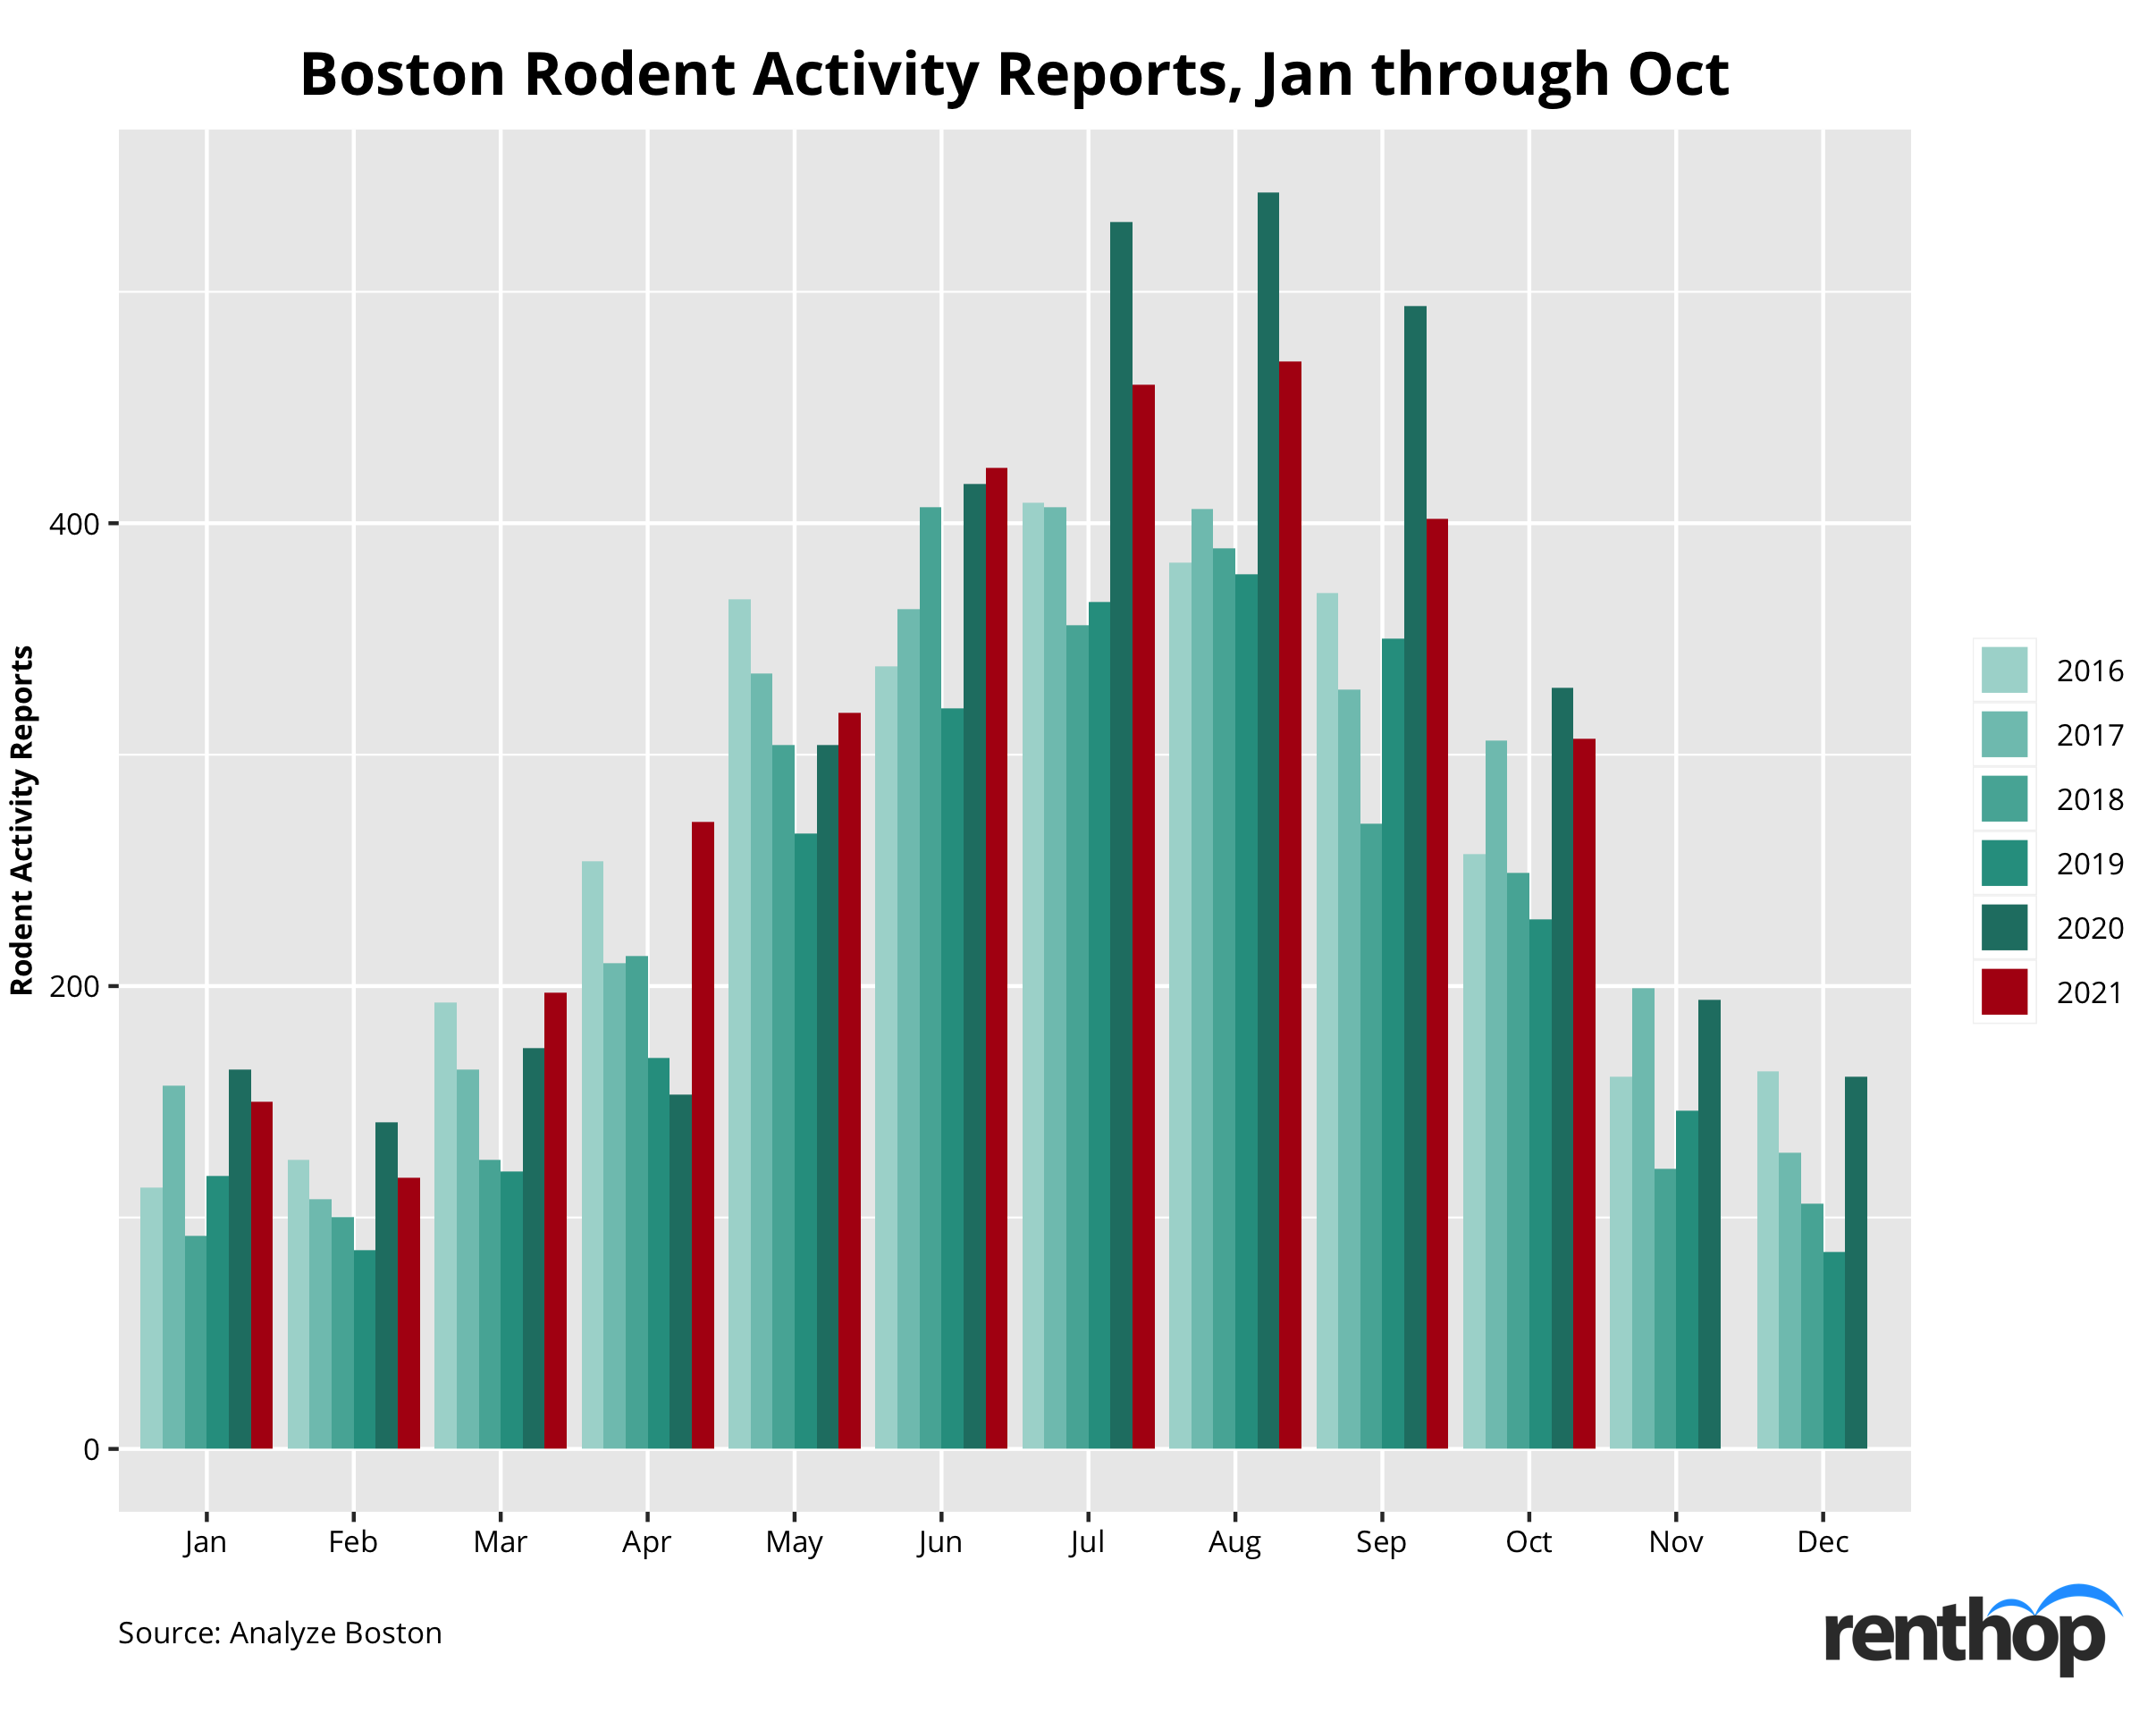
Boston can finally take a breather – rodent activity is down 10% this year
After a tough year with rats roaming around, we have some good news for Bostonians – 311 reports involving rodent activity are down 10% this year. As of November 10, Boston 311 received 3,225 rodent activity reports in 2021, which translates to 4.71 complaints per 1,000 population.
Which Boston neighborhoods are run by rats this year?
The campaign initiated by the city’s Inspectional Services Department seems to be working. The number is dropping, but not everyone is as lucky. Rodent activities, in fact, got worse in some places. Let’s find out if your neighborhood is one of them!
The interactive map below indicates the concentration of rodent complaints in Boston. Neighborhoods in darker shades have a higher concentration of rodent complaints in 2021. It is highly possible that larger neighborhoods receive more complaints than smaller neighborhoods, and so we normalized the number of rodent complaints by land size. You can click on the polygons to learn more about each neighborhood.
For the second year in a row, Downtown is the #1 most rodent-infested neighborhood in Boston. Boston 311, has received 451 reports regarding rodent activity in the Downtown area, 3.9% worse than the previous year. Meanwhile, complaints doubled in Bay Village and went up 34.8% in South End.
Rats continued to roam around in these neighborhoods
- Downtown – 451 complaints in 2021, 727.4 complaints/sq mi
- Bay Village – 22 complaints in 2021, 550 complaints /sq mi
- South End – 298 complaints in 2021, 402.7 complaints /sq mi
- North End – 58 complaints in 2021, 290 complaints /sq mi
- Back Bay – 93 complaints in 2020, 150 complaints /sq mi
Rodent complaints spiked in these neighborhoods
- Bay Village – 11 complaints in 2020, 22 in 2021 (+100%)
- Mission Hill – 33 complaints in 2020, 56 in 2021 (+69.7%)
- South Boston – 149 complaints in 2020, 207 in 2021 (+38.9%)
- South End – 221 complaints in 2020, 298 in 2021 (+34.8%)
- Roxbury – 179 complaints in 2020, 228 in 2021 (+27.4%)
Rodent complaints dropped in these neighborhoods
- Allston – 286 complaints in 2020, 124 in 2021 (-56.6%)
- South Boston Waterfront – 9 complaints in 2020, 4 in 2021 (-55.6%)
- Beacon Hill – 66 complaints in 2020, 43 in 2021 (-34.8%)
- Fenway – 54 complaints in 2020, 36 in 2021 (-33.3%)
- West End – 3 complaints in 2021, 2 in 2021 (-33.3%)
These are the most rodent-infested addresses in Boston this year
- 130 Endicott St, Boston, MA 02113 – 12 rodent complaints
- 9 Andria Rd, Boston, MA 02126 – 8 rodent complaints
- 40-42 Ashford St, Boston, MA 02134 – 7 rodent complaints
- 214 Northampton St, Boston, MA 02118 – 7 rodent complaints
- 89 Waldeck St, Boston, MA 02124 – 6 rodent complaints
Chicago, the forever Rat Capital in the U.S.
In our study from last year, Chicago ranked #1 as the “rat capital” in the country. The abundance of garbage and buildings in the Windy City makes it a great location for rats to seek shelter and food for survival. As of November 10, 2021, Chicago 311 has received in total 60,054 rodent complaints this year, or 22.2 per 1,000 Chicagoans, 11.1% more than in 2020.
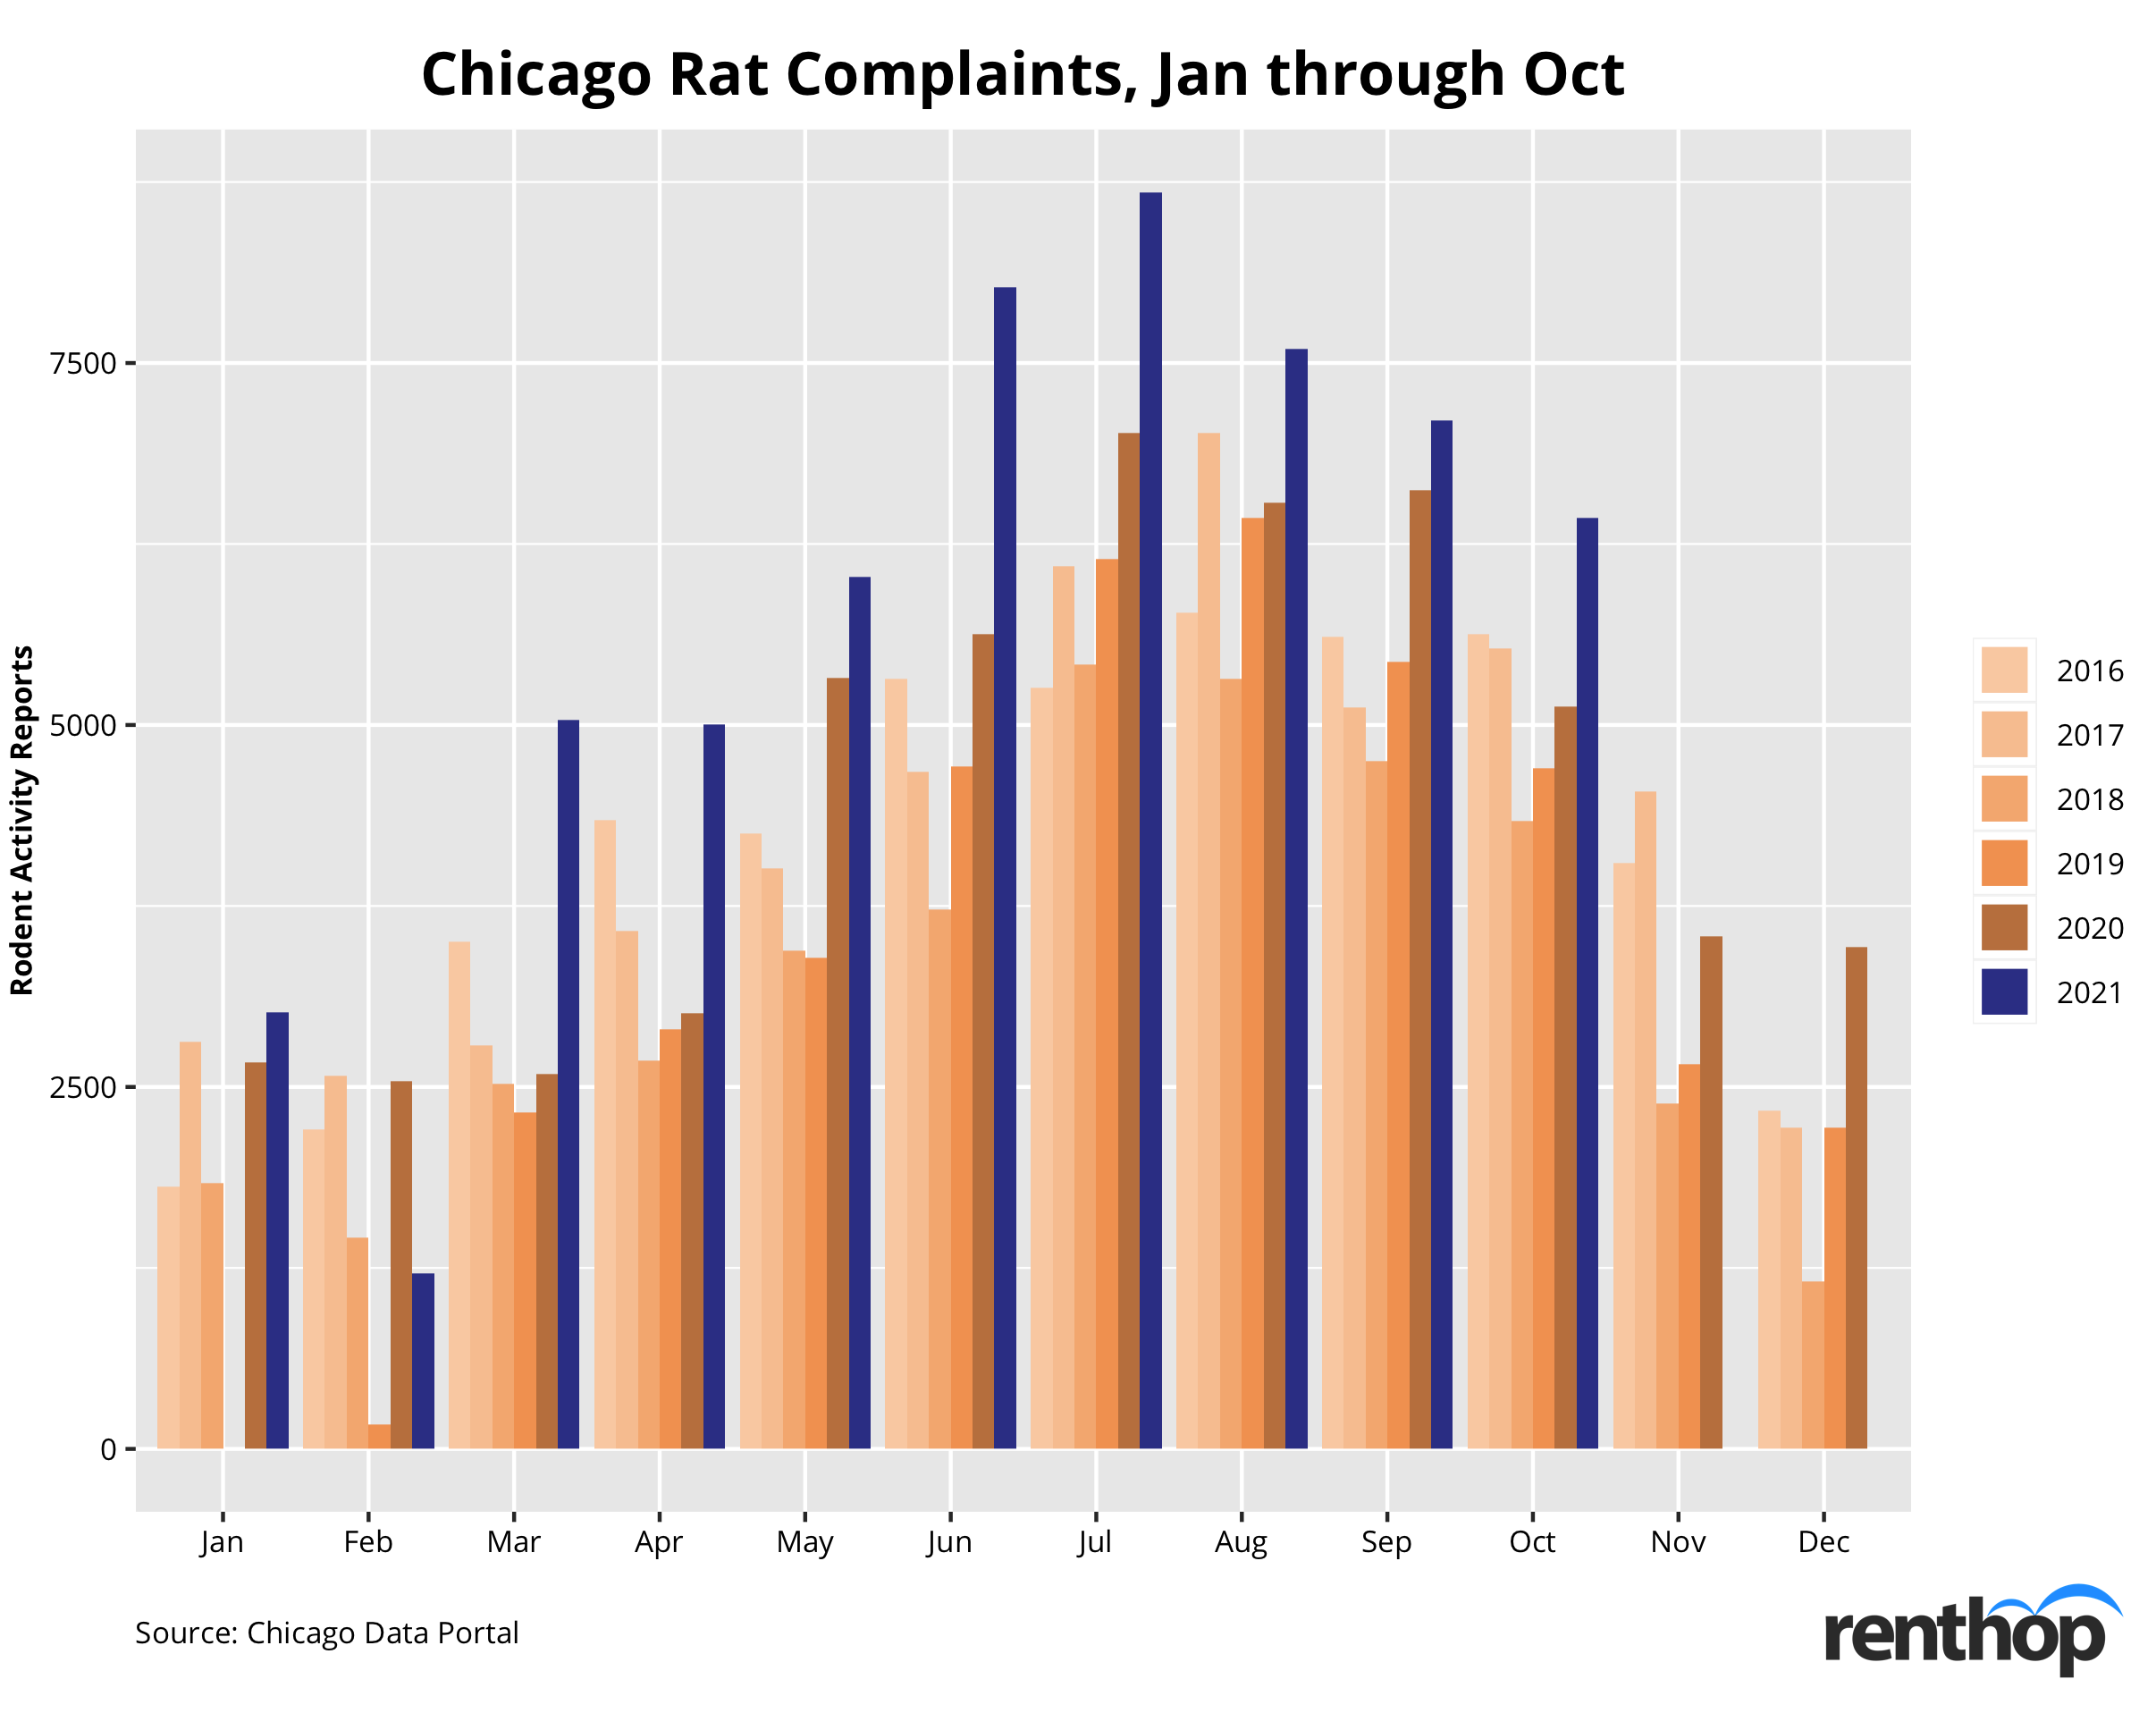
July 2021 marked the worst month since 2016, with a total of 8,679 rat sightings reported to the city’s 311 system, 23.7% higher than July 2020. The number continued trending upward throughout the fall, with 6,428 rat sighting complaints logged in October 2021 – that’s over 200 complaints per day!
Which Chicago neighborhoods are dominated by rodents?
The interactive map below indicates the concentration of rodent baiting/rat sighting complaints in Chicago. Neighborhoods in darker shades have a higher concentration of rodent complaints in 2021. It is highly possible that larger neighborhoods receive more complaints than smaller neighborhoods, and so we normalized the number of rodent complaints by land size. You can click on the polygons to learn more about each neighborhood.
When further breaking down the complaints by neighborhood, we noticed 84% of the neighborhoods in Chicago experienced an increase in the number of rat sightings reported.
Here are the neighborhoods with the most rodent complaints
- Clearing – 2,064 complaints in 2021, 808.8 complaints/sq mi
- West Town – 3,312 complaints in 2021, 723.8 complaints/sq mi
- Bridgeport – 1,510 complaints in 2021, 722.2 complaints/sq mi
- Lake View – 2,182 complaints in 2021, 697.5 complaints/sq mi
- Logan Square –2,199 complaints in 2021, 612.7 complaints/sq mi
Rats are seen more often in these neighborhoods
- O’Hare – 7 complaints in 2020, 26 in 2021 (+271%)
- Edison Park – 46 complaints in 2020, 107 in 2021 (+132.6%)
- West Elsdon – 234 complaints in 2020, 514 in 2021 (+119.7%)
- Kenwood – 147 complaints in 2020, 316 in 2021 (+115.0%)
- Oakland – 20 complaints in 2020, 42 in 2021 (+110%)
Rat sightings are less frequent in these neighborhoods
- Douglas – 71 complaints in 2020, 31 in 2021 (-56.3%)
- Riverdale – 12 complaints in 2020, 7 in 2021 (-41.7%)
- Hegewisch – 43 complaints in 2020, 31 in 2021 (-27.9%)
- Morgan Park – 396 complaints in 2020, 291 in 2021 (-26.5%)
- Armour Square – 361 complaints in 2020, 291 in 2021 (-19.4%)
These are the addresses reported the most this year in Chicago
- 5933 W 64th St, Chicago, IL 60638 – 47 rodent complaints
- 4167 W Addison St, Chicago, IL 60641 – 35 rodent complaints
- 310 W 116th St, Chicago, IL 60628 – 34 rodent complaints
- 5706 S Bishop St, Chicago, IL 60636 – 34 rodent complaints
- 6343 S Seeley Ave, Chicago, IL 60636 – 34 rodent complaints
In New York, rodent complaints jumped 29% this year
In New York, the number of rodent complaints decreased slightly in 2020, mostly due to reduced activities and an overwhelmed 311 system. This year, though, things are quite different. Inspectors who typically hunt for evidence of rats were assigned elsewhere to fight the pandemic, and the rodent population thrived. As of November 10, 2021, New York 311 has received over 25,000 reports of rat sightings across the five boroughs, 28.7% more than last year.
Manhattan tops all other boroughs with 4.3 rodent complaints per 1,000 population
Since New York City is the only city with boroughs, we started our analysis by breaking down the number of rat/rodent sighting complaints by borough. Figure 4 below indicates how the numbers have changed by year and by borough since 2016. 2020 marked the year with the fewest complaints in all five boroughs. The number, however, jumped in 2021.
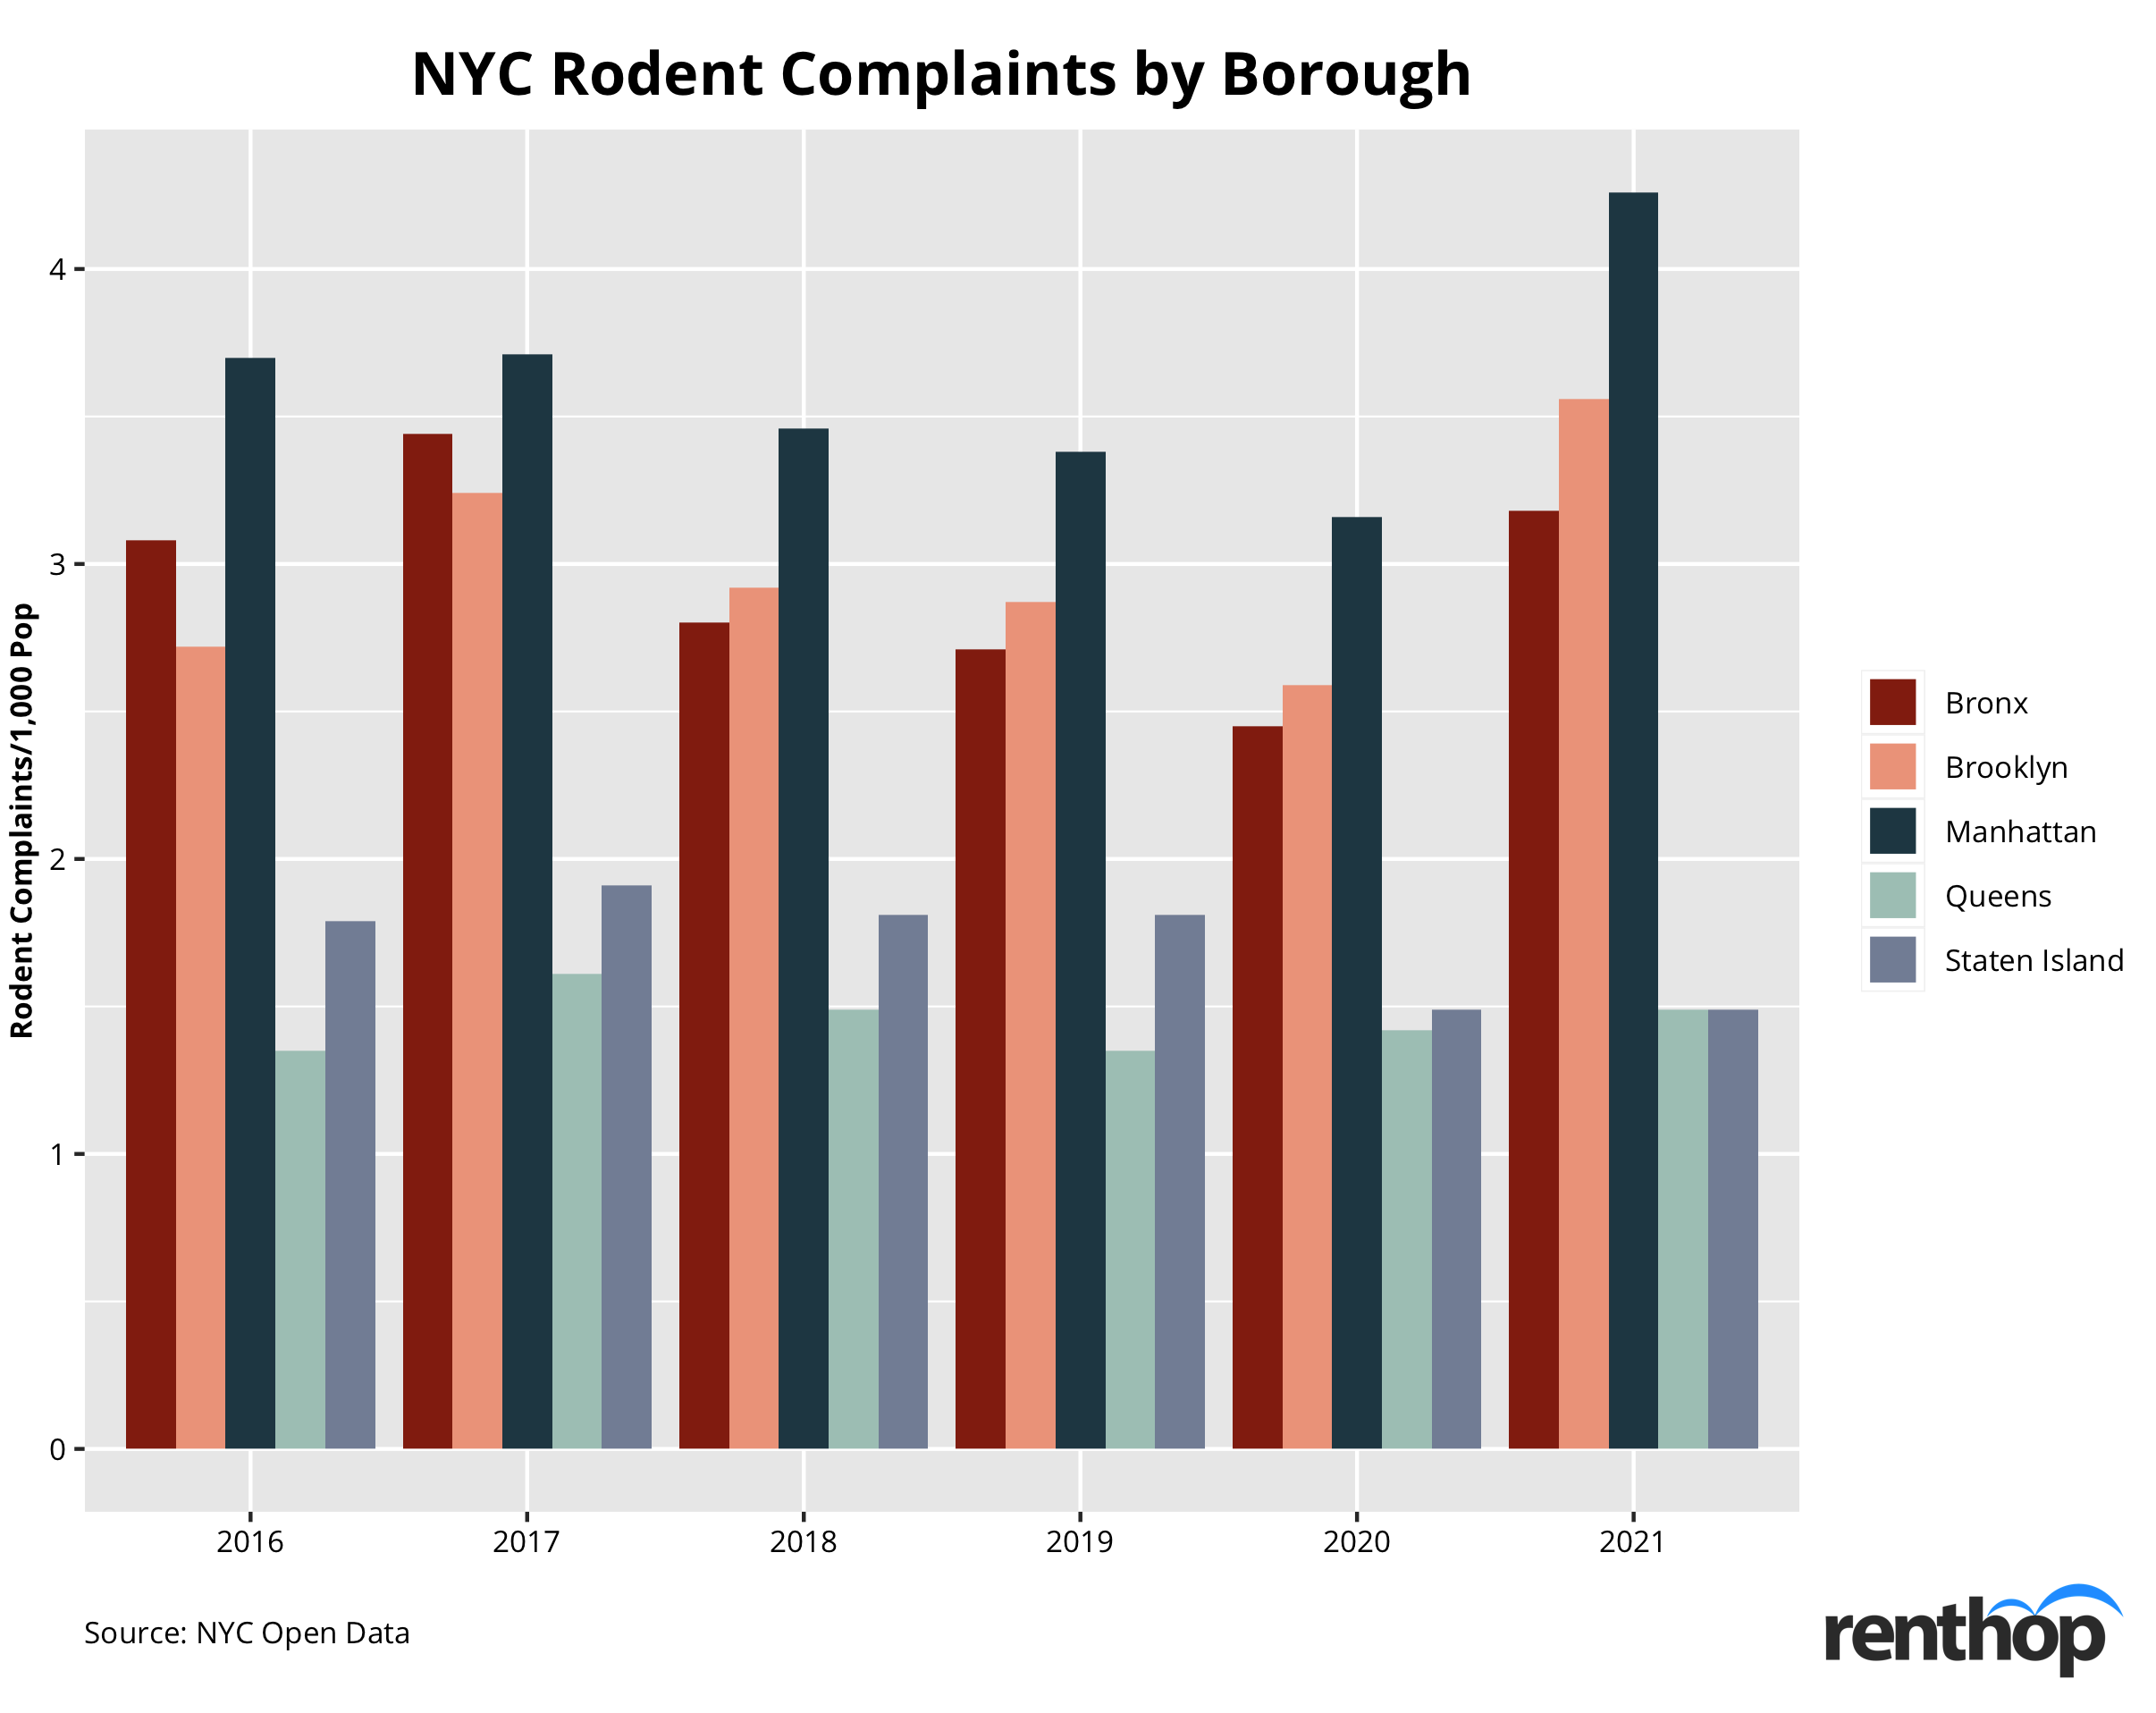
In the Bronx, the complaints reached 4,682, 29.5% more than 2020. That translates to 3.18 complaints/1,000 population. In Queens, the number of complaints reached 3,596, this year, and Staten Island is the only borough where the number of rodent complaints shows a downward trend.
Manhattan remained the most rodent-infested borough in New York City. So far, the borough has received 7,217 complaints, 34.7% higher than the same period last year. This equates to 4.26 rodent sightings per 1,000 population.
In Brooklyn, things got a lot worse this year — it had the largest year-over-year increase across the five NYC boroughs. As of November, Brooklyners reported over 9,749 rodent sightings – that’s 3.56 per 1,000 population, 37.8% higher than 2020, and 10.1% higher than 2017, the second-highest year since 2016.
Record-breaking October: the month with the most rat sightings
Figure 5 below breaks down rodent complaints by month and year. As we can see clearly, so far this year the rodent infestation is the worst since 2016.
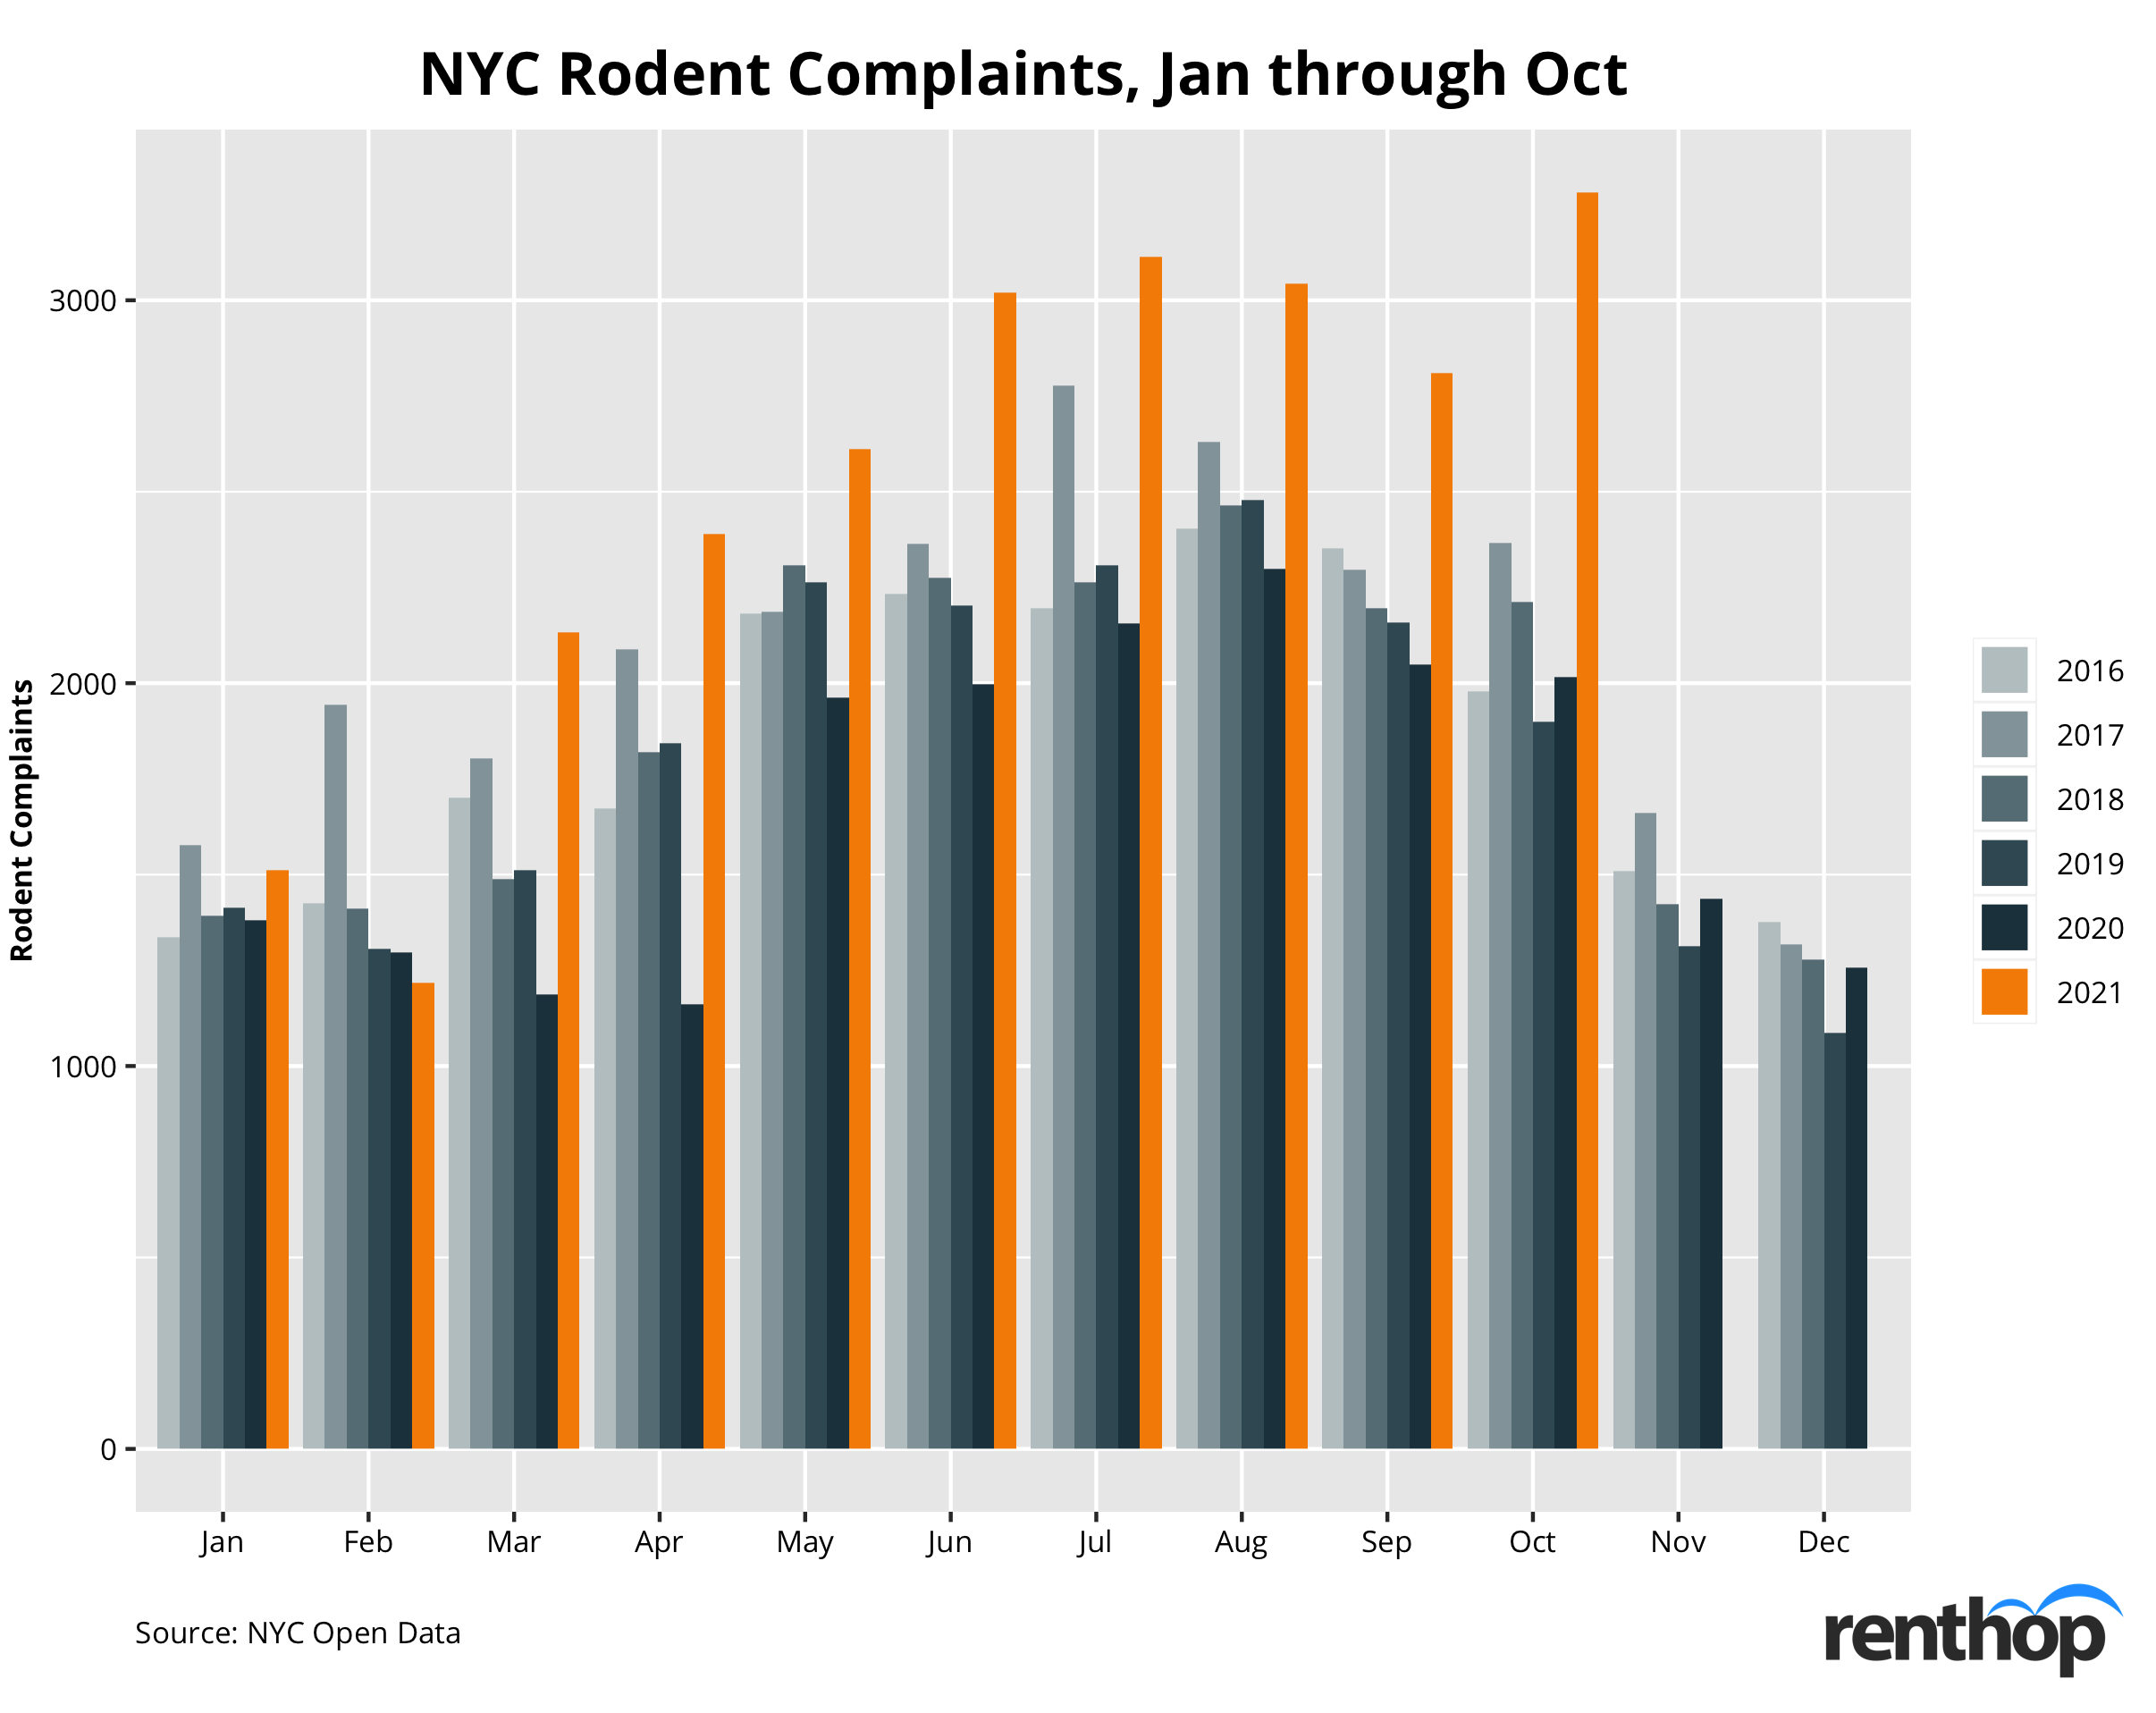
Historically, rat sightings had been reported more often during the summer months. This year, however, things are quite different. October 2021 marked the worst month in the past six years. In total, NYC 311 received 3,282 rat/rodent sighting complaints in October, 62.7% more than a year ago.
Is your neighborhood rodent-infested?
Around 60% of the neighborhoods in New York City saw a jump in the number of rat sightings this year. The interactive map below indicates the concentration of 311 rat/rodent sighting complaints in New York. Neighborhoods in darker shades have a higher concentration of complaints in 2021. It is highly possible that larger neighborhoods receive more complaints than smaller neighborhoods, and so we normalized the number of rodent complaints by land size. You can click on the polygons to learn more about each neighborhood.
These Neighborhoods are Rodent-Infested
- Harlem (South), Manhattan – 357 rat complaints in 2020, 822 in 2021, 1,586.8 complaints/sq mi
- Upper West Side-Manhattan Valley, Manhattan – 351 rat complaints in 2020, 440 in 2020, 929.2 complaints/sq mi
- Prospect Heights, Brooklyn – 208 rat complaints in 2020, 304 in 2021, 821.7 complaints/sq mi
- Upper East Side-Yorkville, Manhattan – 242 rat complaints in 2020, 361 in 2021, 740.1 complaints/sq mi
- East Village, Manhattan – 194 rat complaints in 2020, 416 in 2018, 611.4 complaints/sq mi
Rodent sightings spiked in these neighborhoods
- Sheepshead Bay-Manhattan Beach-Gerritsen Beach, Brooklyn – 37 complaints in 2020, 171 in 2021 (+362%)
- Prospect Park, Brooklyn – 5 complaints in 2020, 23 in 2021 (+360%)
- Kingsbridge-Marble Hill, Bronx – 19 complaints in 2020, 73 in 2021 (+284.2%)
- Flatbush (West)-Ditmas Park-Parkville, Brooklyn – 74 complaints in 2020, 217 in 2021 (+193.2%)
- Park Slope, Brooklyn – 154 complaints in 2020, 415 in 2021 (+169.5%)
- East Elmhurst, Queens – 22 complaints in 2020, 55 in 2021 (+150%)
- Upper East Side-Lenox Hill-Roosevelt Island, Manhattan – 32 complaints in 2020, 78 in 2021 (+147.6%)
- Brooklyn Heights, Brooklyn – 103 complaints in 2020, 255 in 2021 (+143.8%)
- Crown Heights, Brooklyn – 122 complaints in 2020, 286 in 2021 (+134.4%)
Rodent complaints dropped the most in these neighborhoods
- Breezy Point-Belle Harbor-Rockaway Park-Broad Channel, Queens – 50 complaints in 2020, 18 in 2021 (-64%)
- Kew Gardens Hills, Queens – 36 complaints in 2020, 17 in 2021 (-52.8%)
- Borough Park, Brooklyn – 76 complaints in 2020, 38 in 2021 (-50%)
- Westchester Square, Bronx – 22 complaints in 2020, 13 in 2021 (-40.9%)
- Gravesend (West), Brooklyn – 100 complaints in 2020, 63 in 2021 (-37%)
These are the addresses with the most complaints filed in New York City this year
- 1912 Avenue H, Brooklyn, NY 11230 – 91 rodent complaints
- 1000 Fifth Avenue, New York, NY 10028 – 84 rodent complaints
- 557 Montgomery St, Brooklyn, NY 11225 – 68 rodent complaints
- 241 West 116 Street, New York, NY 10016 – 68 rodent complaints
- 2131 Wallace Avenue, Bronx, NY 10462 – 57 rodent complaints
Worst year for D.C. — rodent complaints rose 26% in 2021
Washington D.C. is known for many things. It is the capital of the United States of America; it is a cultural center with many monuments and museums, such as the Smithsonian Institution; and it is a walkable and bike-friendly city with many bike lanes in the downtown area. What you probably don’t know about D.C. is that not only do our president and government officials reside there, many, many rats also call it home.
021 is on track to be the worst year since 2016 for D.C. As of November 10, the city’s 311 system has received over 11,000 rodent complaints, 26% more than 2020. Figure 6 below further breaks down the complaints by month and year.
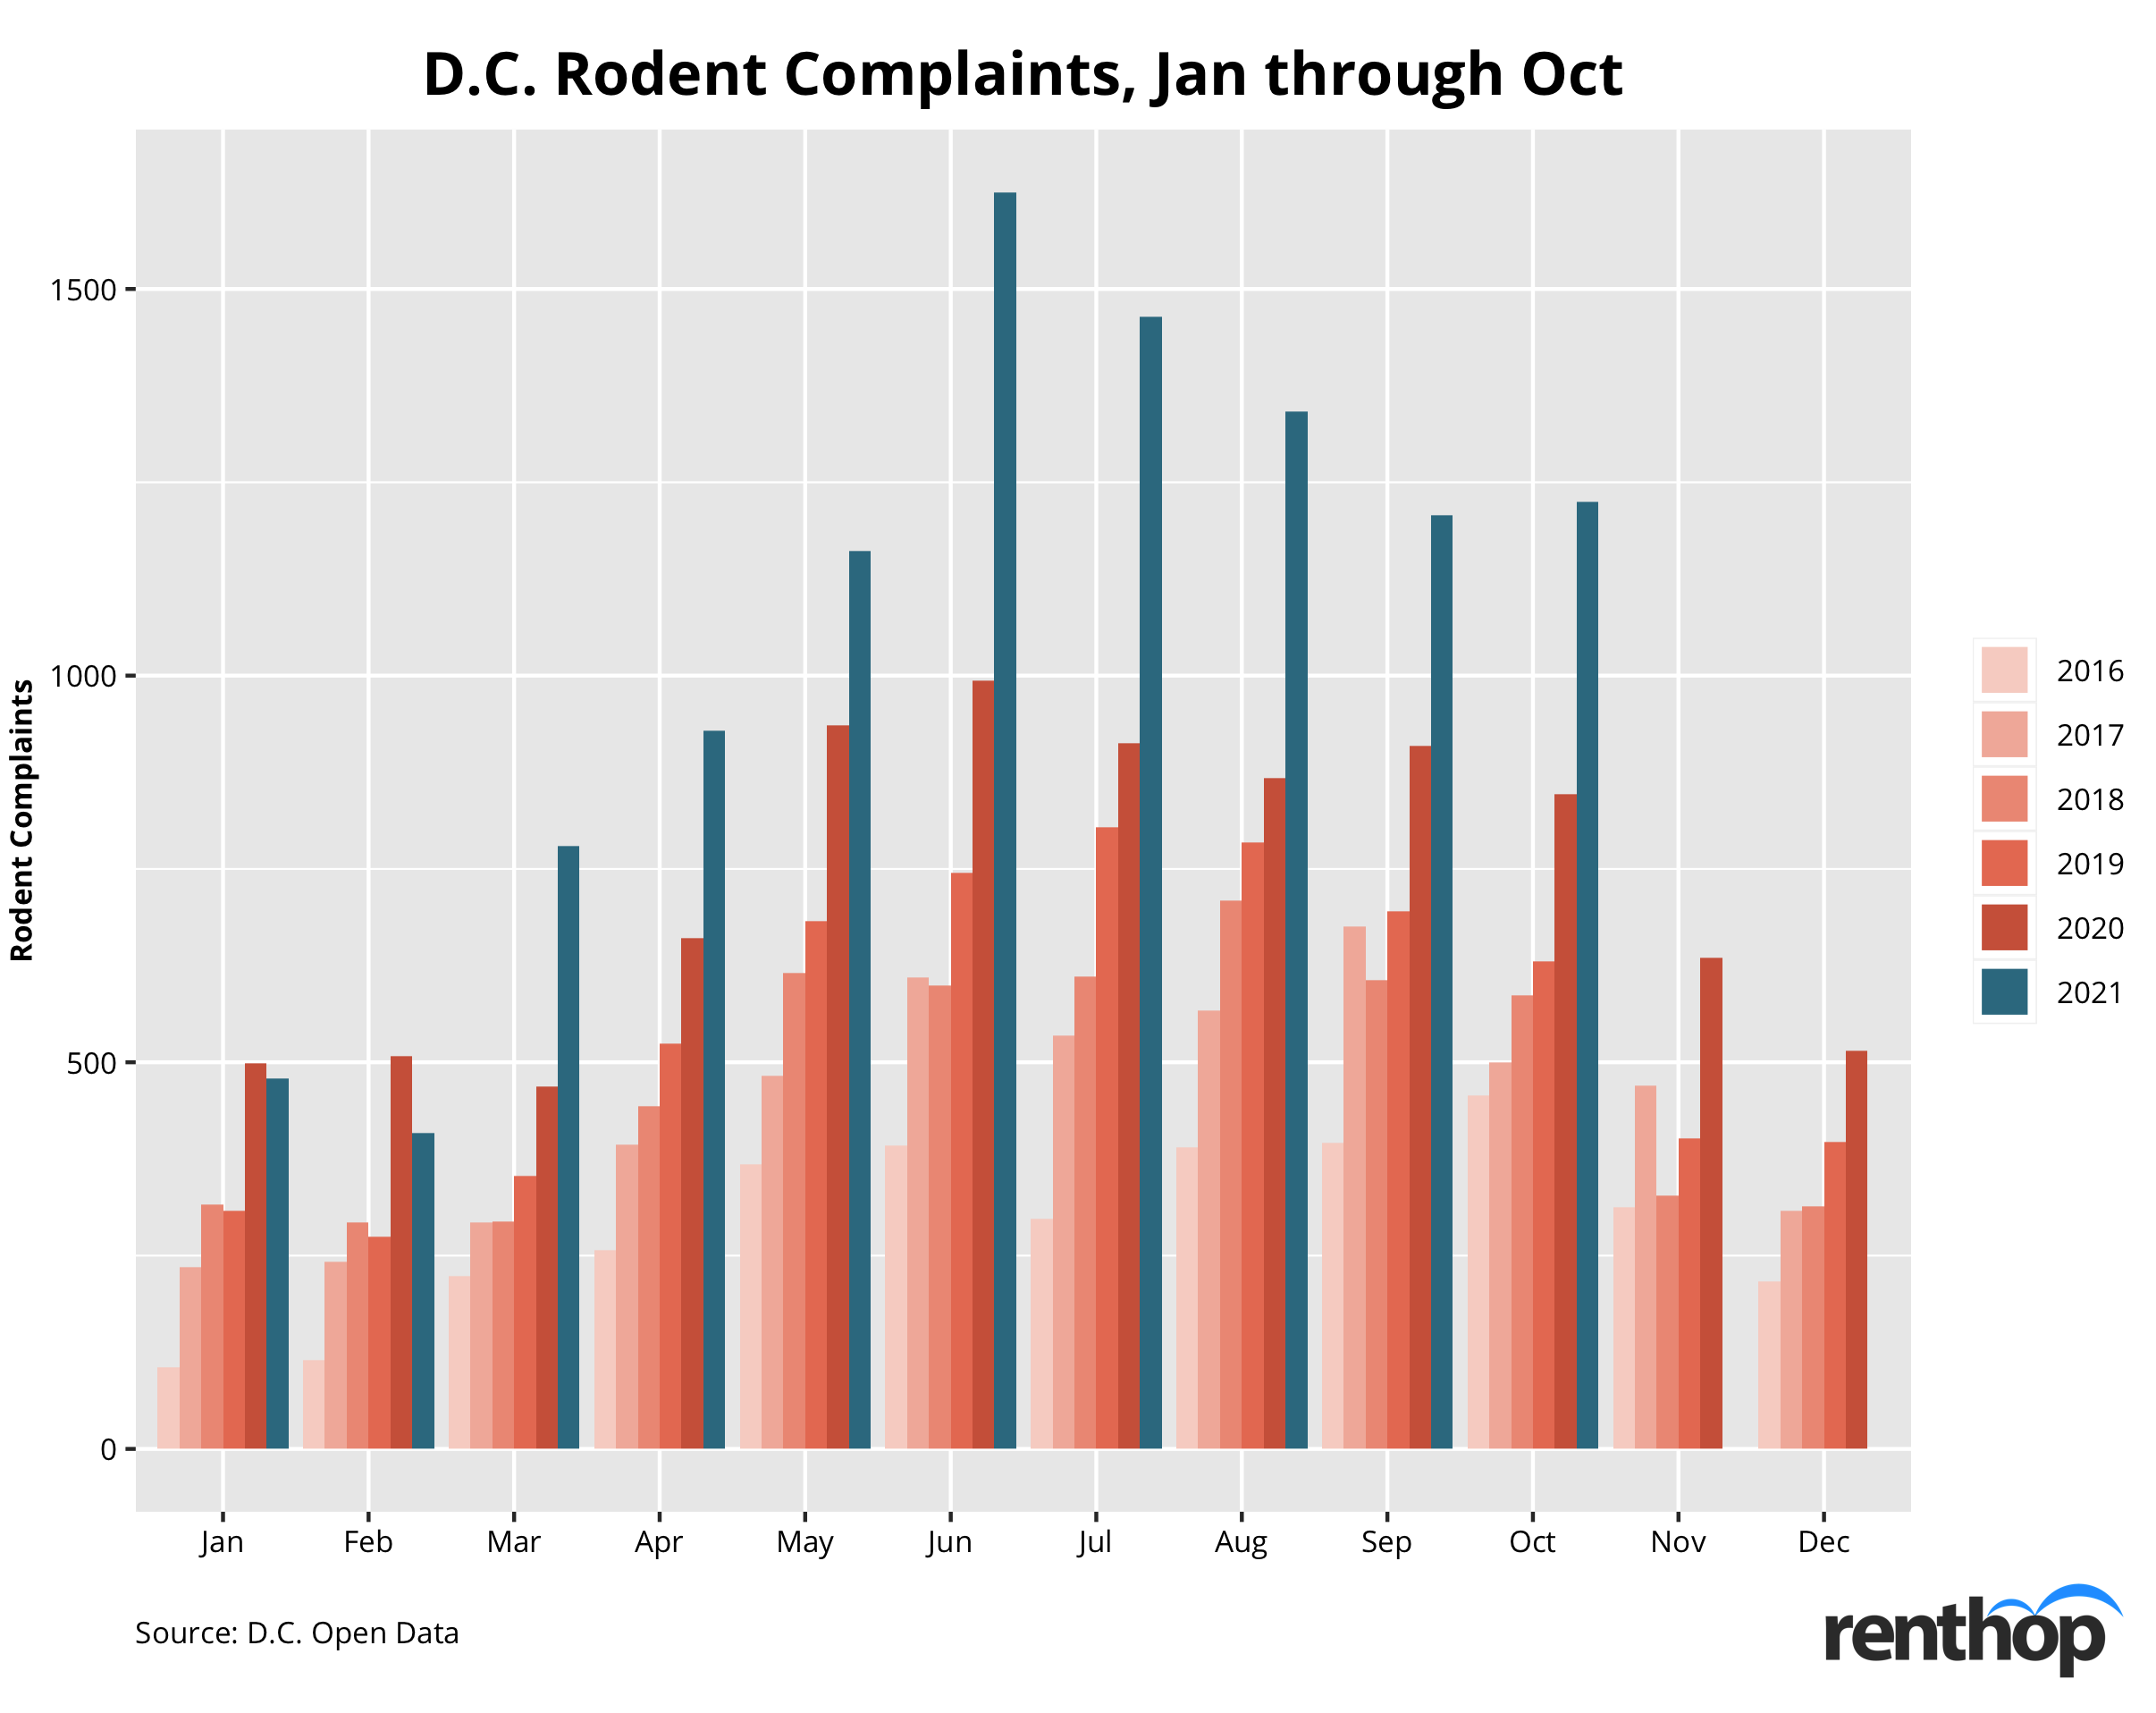
Historically, complaints tend to jump up during summer months, which is not surprising. But the rodent population in D.C. seemed to have exploded exponentially this year. June 2021 marked the worst month since 2016, with in total 1,625 complaints filed, 63.6% more than June 2020.
Is your neighborhood dominated by rats?
The interactive map below indicates the concentration of rodent complaints in Washington D.C. Neighborhoods in darker shades have a higher concentration of rodent complaints in 2021. It is highly possible that larger neighborhoods receive more complaints than smaller neighborhoods, and so we normalized the number of rodent complaints by land size. You can click on the polygons to learn more about each neighborhood.
The neighborhood cluster “Columbia Heights, Mt. Pleasant, Pleasant Plains, Park View” again won the title of the most rodent-infested area this year. The number of complaints jumped 52.9% this year, with over 1,400 rodent complaints received.
These neighborhoods saw the most rodents this year
- Columbia Heights, Mt. Pleasant, Pleasant Plains, Park View – 1,445 complaints in 2021, 1,100.6 complaints/sq mi
- Shaw, Logan Circle – 402 complaints in 2021, 711.2 complaints/sq mi
- Howard University, Le Droit Park, Cardozo/Shaw – 448 complaints in 2020, 623.7 complaints/sq mi
- Union Station, Stanton Park, Kingman Park – 983 complaints in 2020, 613.4 complaints/sq mi
- Brightwood Park, Crestwood, Petworth – 1,504 complaints in 2020, 599.5 complaints/sq mi
Rodent complaints surged in these neighborhoods
- Mayfair, Hillbrook, Mahaning Heights – 31 complaints in 2020, 62 in 2021 (+100%)
- Twining, Fairlawn, Randle Highlands, Penn Branch, Fort Davis Park, Fort Dupont – 169 complaints in 2020, 327 in 2020 (+93.5%)
- Douglas, Shipley Terrace – 18 complaints in 2020, 34 in 2021 (+88.9%)
- Brookland, Brentwood, Langdon – 174 complaints in 2020, 324 in 2021 (+86.2%)
- Georgetown, Burleith/Hillandale – 179 complaints in 2020, 329 in 2021 (+83.8%)
Rodent complaints dropped in these neighborhoods
- Woodland/Fort Stanton, Garfield Heights, Knox Hill – 12 complaints in 2020, 1 in 2021 (-91.7%)
- Fairfax Village, Naylor Gardens, Hillcrest, Summit Park – 12 complaints in 2020, 6 in 2021 (-50%)
- Cleveland Park, Woodley Park, Massachusetts Avenue Heights, Woodland-Normanstone Terrace – 67 complaints in 2020, 47 in 2021 (-29.9%)
- Friendship Heights, American University Park, Tenleytown – 49 complaints in 2020, 35 in 2021 (-28.6%)
- Hawthorne, Barnaby Woods, Chevy Chase – 47 complaints in 2020, 36 in 2021 (-23.4%)
These are the addresses with the most complaints filed in D.C. this year
- 1350 Pennsylvania Avenue NW, Washington D.C. 20004 – 38 rodent complaints
- 3829 Kansas Avenue NW, Washington D.C. 20011 – 21 rodent complaints
- 1229 Rock Creek Ford Road NW, Washington D.C. 20011 – 17 complaints
- 722 Oneida Place NW, Washington D.C. 20011 – 15 complaints
- 714 Rock Creek Church Road NW, Washington D.C. 20010 – 15 complaints
Methodology
This study examines the rodent crisis in major U.S. cities, using 311 data from Boston, Chicago, New York City, and Washington D.C., and the population data was collected via U.S. Census Bureau. For this study, we limited the research time frame to January 2016 through November 10, 2021. We then geocoded the complaints using each city’s neighborhood shapefile and normalized the complaint count by land size. This allows us to fairly rank each neighborhood and provide better insights.
RentHop is all about data and facts. Our data science team does annual studies on rental data as well as 311 complaints across major U.S. cities. To get to know the city you live in, take a look at our previous studies on rodent complaints, human/animal waste complaints, noise complaints, and more.


