Finding the right apartment is never easy, especially in the City of New York.
To find the right apartment, we need to first identify the right neighborhood. But how do we do that? Well, this is where data science comes in handy. Instead of blindly recommending neighborhoods based on how “hip” they are, the Data Science team at RentHop crunched the numbers and ranked the NYC neighborhoods by livability. We understand that each person values different things. For some, finding an apartment in a quiet neighborhood is of the highest priority, while for others the number of subway stops in the area is just as important. We believe, by analyzing the pros and cons of each neighborhood, we can help renters make an informed decision.
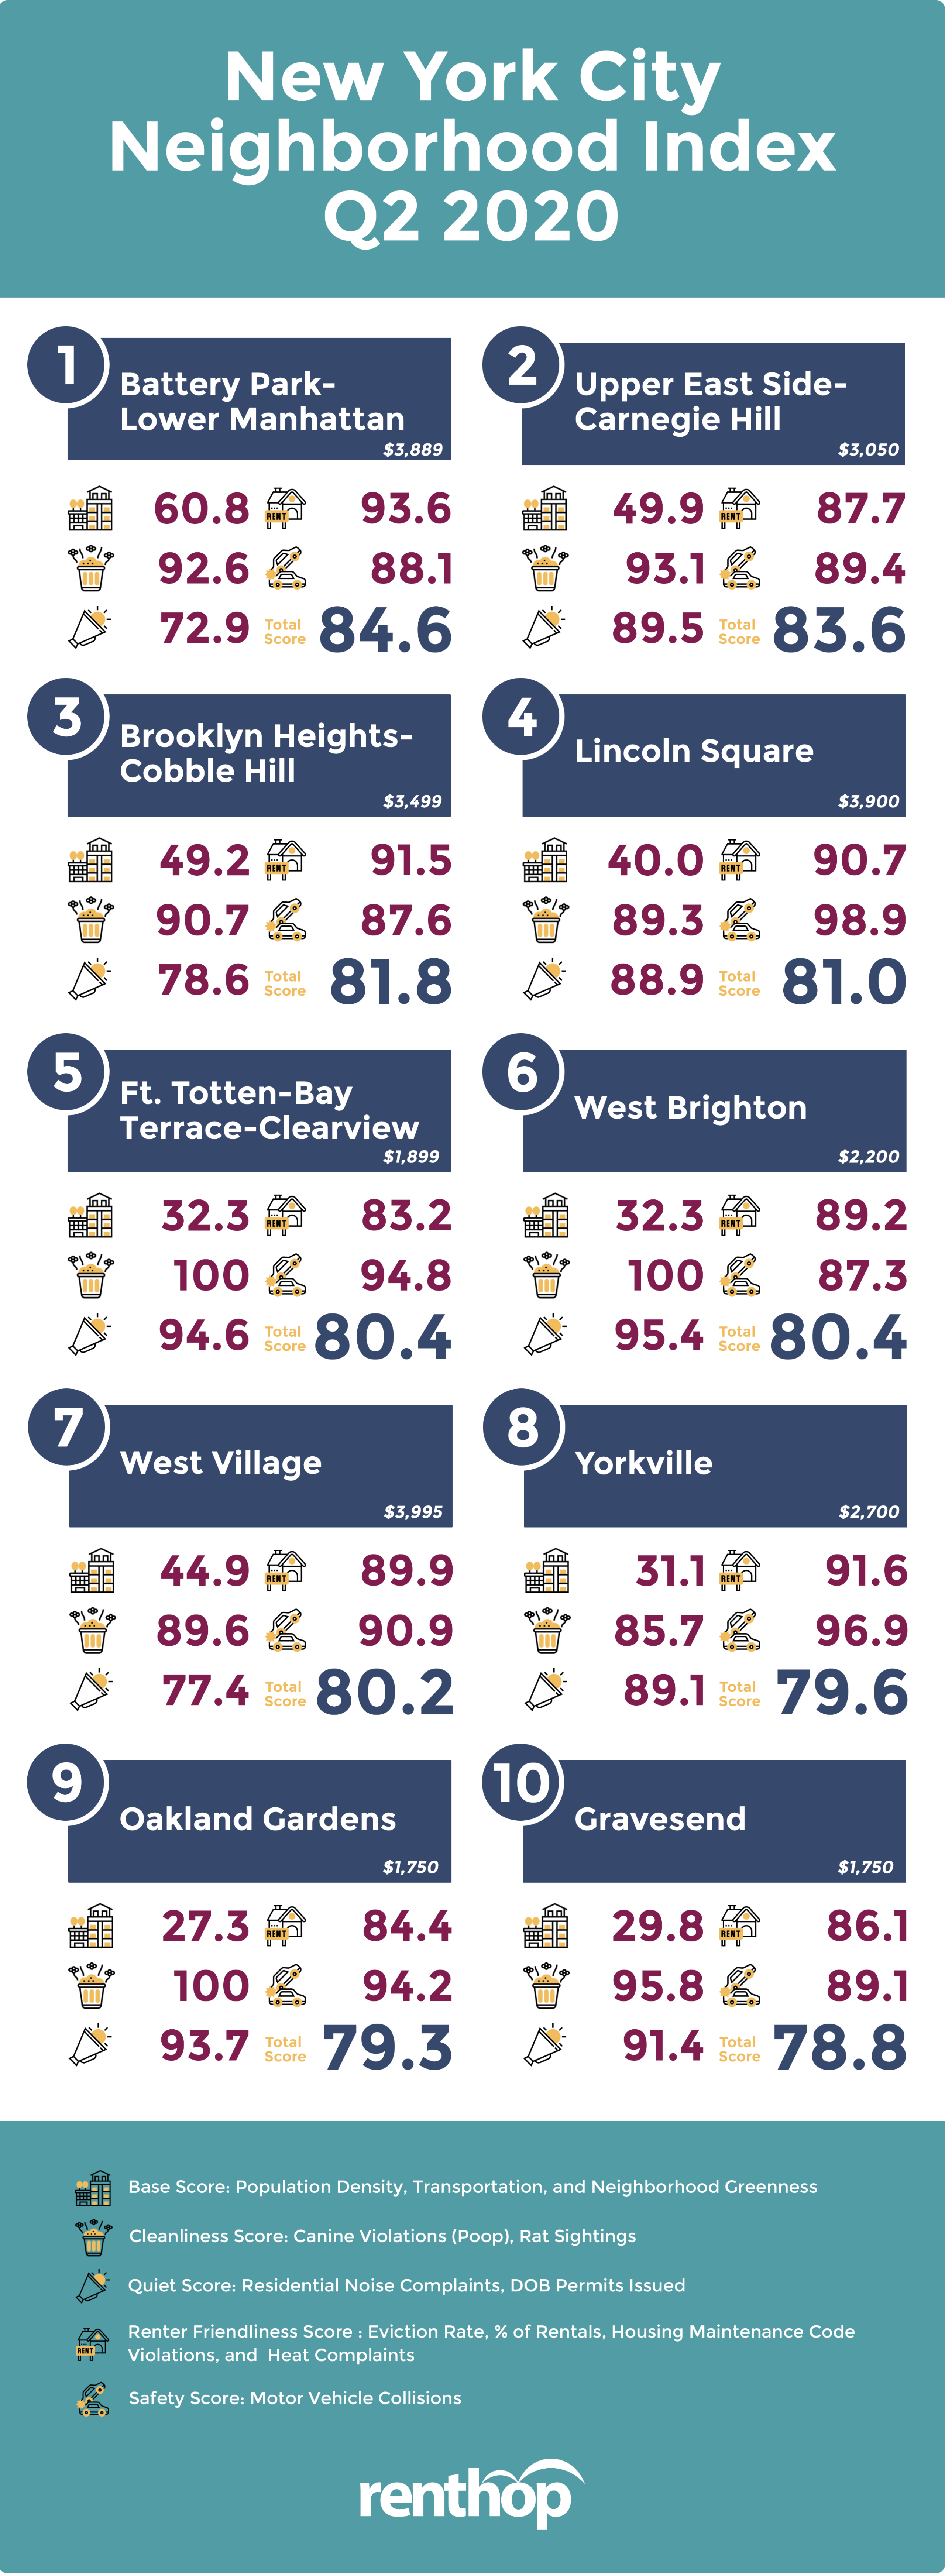
Our findings this quarter include:
- Battery Park City-Lower Manhattan ranks the best neighborhood among 150+ NYC neighborhoods for the second straight quarter. The NTA, which includes FiDi and Battery Park City, has 14 subway stops, or 20.5 per sq mi, with a renter-friendliness score of 93.6. However, its quiet score went down 21%, from 91.2 to 72.9 this quarter, possibly related to COVID and the State’s stay-home order. [Neighborhood Livability Infographic]
- Upper East Side-Carnegie Hill replaced Brooklyn Heights-Cobble Hill as the second most livable neighborhood in NYC with a high cleanliness score of 93.1, which means that the residents experience fewer poop complaints and rodent sightings. With median 1BR rent at $3,050, it is more affordable than Lower Manhattan. [Neighborhood Livability Map]
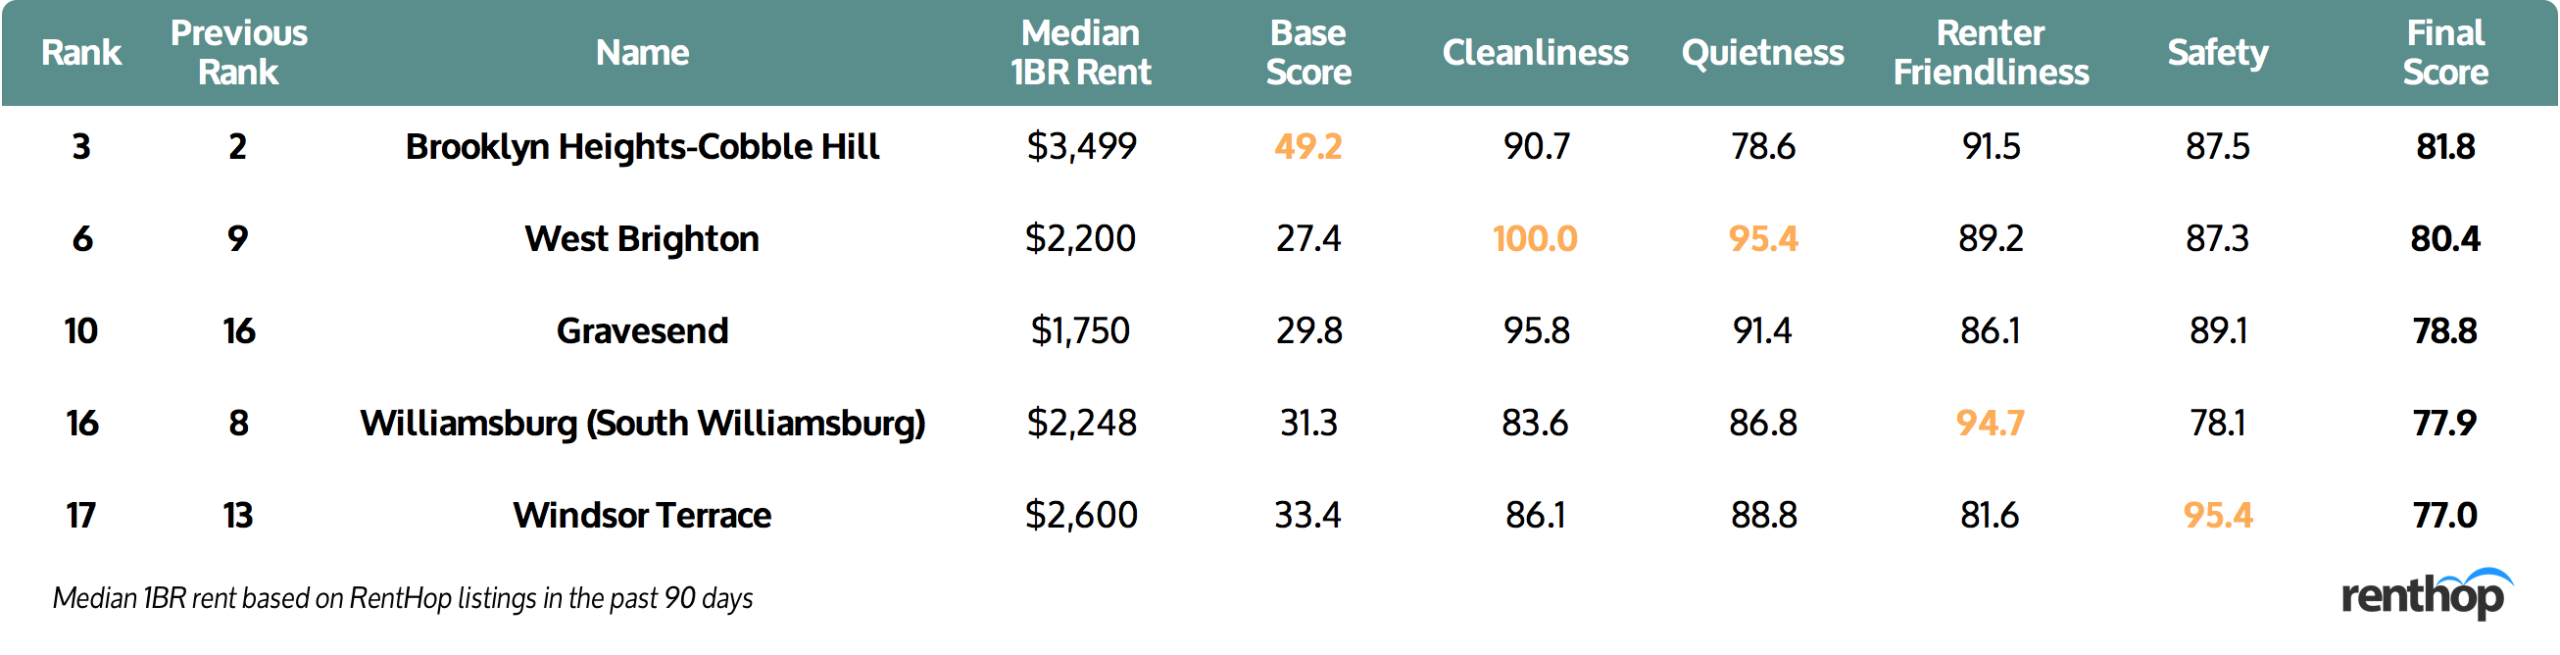
- Brooklyn Heights-Cobble Hill continues to be the most livable neighborhood in the Brooklyn Borough. However, its overall ranking dropped from #2 to #3 this quarter due to lower cleanliness and noise scores. The noise score dropped 11.3 points to 78.6 this quarter. [Top 5 Neighborhoods in Brooklyn]
- Erasmus remains one of the least livable neighborhoods in New York City. The neighborhood suffered in categories including quiet score and renter friendliness in the past three months. From January 14h to April 13th, Erasmus received in total 492 noise complaints (or 481.3/10k households) and 418 heat complaints (or 521.0/10k renter-occupied units).
- Many neighborhoods experienced a significant drop in their quiet score due to noise complaints, including Manhattanville (-36.4 points), Washington Heights North (-34.8 points), and Prospect Lefferts Gardens-Wingate (-25.1 points), which could be related to people staying at home and practicing self-isolation.
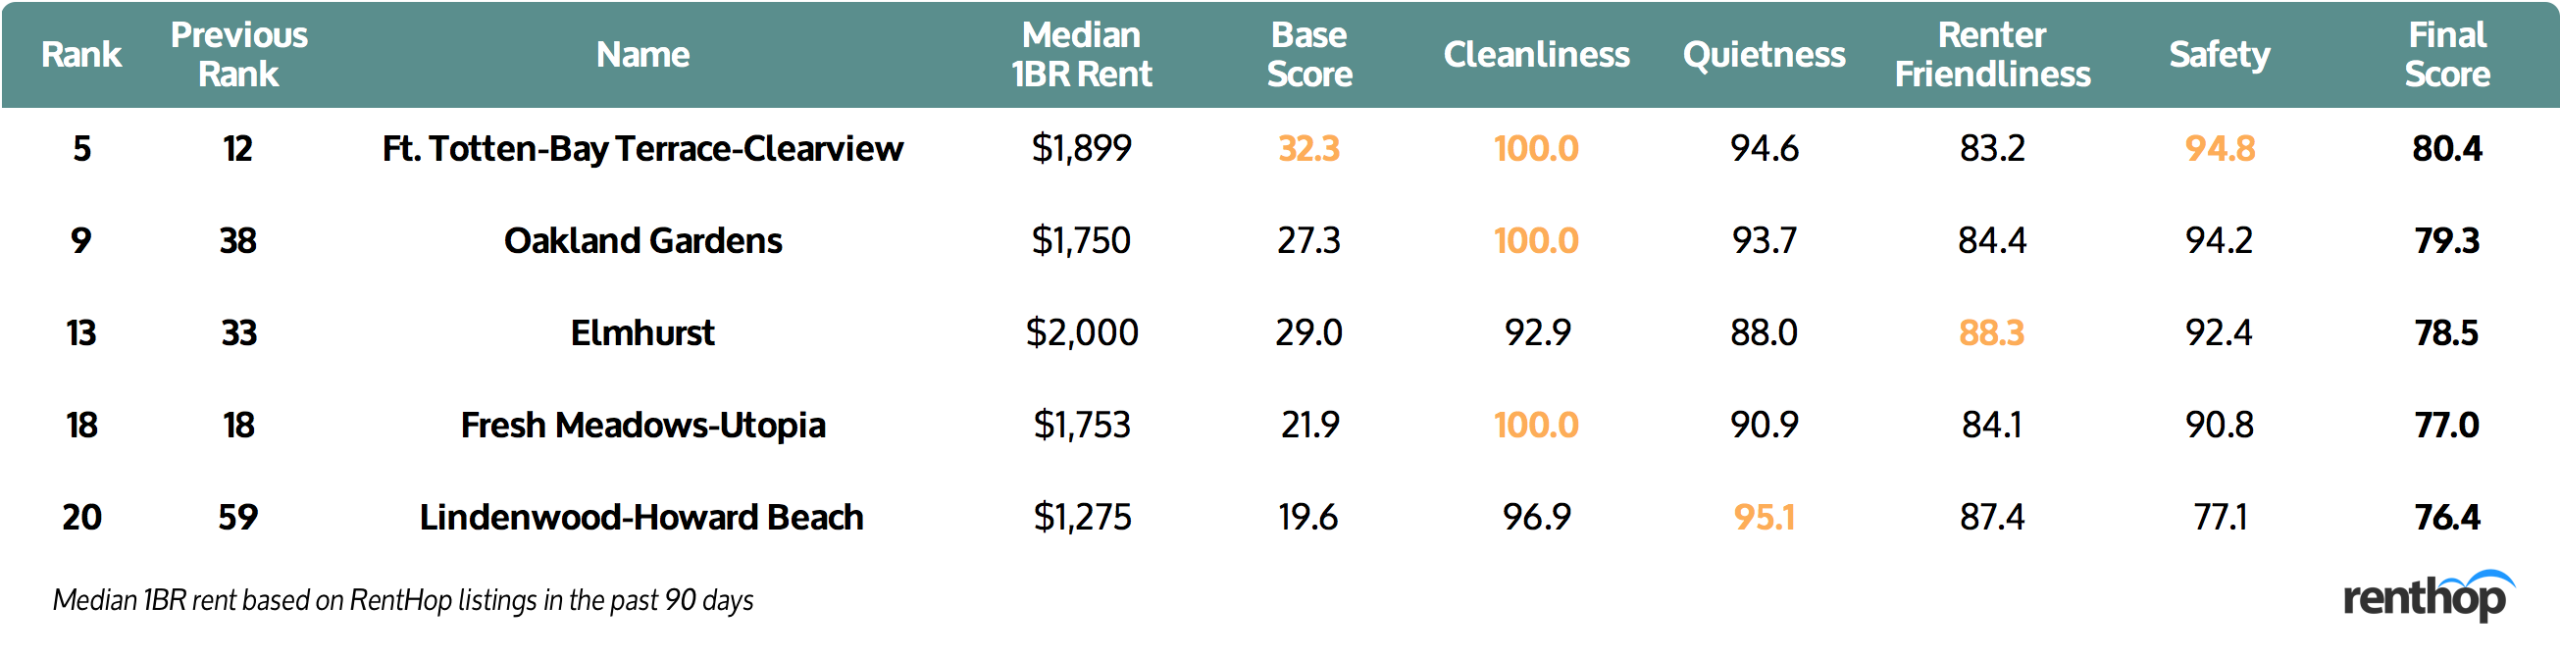
- As the most livable neighborhood in Queens, Ft. Totten-Bay Terrace-Clearview improved its overall ranking from #12 to #5 in our Q2 index, thanks to its perfect cleanliness score and outstanding quiet score (94.6). Meanwhile, Oakland Gardens improved its ranking from #38 to #9 with a 10-point increase in the cleanliness score. [Top 5 Neighborhoods in Queens]
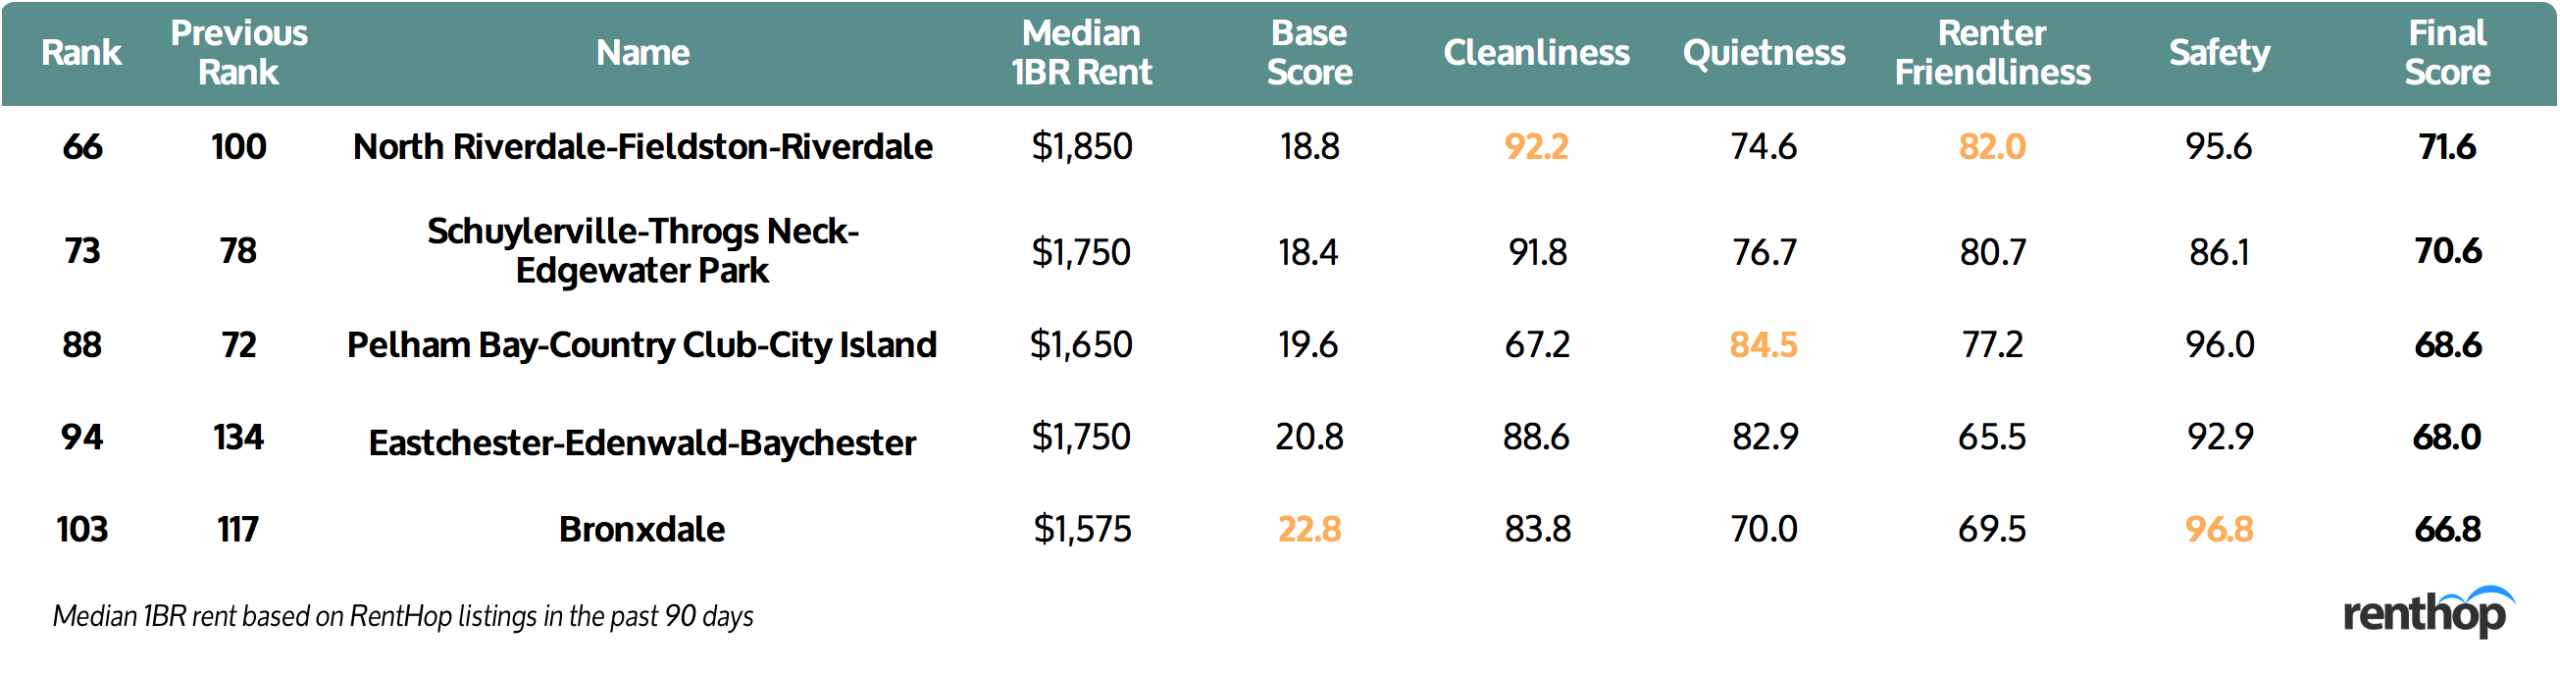
- The average score among neighborhoods in the Bronx is 60.3, 1.4 points lower than the previous quarter. This is mainly due to the growing noise complaints. [Top 5 Neighborhoods in the Bronx]
NYC Neighborhood Livability Map
The map below illustrates the livability of each NYC neighborhood. The darker the shade, the higher the score. You can click on the neighborhoods to learn more about the score breakdown as well as the median 1BR rent.
Thanks to Gov. Cuomo’s mandate, evictions were down in most NYC neighborhoods, including Crown Heights North (-26) in Brooklyn, Crotona Park East (-20) in the Bronx, and Central Harlem South (-18) in Manhattan. However, most neighborhoods saw an increase in the number of noise complaints in the past 90 days due to the COVID pandemic and the New York State “stay-home” order. In fact, over 85% of the neighborhoods in our index experienced a surge in noise complaints, which resulted in city-wide changes in the quiet score category.
Generally speaking, Manhattan neighborhoods enjoy higher base scores thanks to the comprehensive MTA subway lines. Compared to the other three boroughs, Manhattan neighborhoods also have relatively higher renter-friendliness scores (average 83.2). The average quiet score in Manhattan is down from 75.1 to 63.0 this quarter, which translates to a 16.1% dip. Specifically, Central Harlem North-Polo Grounds and Washington Heights South had seen over 2000 noise complaints respectively in the past 90 days.
In Queens, the average cleanliness score went down 6.7 points, from 91.6 to 84.9, only 0.1 higher than Manhattan. Brooklyn neighborhoods scored an average of 83.7 in terms of safety, 1.1 points lower than the previous quarter. But the borough is a lot noisier these days – Prospect Lefferts Gardens-Wingate and Bushwick South saw 903 and 821 more complaints respectively in the past 90 days. The neighborhoods in the Bronx improved slightly in the renter friendliness category thanks to the warmer weather and fewer heat complaints. The borough also saw some positive changes in terms of cleanliness. The score went up 19.2 points (27%) in Spuyten Duyvil-Kingsbridge and 10.9 points (14%) in Pelham Parkway.
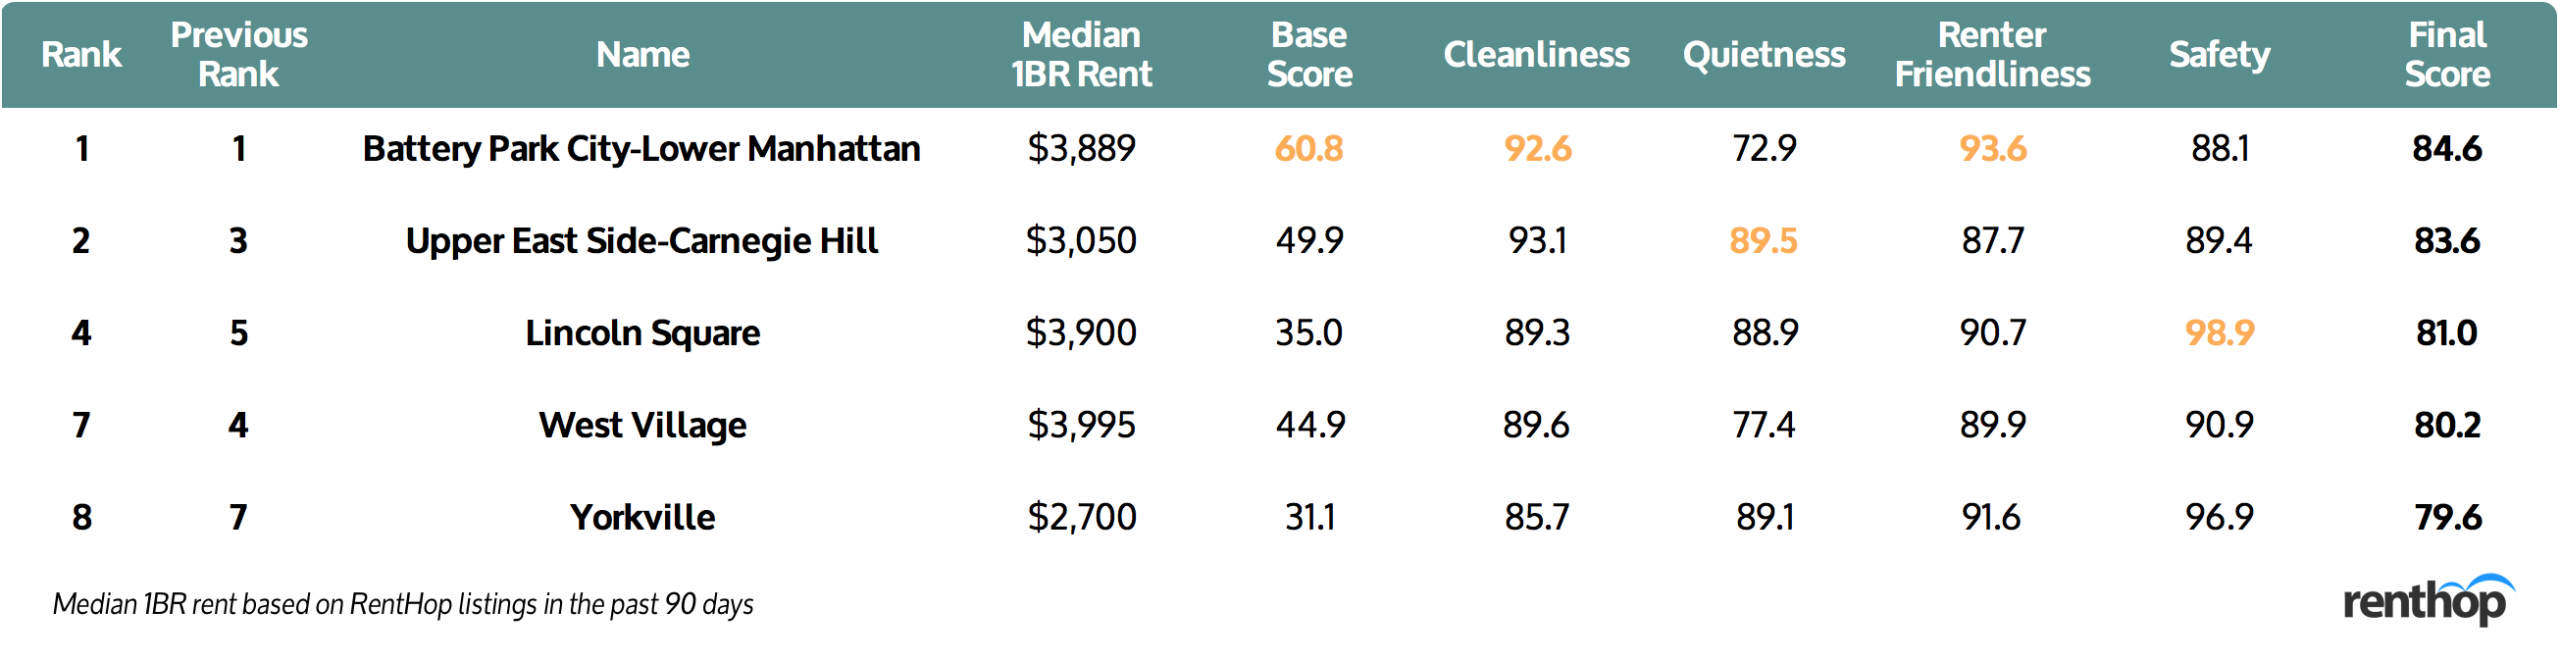
Here are the Top 10 Neighborhoods in New York City


How We Did It
To determine the most renter-friendly and best neighborhoods in New York City, we compared over 190 Neighborhood Tabulation Areas (NTAs) across six key categories, including (1) Neighborhood Greenness, (2) Transportation, (3) Quality of Life, (4) Renter Friendliness, and (5) Safety, using in total 13 relevant metrics.
The following metrics were used for this neighborhood livability index:
Base Score [25 points]
- Population Density — NTA Population / Land Size (sq mi) [2.5 points]
- Transportation — MTA Subway Stops / Land Size (sq mi) [10 points]
- Neighborhood Greenness: Tree Data — Street Tree Count / Land Size (sq mi) [6.25 points]
- Neighborhood Greenness: Park Coverage — Park Area / Land Size (sq mi) [6.25 points]
Cleanliness [15 points]
- Poop Complaints — 311 Canine Violations / 10k Households [7.5 points]
- Rodent — 311 Rat Sightings / 10k Households [7.5 points]
Quietness [20 points]
- Noise Complaints — 311 Residential Noise Complaints / 10k Households [16 points]
- Potential Construction Noise — DOB Permits Issued / Total Housing Units [2 points]
Renter Friendliness [30 points]
- Landlord Level of Responsibility: Heat Season — 311 Heat Complaints / Renter-Occupied Units [9 points]
- Landlord Level of Responsibility: HMV — Housing Maintenance Code Violations / Renter-Occupied Units [3 points]
- Percentage of Renter-Occupied Units — Renter-Occupied Units / Total Occupied Units [3 points]
- Evictions — Evictions / Renter-Occupied Units [15 points]
Safety [10 points]
- Motor Vehicle Collisions — Collisions / 10k Population [10 points]
We also adjusted the curve based on rental unit availability since that it’d be easier for renters to find an apartment in a given neighborhood if it has more available units on market. The rental rates were calculated using RentHop listings from January 14, 2020, to April 13, 2020.
We will be releasing the RentHop Neighborhood Livability Index on a quarterly basis, and we’d love to hear from you! Think we missed something? Any specific 311 complaints or dataset you’d like us to include? Or, would you like to work on an urban planning project using our underlying dataset? Email us at press@renthop.com.
You can also check out our previous quarterly report here.


