President Donald Trump’s recent tweets put a spotlight on Baltimore. While the President probably doesn’t mean that Baltimore is, literally, rat and rodent-infested, we at RentHop thought it’d be perfect to revisit the rodent crisis and include the Mobtown in our annual rat study, and see if Baltimore really is rodent-infested. We also thought it’d be good to take a look at Washington D.C., where the President resides. In our previous studies, we discovered that the number of rodent complaints in both Chicago and New York had reached an all-time high in 2017. While we are so thankful that rats in real life don’t mysteriously explode like they do in Stranger Things, rodents, after all, are a public health problem, and more and more resources are invested into rodent inspection and prevention. So, what has changed in the past year? What more have we discovered?
Some of our most interesting findings this year include:
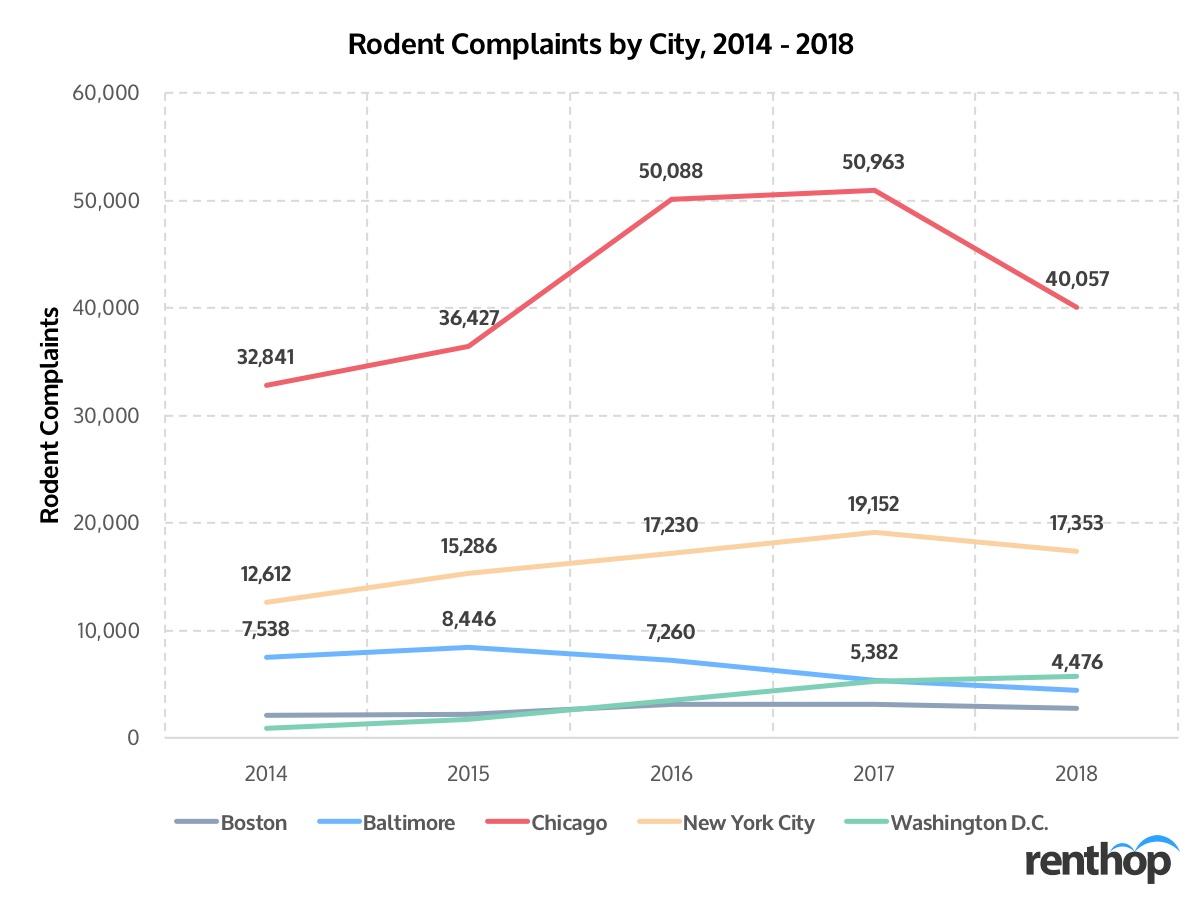
- Washington D.C., in fact, is more rodent-infested than Baltimore. In 2018, the Capital’s 311 received 5,715 complaints or 83.6 per SqMi, clearly more than Baltimore, which had 4,476 rat complaints or 48.5 per SqMi.
- Chicago maintained the title of “rat capital”, with in total 40,057 rodent complaints filed in 2018. Rodent complaints spiked 13% in Little Village, from 1,094 unique rodent complaints in 2017 to 1,239 in 2018.
- When analyzing the number of rodent complaints with 1BR median rent as an independent variable, we found a positive correlation between the number of average yearly complaints per SqMi and 1BR median rent in Boston. In other words, the higher the rent, the more rodent complaints one neighborhood received.
- In Baltimore, on the contrary, the number of rodent complaints is negatively correlated to 1BR median rent. Neighborhoods with lower median rent tend to receive more complaints.
- In New York, Brooklyn remains to be the borough of rats. However, when looking at complaints per SqMi, Manhattan outpaced all other four boroughs, with shockingly 188.2 rat sightings per SqMi.
- We also found that seasonality highly affects the number of rodent complaints a city receives. All five cities in our study saw more rodent complaints in summer than in winter. The number tends to reach its peak in July or August and drop to its lowest from December to February.
Select one of the cities below to learn more:
Baltimore | Boston | Chicago | New York | Washington D.C.
Baltimore
Rats in Baltimore all of a sudden became the media star this past couple of weeks, thanks to President Trump’s tweets. To a certain degree, the President isn’t wrong – Baltimore has long been fighting the battle against brown rats. It was so bad that the city had to set up the Rat Rubout program to proactively inspect and treat conditions attracting rats. The Rat Rubout crew is now fully staffed and their preventive approach seems to be showing promising results. The number of rodent complaints to Baltimore 311 has been going down since 2015. In 2018, the city received in total 4,495 rodent complaints, 47% fewer than in 2015. As of July 31st, the city has received only 2,240 complaints this year, 21% less compared to the same period in 2018. But, we all know that rats migrate. In the city, rats move from one street to the next, from one neighborhood to another, to search for better locations for their nest. Just when you think that things are improving as you stop seeing brown rats running across the street outside your door, you hear your friend who lives in a different neighborhood complains about how rats have taken over her roof. So where are the rats?
Is Your Neighborhood Rodent-Infested?
The interactive map below indicates the concentration of rodent complaints in Baltimore. Neighborhoods in darker shades have a higher concentration of rat sightings. It is very possible that larger neighborhoods receive more complaints than smaller neighborhoods, and so we normalized the number of rodent complaints by land size. You can click on the polygons to learn more about each neighborhood.
These Neighborhoods are Rodent-Infested
- Bayview – 47 rat complaints in 2017, 56 in 2018, 1,100.4 average yearly complaints per SqMi
- Easterwood – 54 rat complaints in 2017, 41 in 2018, 1,020.1 average yearly complaints per SqMi
- Panway/Braddish Avenue – 130 rat complaints in 2017, 73 in 2018, 971.0 average yearly complaints per SqMi
- Lower Edmondson Village – 15 rat complaints in 2017, 9 in 2018, 956.3 average yearly complaints per SqMi
- Richnor Springs – 12 rat complaints in 2017, 13 in 2018, 640.7 average yearly complaints per SqMi
Rodent complaints spiked in these neighborhoods
- Pleasant View Gardens – 1 rat complaint in 2017, 7 in 2018 (+600%)
- Glen Oaks – 2 rat complaints in 2017, 9 in 2018 (+350%)
- Medford – 4 rat complaints in 2017, 17 in 2018 (+325%)
- Butcher’s Hill – 3 rat complaints in 2017, 11 in 2018 (+267%)
- Kernewood – 6 rat complaints in 2017, 12 in 2018 (+100%)
Rodent complaints dropped in these neighborhoods
- Tremont – 26 rat complaints in 2017, 3 in 2018 (-89%)
- Wilhelm Park – 7 rat complaints in 2017, 1 in 2018 (-86%)
- Rosemont East – 34 rat complaints in 2017, 5 in 2018 (-85%)
- New Northwood – 26 rat complaints in 2017, 4 in 2018 (-85%)
- Ramblewood – 69 rat complaints in 2017, 11 in 2018 (-84%)
Rats vs. Rent
When looking at 1BR median rent and the number of rodent complaints by neighborhood, we noticed an interesting trend. There seems to be a negative correlation between rent and rodent complaints in Baltimore(R-square = 0.11, p <0.05). In other words, the lower the rent, the more rodent complaints a neighborhood received. The figure below further illustrates our findings. Could it be that the infrastructure in neighborhoods with lower median rent tends to be older and therefore result in a higher rat population? One cannot tell from the data.
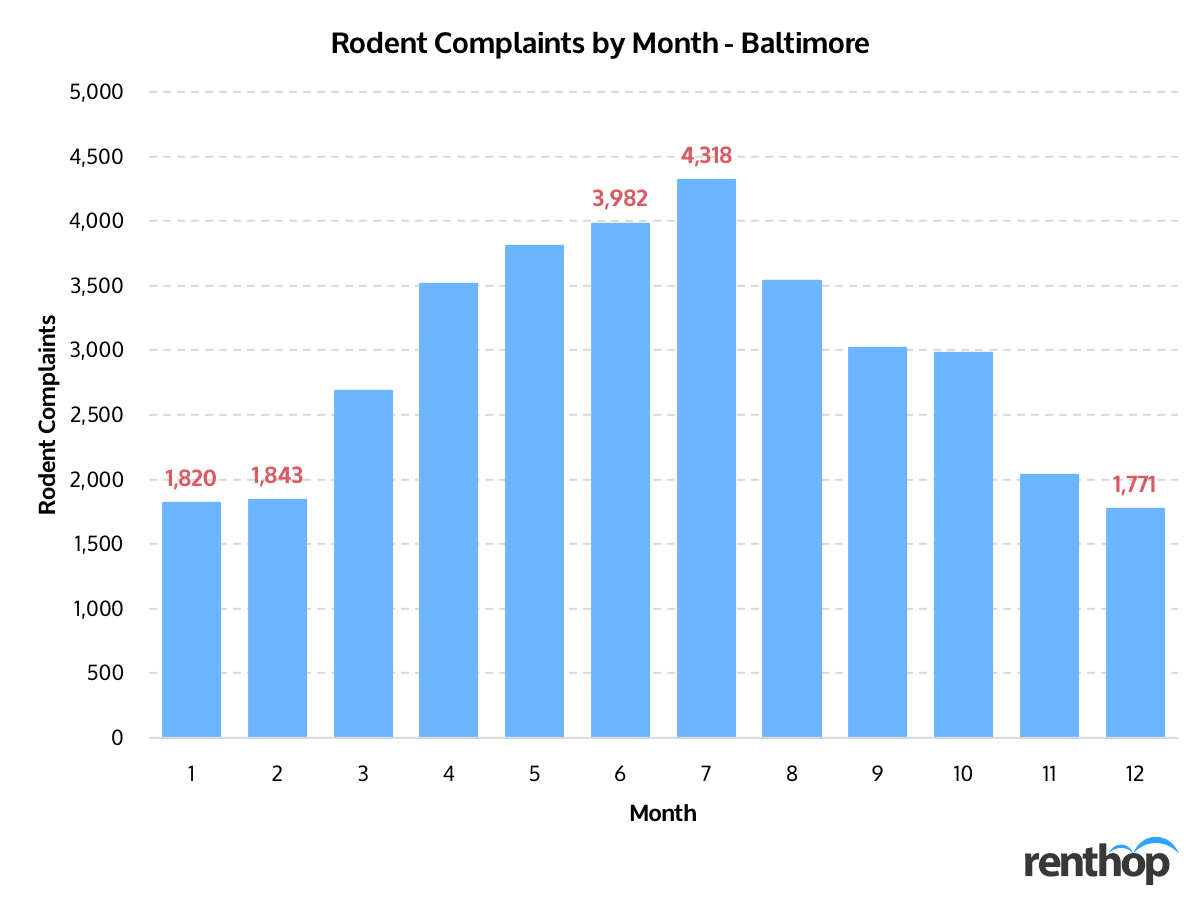
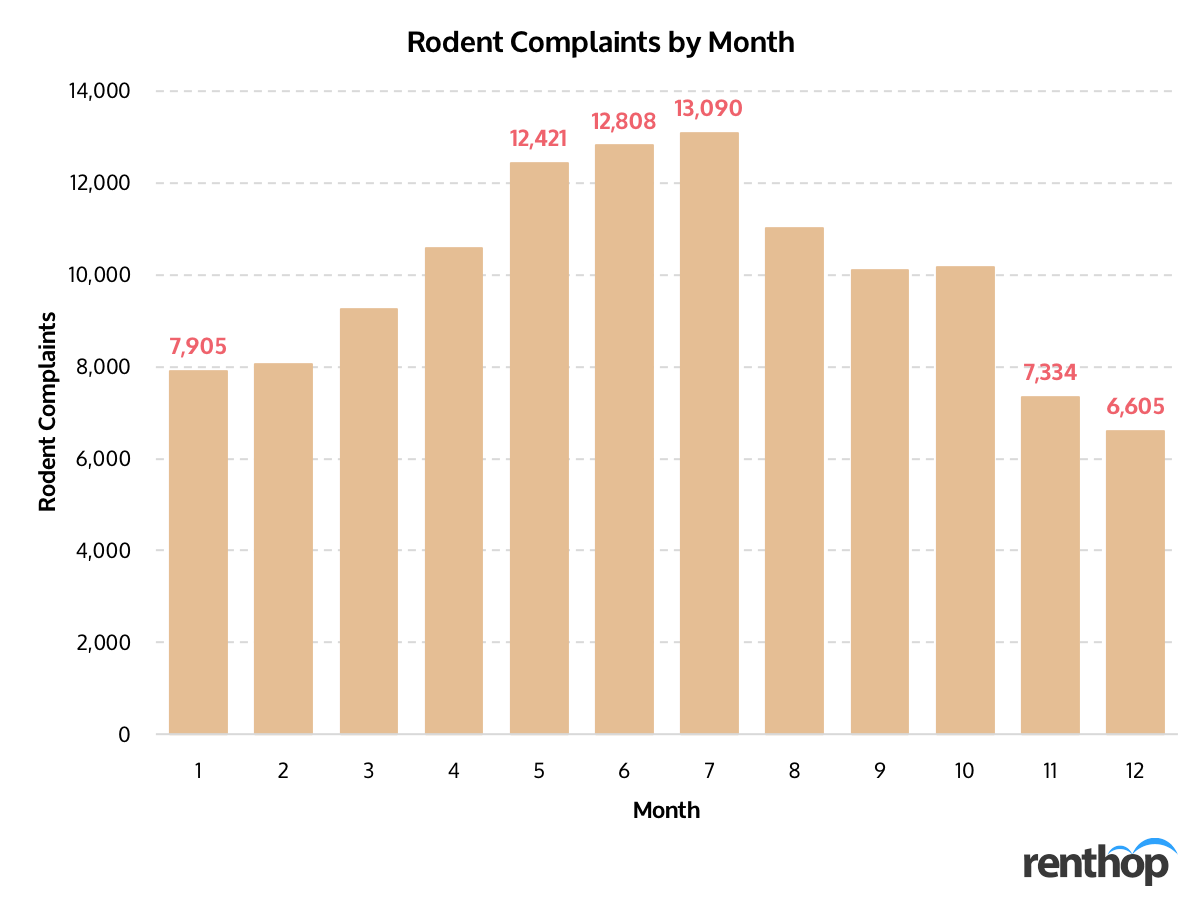
When to Watch Out for Rodents
Since predicting where you’ll find rats wasn’t enough, we dug even deeper. Did you know that July has been historically the top month for rodent complaints? Moreover, we noticed that the rat complaints started soaring from March onwards till July, before dipping towards the end of the year in December, most probably due to seasonal changes such as milder winters and warmer summers which may have affected the rat activity level in the city.
Boston
Since we are talking about rats, we thought we’d include Boston in our study this year, as it is one of the oldest cities in the U.S. Boston was founded in 1630 by the Puritans and played an important role in the U.S. history. As we all know, old infrastructure often makes perfect habitats for rats. Rodents thrive in outdated subway systems, sewers, parks, and in foundations of old homes and buildings, and pose a great threat to humans. As we looked into the Boston 311 service requests, we found that Boston, compared to the other four cities included in this annual study, has had the least number of rodents complaints. The city, from 2014 to 2018, had received in total 13,308 complaints. In 2018, Boston 311 saw 2,732 rodent complaints or 30.5 complaints per Sq Mi, 80% fewer than what Chicago 311 received.
Is Your Neighborhood Rodent-Infested?
The interactive map below indicates the concentration of rodent complaints in Boston. Neighborhoods in darker shades have a higher concentration of rodent complaints. It is very possible that larger neighborhoods receive more complaints than smaller neighborhoods, and so we normalized the number of rodent complaints by land size. You can click on the polygons to learn more about each neighborhood.
These Neighborhoods are Rodent-Infested
- North End – 108 rat complaints in 2017, 126 in 2018, 465 average yearly complaints per SqMi
- Downtown – 365 rat complaints in 2017, 321 in 2018, 415.5 average yearly complaints per SqMi
- Bay Village – 35 rat complaints in 2017, 16 in 2018, 385 average yearly complaints per SqMi
- Beacon Hill – 51 rat complaints in 2017, 81 in 2018, 350.3 average yearly complaints per SqMi
- Chinatown – 47 rat complaints in 2017, 40 in 2018, 271.7 average yearly complaints per SqMi
Rodent complaints spiked in these neighborhoods
- South Boston Waterfront – 1 rat complaints in 2017, 3 in 2018 (+200%)
- Mission Hill – 10 rat complaints in 2017, 27 in 2018 (+170%)
- Mattapan – 19 rat complaints in 2017, 36 in 2018 (+90%)
- West Roxbury – 46 rat complaints in 2017, 84 in 2018 (+83%)
- Beacon Hill – 51 rat complaints in 2017, 81 in 2018 (+59%)
Rodent complaints dropped in these neighborhoods
- Bay Village – 35 rat complaints in 2017, 16 in 2018 (-54%)
- Jamaica Plain – 263 rat complaints in 2017, 124 in 2018 (-53%)
- Fenway – 84 rat complaints in 2017, 41 in 2018 (-51%)
- Back Bay – 217 rat complaints in 2017, 120 in 2018 (-45%)
- Allston – 168 rat complaints in 2017, 98 in 2018 (-42%)
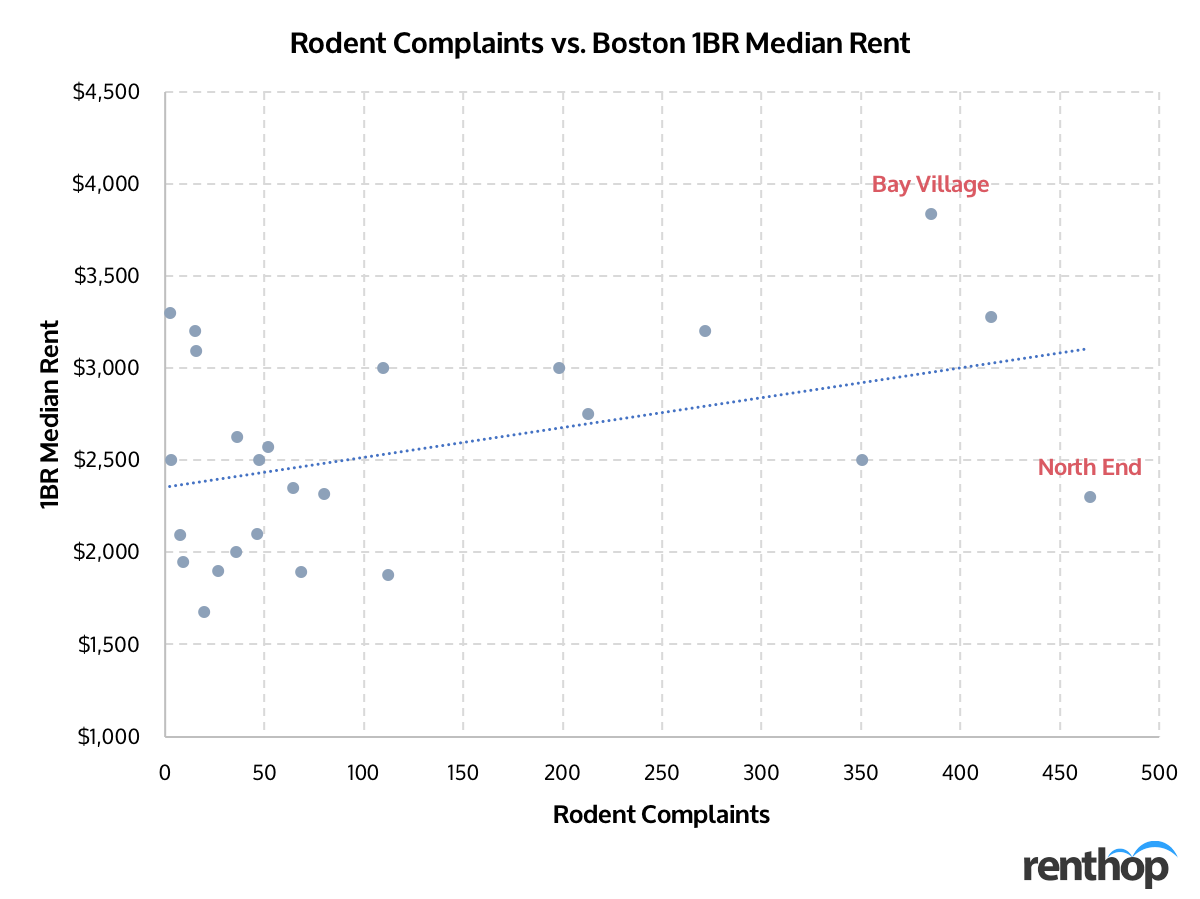
Rats vs. Rent
When looking at 1BR median rent and the number of rodent complaints by neighborhood, we noticed an interesting trend. There seems to be a positive correlation between rent and rodent complaints (R-square = 0.16, p <0.05). In other words, the higher the rent, the more rodent complaints a neighborhood received. The figure below further illustrates our findings. Could it be that these neighborhoods have a higher density of restaurants and residential buildings, and therefore, more food scraps that attract rats? We don’t know for sure.
When to Watch Out for Rodents
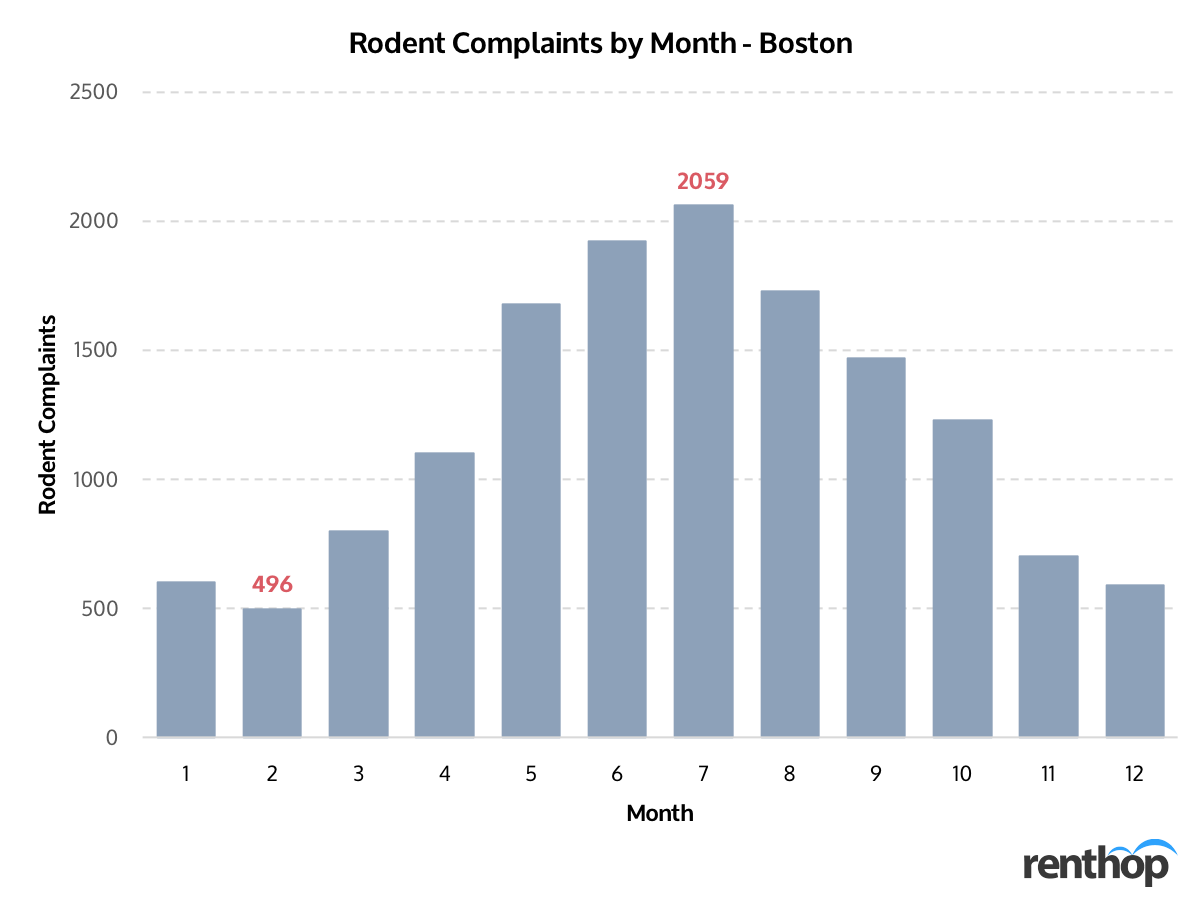
Don’t love spring cleaning? Our next discovery might change your mind. We noticed that rodents complaints tend to soar from May onwards till September, before dipping towards the end of the year in November, most probably due to seasonal changes such as milder winters and warmer summers which may have affected the rat activity level in the city. If you live in Boston and don’t want rats to be your housemates, be sure to clean up the mess in April so the rats don’t move into your place.
Chicago
In our study from last year, Chicago ranked #1 as the “rat capital” in the country. The abundance of garbage and buildings in the Windy City makes it a great location for rats to seek shelter and food for survival. In 2017, Chicago 311 received in total 50,963, 2.6 times more than what New York City received. That’s 1876.1 complaints per 100,000 residents, yikes! Exactly 12 months have passed since our last Chicago rat study, and the biggest question we have is, of course, how has it changed? Surprisingly, in 2018, the city only received 40,057 rodent complaints, 21% fewer than in 2017! One thing that is concerning, however, is that the city has received 21,991 rat complaints from January to July 2019, a 7% increase compared to the same period in 2018.
Is Your Neighborhood Rodent-Infested?
The interactive map below indicates the concentration of rodent complaints in Chicago. Neighborhoods in darker shades have a higher concentration of rodent complaints. It is very possible that larger neighborhoods receive more complaints than smaller neighborhoods, and so we normalized the number of rodent complaints by land size. You can click on the polygons to learn more about each neighborhood.
These Neighborhoods are Rodent-Infested
- Wrigleyville – 215 rat complaints in 2017, 84 in 2018, 669.4 average yearly complaints per SqMi
- Ukrainian Village – 374 rat complaints in 2017, 256 in 2018, 665.6 average yearly complaints per SqMi
- Sheffield & DePaul – 247 rat complaints in 2017, 187 in 2018, 641.5 average yearly complaints per SqMi
- Lake View – 1,724 rat complaints in 2017, 1,540 in 2018, 638.4 average yearly complaints per SqMi
- West Ridge – 2,043 rat complaints in 2017, 1,094 in 2018, 575.4 average yearly complaints per SqMi
Rodent complaints spiked in these neighborhoods
- Magnificent Mile – 3 rat complaints in 2017, 12 in 2018 (+300%)
- Oakland – 13 rat complaints in 2017, 21 in 2018 (+62%)
- Kenwood – 79 rat complaints in 2017, 113 in 2018 (+57%)
- Little Italy, UIC – 325 rat complaints in 2017, 379 in 2018 (+17%)
- Little Village – 1,094 rat complaints in 2017, 1,239 in 2018 (+13%)
Rodent complaints dropped in these neighborhoods
- Wrigleyville – 222 rat complaints in 2017, 90 in 2018 (-59%)
- North Park – 485 rat complaints in 2017, 204 in 2018 (-58%)
- Edison Park – 45 rat complaints in 2017, 19 in 2018 (-58%)
- New Northwood – 85 rat complaints in 2017, 20 in 2018 (-57%)
- Archer Heights – 245 rat complaints in 2017, 110 in 2018 (-55%)
Rats vs. Rent
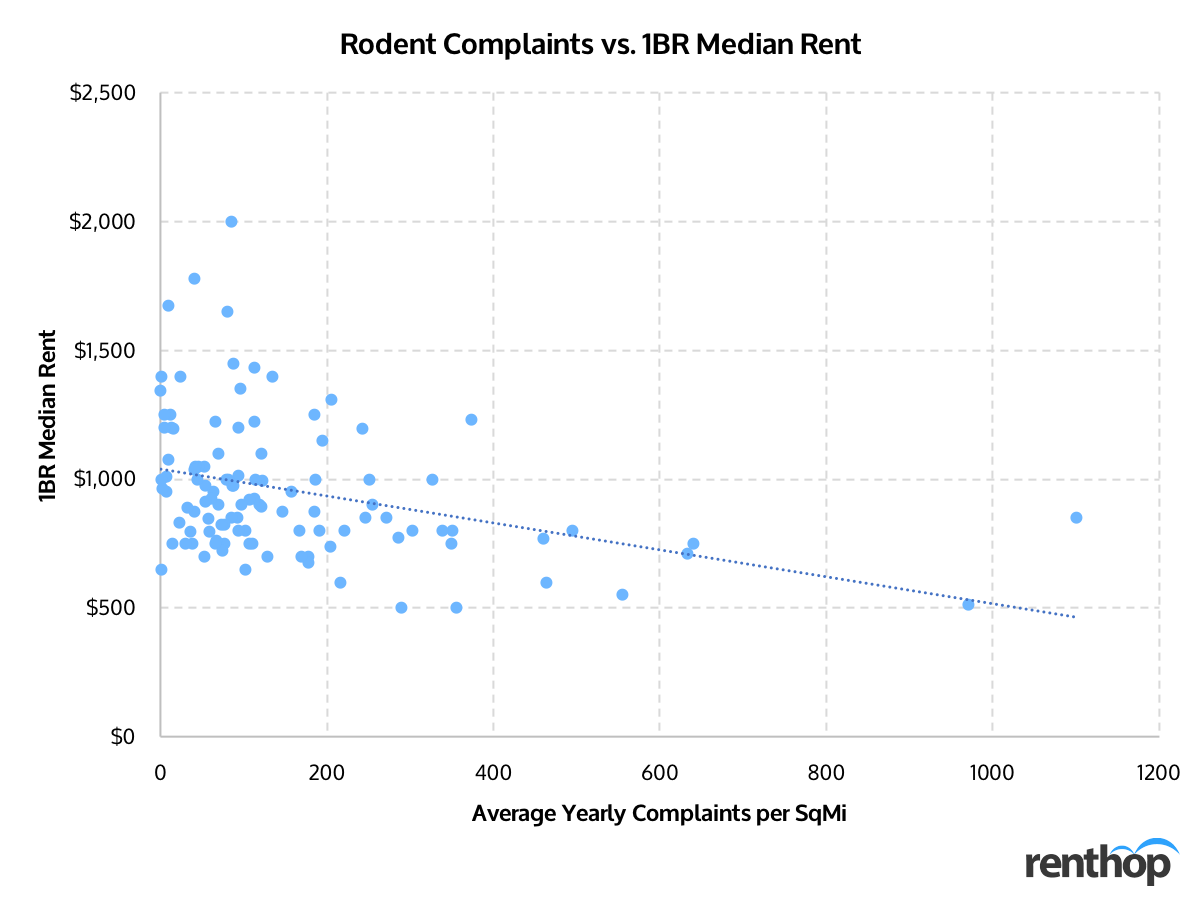
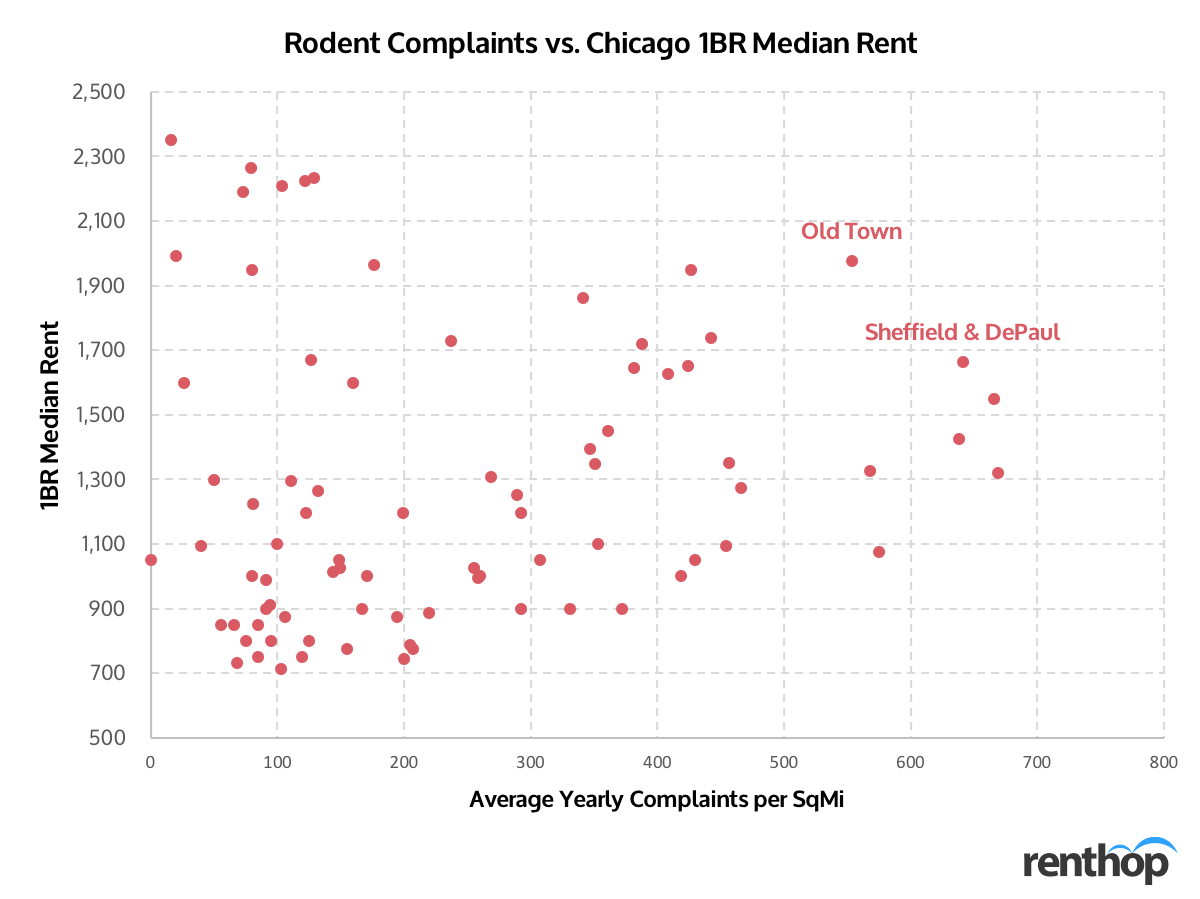
When looking at the plot of rodent complaints versus median rents, with median rents as the independent variable, we can see clustering of high numbers of complaints where rents are lower somewhere. Complaints are less common where rents are higher. We don’t see any neighborhoods with high rents and high complaints.
When to Watch Out for Rodents
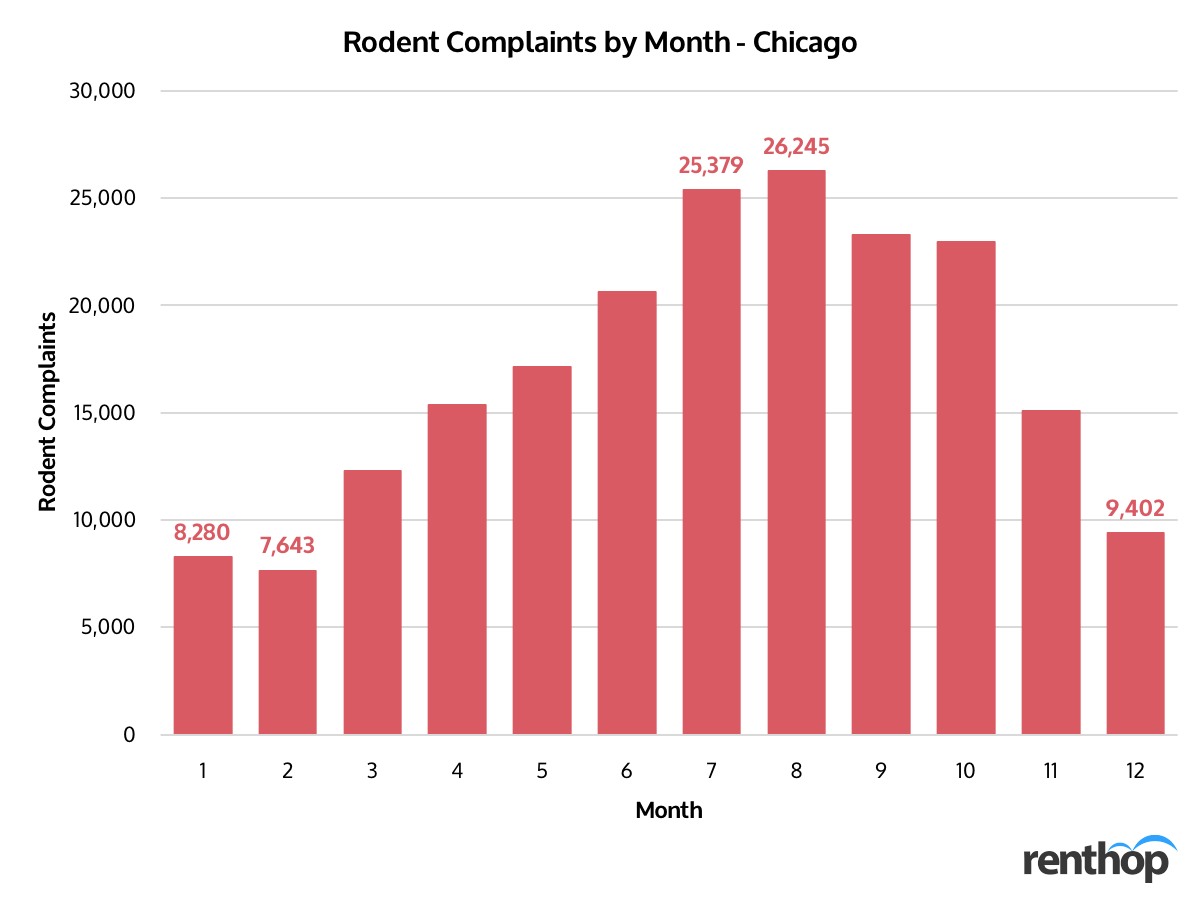
Similar to what we discovered in Boston, rats in Chicago tend to be more active in the summer. From 2014 to 2018, the rat complaints started soaring from April onwards till July, before dipping towards the end of the year in December and reaching its lowest in February.
New York
What does being a New Yorker mean? For many who take the subway daily, it means to think nothing of it when a rat runs over your foot at Broadway-Lafayette or the Grand Street L train station. An estimate of about 250,000 to millions of rats lived in the city in 2017. To put these numbers into perspective, New York City’s rats is equal to approximately 20% of the human population. But Big Apple, we have some great news – the number of rodent complaints, in fact, went down in 2018. The city government received in total 17,353 rat sighting complaints this past year, 9% fewer than 2017. Sadly, that does not mean the rodent crisis has been averted. In certain neighborhoods, such as Auburndale, Queens and Bay Ridge, Brooklyn, the number of rat sightings increased drastically the past year. How did your neighborhood in 2018? Have all the furry critters been hunted down?
Since New York City is the only city with boroughs, we started our analysis by breaking down the number of rat sighting complaints by borough. The table below indicates how the numbers have changed by year and by borough. Overall, all boroughs had fewer rat sightings in 2018. The number of complaints decreased the most in the Bronx, with only 3,134 rat sightings, 16% lower than in 2017. While the number did go down by 9%, Brooklyn maintained its title as the Borough of Rats, with in total 6,565 rat sighting complaints filed, followed by 4,507 in Manhattan. However, this comparison does not consider the land size of each borough. When calculating the number of rodent complaints per square mile, the story changes. While Brooklyn has the greatest number of rodent complaints among the five boroughs, Manhattan actually leads the number of rat sightings per square mile, ouch.
| Borough | Number of Complaints | Complaints per SqMi |
| Bronx | 3,134 | 73.8 |
| Brooklyn | 6,565 | 94.5 |
| Manhattan | 4,295 | 188.2 |
| Queens | 2,605 | 24.1 |
| Staten Island | 745 | 12.7 |
Is Your Neighborhood Rodent-Infested?
The interactive map below indicates the concentration of rodent complaints in New York City. Neighborhoods in darker shades have a higher concentration of rat sightings. It is very possible that larger neighborhoods receive more complaints than smaller neighborhoods, and so we normalized the number of rodent complaints by land size, just like how we analyzed the borough-level data. You can click on the polygons to learn more about each neighborhood.
These Neighborhoods are Rodent-Infested
- Prospect Heights – 408 rat complaints in 2017, 282 in 2018, 529.7 average yearly complaints per SqMi
- Central Harlem South – 301 rat complaints in 2017, 247 in 2018, 464.9 average yearly complaints per SqMi
- Yorkville – 194 rat complaints in 2017, 116 in 2018, 399.3 average yearly complaints per SqMi
- Hamilton Heights – 195 rat complaints in 2017, 226 in 2018, 336 average yearly complaints per SqMi
- Clinton Hill – 312 rat complaints in 2017, 240 in 2018, 334.9 average yearly complaints per SqMi
Rodent complaints spike the most in these neighborhoods
- Auburndale, Queens – 5 rat complaints in 2017, 22 in 2018 (+340%)
- Oakland Gardens, Queens – 4 rat complaints in 2017, 12 in 2018 (+200%)
- New Brighton-Silver Lake, Staten Island – 14 rat complaints in 2017, 37 in 2018 (+164%)
- Seagate-Coney Island, Brooklyn – 26 rat complaints in 2017, 59 in 2018 (+127%)
- Bay Ridge, Brooklyn – 40 rat complaints in 2017, 86 in 2018 (+115%)
Rodent complaints dropped the most in these neighborhoods
- Bayside-Bayside Hills, Queens – 73 rat complaints in 2017, 18 in 2018 (-75%)
- Rego Park, Queens – 66 rat complaints in 2017, 18 in 2018 (-73%)
- Ocean Parkway South, Brooklyn – 70 rat complaints in 2017, 20 in 2018 (-71%)
- College Point, Queens – 14 rat complaints in 2017, 5 in 2018 (-64%)
- Ozone Park, Queens – 38 rat complaints in 2017, 14 in 2018 (-63%)
Rats vs. Rent
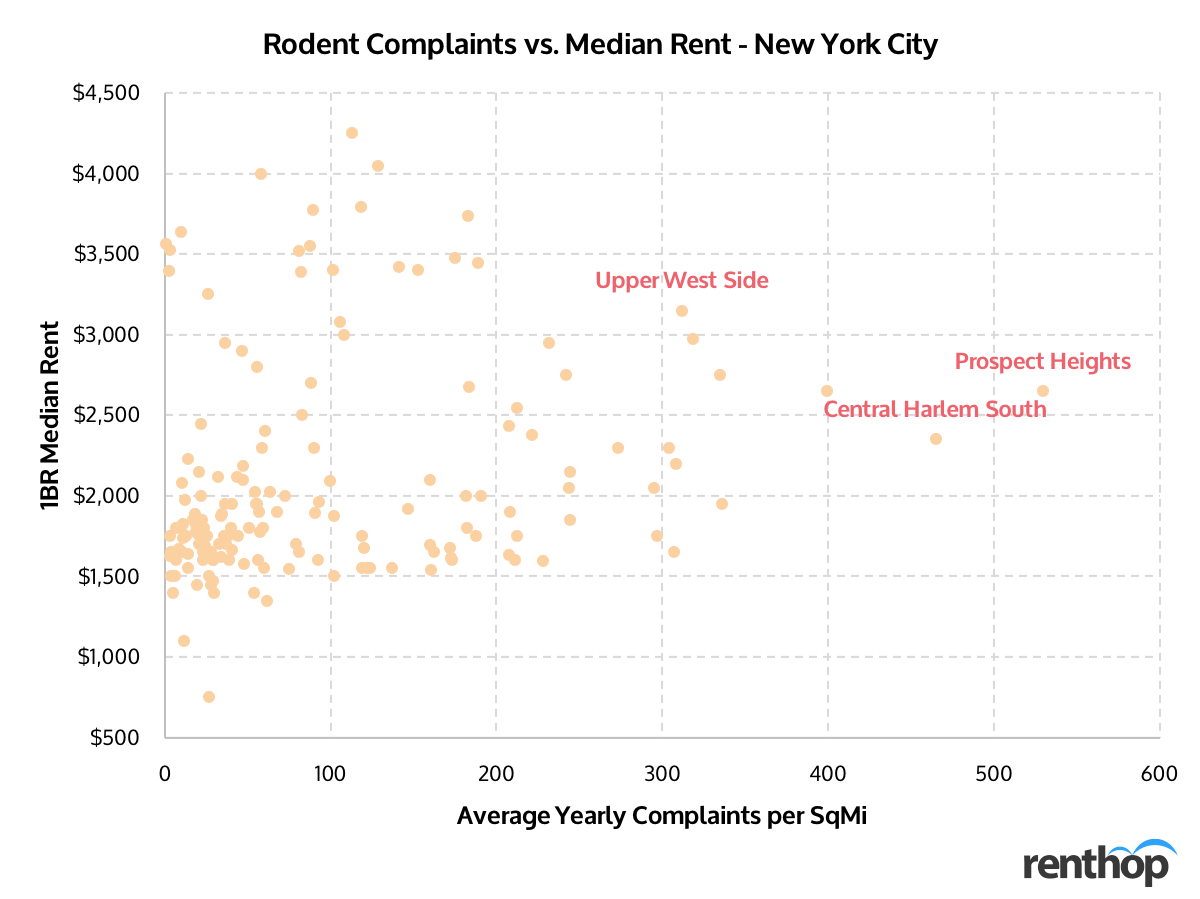
When looking at the plot of rodent complaints versus median rents, with median rents as the independent variable, we can see clustering of high numbers of complaints where rents are lower somewhere. As labeled on the plot, Prospect Heights, Upper West Side, and Central Harlem South stood out the most in terms of the number of rodent complaints among other neighborhoods. Complaints are less common where rents are higher. We don’t see any neighborhoods with high rents and high complaints.
When to Watch Out for Rodents
Compared to other cities, the seasonality of rat sightings in New York City is less significant. In general, rodent complaints peak in summer and drop to their lowest in winter, but in New York City, the number of complaints in January is around 50% of that in July. Whereas the difference is greater in other cities, such as Chicago.
Washington D.C.
Washington D.C. is known for many things. It is the capital of the United States of America; it is a cultural center with many monuments and museums, such as the Smithsonian Institution; and it is a walkable and bike-friendly city with many bike lanes in the downtown area. What you probably don’t know about D.C. is that not only our president and government officials reside there, many, many rats also call it home. In our study this year, we discovered that Washington D.C., among four other cities, is the only city experiencing an increasing number of rat complaints. In 2017, the number of rat complaints reached 5,310, 50% more than in 2016. In 2018, that number further went up 7.6% to 5,715, or 83.6 per Sq Mi. So far in 2019, the D.C. 311 has received 3,385 rat complaints, 9% higher than the same period in 2017.
Is Your Neighborhood Rodent-Infested?
The interactive map below indicates the concentration of rodent complaints in New York City. Neighborhoods in darker shades have a higher concentration of rat sightings. It is very possible that larger neighborhoods receive more complaints than smaller neighborhoods, and so we normalized the number of rodent complaints by land size, just like how we analyzed the borough-level data. You can click on the polygons to learn more about each neighborhood.
These Neighborhoods are Rodent-Infested
- Columbia Heights, Mt. Pleasant, Pleasant Plains, Park View – 741 rat complaints in 2017, 757 in 2018, 384.2 average yearly complaints per SqMi
- Shaw, Logan Circle – 319 rat complaints in 2017, 244 in 2018, 313.1 average yearly complaints per SqMi
- Dupont Circle, Connecticut Avenue/K Street – 321 rat complaints in 2017, 285 in 2018, 232.4 average yearly complaints per SqMi
- Howard University, Le Droit Park, Cardozo/Shaw – 259 rat complaints in 2017, 245 in 2018, 228.1 average yearly complaints per SqMi
- Brightwood Park, Crestwood, Petworth – 648 rat complaints in 2017, 692 in 2018, 161.1 average yearly complaints per SqMi
Rodent complaints spike the most in these neighborhoods
- North Cleveland Park, Forest Hills, Van Ness – 2 rat complaints in 2017, 6 in 2018 (+200%)
- National Mall, Potomac River – 6 rat complaints in 2017, 17 in 2018 (+183%)
- Douglas, Shipley Terrace – 12 rat complaints in 2017, 32 in 2018 (+167%)
- Spring Valley, Palisades, Wesley Heights, Foxhall Crescent, Foxhall Village, Georgetown Reservoir – 19 rat complaints in 2017, 30 in 2018 (+138%)
- North Michigan Park, Michigan Park, University Heights – 52 rat complaints in 2017, 102 in 2018 (+96%)
Rodent complaints dropped the most in these neighborhoods
- Colonial Village, Shepherd Park, North Portal Estates – 11 rat complaints in 2017, 7 in 2018 (-36%)
- Friendship Heights, American University Park, Tenleytown -26 rat complaints in 2017, 17 in 2018 (-35%)
- Fairfax Village, Naylor Gardens, Hillcrest, Summit Park – 10 rat complaints in 2017, 7 in 2018 (-30%)
- Takoma, Brightwood, Manor Park – 149 rat complaints in 2017, 106 in 2018 (-29%)
- Shaw, Logan Circle – 319 rat complaints in 2017, 244 in 2018 (-24%)
Rats vs. Rent
Unlike what we have seen in other cities such as Boston and Baltimore, we did not find any trend when looking at rats vs. 1BR median rent in Washington D.C. Nor did we see any clusters related to high or low rents.
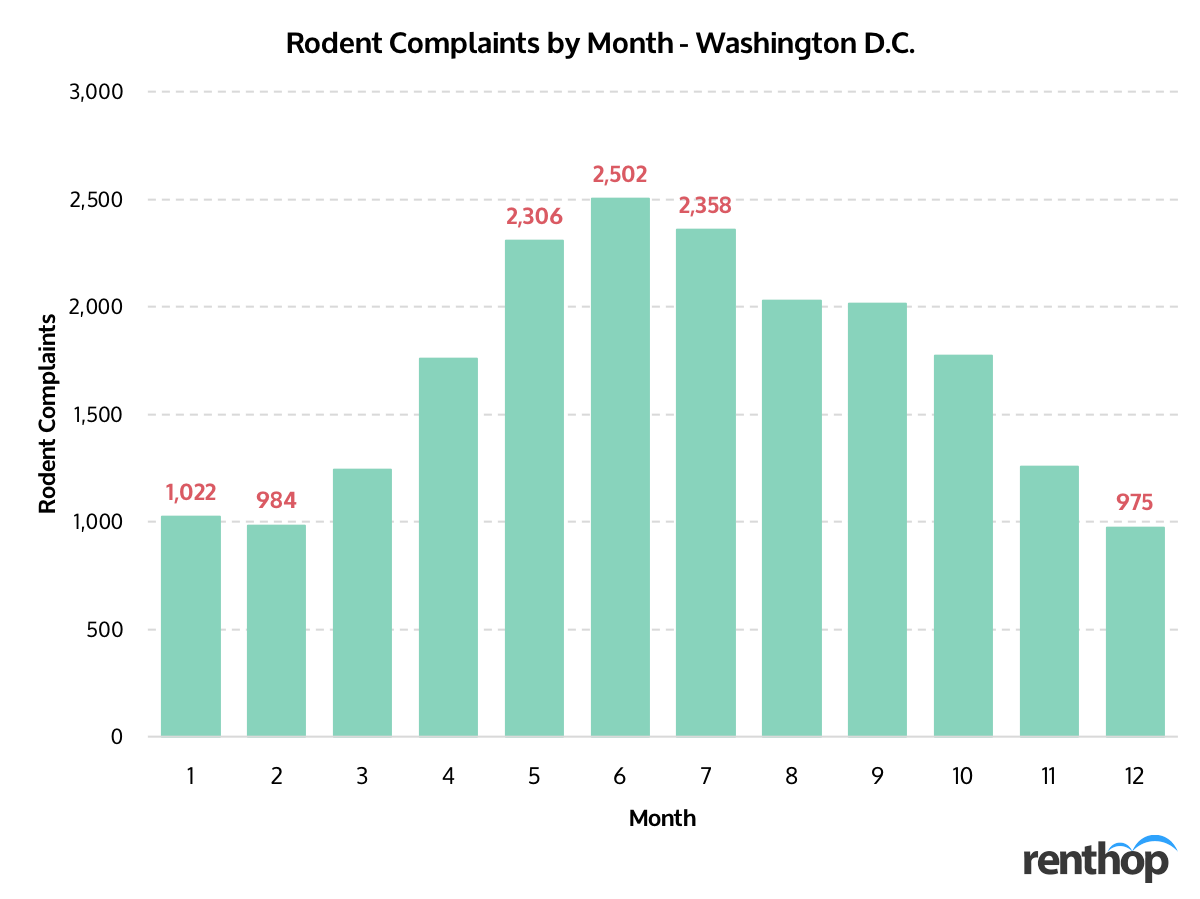
When to Watch Out for Rodents
Similar to what we found in Chicago, rodent complaints tend to rise in summer and drop to its lowest in winter. Why is that? It might be highly possible that rat populations spike in summer as new rat pups are weaned in spring and in late summer or early fall. Rats are known for being more aggressive in finding food and preparing themselves for winter during the summer season through the means of stockpiling and nesting.
Disclaimer – here at RentHop, we are not about choosing sides. We are all about data and facts. We do annual studies on 311 complaints across major U.S. cities. To get to know the city you live in, take a look at our previous studies on rodent complaints, human/animal waste complaints, noise complaints, and more.


