Chicago ranks #1 as the “rat capital” in the country. The abundance of garbage and buildings in The Windy City makes it a great location for these rats to seek shelter and food for survival. The presence of these furry critters poses a threat to city dwellers due to the fact that they are capable of spreading diseases and cause allergic reactions to humans and animals.
Last year, we saw a total of 50,963 rat complaints. Compared to 2014 (32,855), the number of rat complaints in 2017 increased 55.1%. Furthermore, in the first half of 2018 (from January to June), there were already 13,753 rat complaints lodged to Chicago’s 311. We’ve collected a subset of data of 2017’s rat complaints made to Chicago’s 311 to find out more about which neighborhoods and locations have it the worst and if there have been areas with higher rat sightings over the years.
Here are the Key Findings from the Study:
- In 2017, Chicago tops the list with the most number of rat complaints compared among other cities including Boston, New York City and Washington DC (fig. 1).
- When comparing the number of complaints per 100,000 residents, Chicago topped the list with 1876.09 complaints per 100,000 residents (fig. 2).
- Logan Square, Englewood, and West Ridge are the top 3 complaint neighborhoods (fig. 3).
- Most of the neighborhoods with a higher concentration of rat complaints coincide with the neighborhoods with a higher concentration of dog poop!
- Neighborhoods in Downtown Chicago such as The Loop, Gold Coast, and River North have much fewer rat complaints than the other neighborhoods (fig. 3).
- Printers Row, Riverdale, and Oakland are the neighborhoods with the lowest volume of rat complaints (fig. 4).
- There seem to be a weak correlation between the rat complaint counts and median rents in Chicago (fig. 5).
- Top 3 rat complaint addresses include 6931 S Campbell Ave, followed by 1548 W Edgewater Ave, and 6225 N Kenmore Ave (fig. 6).
- From 2014 to 2017, there was an increase in the number of rat complaints with a surge in 2016 (fig. 7).
We first take a look at the number of rat complaints among the 4 major cities in 2017. Rat complaints consist of mice infestation, rat activity and rodent inspection and treatment in New York City, Chicago, Boston and Washington DC.
Rat Complaints by Cities, 2017
Figure 1
Comparing 311 Rat Complaints in 2017 by Major Cities
From the overview, among the cities, Chicago has the greatest number of total rat complaints all year round, followed by New York City, Washington DC and then Boston. The gap in the total number of rat complaints in 2017 between New York City and Chicago is significantly vast, with the difference in rat complaints between these cities ranging roughly between 56.5% to 66.1%.
While this comparison reveals that Chicago leads the number of rat complaints among the other cities, it does not take into account the population of each city. To rank fairly, we normalized complaints by city population according to the most recent Census data available. Hypothetically, cities with denser populations might have more complaints. This allows us to fairly compare one city to another because one would assume that a city with denser population will also have more complaints, and this will correct that.
Figure 2
Comparing 311 Rat Complaints in 2017 in Major Cities by Normalized Complaints
Rat complaints in 2017 by cities sorted in descending order according to complaints per 100,000 residents.
By calculating complaints per 100,000 residents, we’re surprised to find that as one of the most populous state, New York City actually ranks behind Chicago and the other cities in terms of the number of rat complaints. Chicago still tops the list as the city with the most number of complaints per 100,000 residents. However, Washington DC follows behind Chicago, followed by Boston and then New York City.
With a better sense of the number of rat complaints among these cities, we’re curious about which neighborhoods have the highest concentration of rat complaints. We’ve looked at the most recent data from 2017 and created an interactive map to visualize the trends by first geocoding the exact longitudes and latitudes of the incidents to their respective neighborhoods.
Which Chicago Neighborhoods had the Most Rat Complaints in 2017?
Figure 3
Chicago Rat Complaints 2017 Interactive Visualization by Neighborhoods (With Median Rents)
Full data for the number of rodent complaints in 2017 is sourced from the Chicago Data Portal site. Exact latitude-longitude coordinates at each incident location were geocoded to corresponding neighborhoods.
Median Rents are calculated using RentHop Data from January 2016 to March 2018. This year’s data includes complaints made from January 1, 2017 – December 31, 2017.
Hover over the map for more information on each neighborhood.
Figure 4
Comparison of Chicago Rat Complaints 2017 by Median Rents & Neighborhoods
Taking a look at the above map and table, we noticed Logan Square (2,448 complaints), Englewood (2,276 complaints) and West Ridge (2,167 complaints) all appear in the darkest red. These are the neighborhoods which have the highest volume of rat complaints. Several other neighborhoods also highlighted in dark red shades include Lake View (1,785 complaints), Washington Heights (1,560 complaints), Austin (1,455 complaints) and Clearing (1,435 complaints). All of these neighborhoods have the highest volume of rat complaints and counts of premises baited. On the other hand, the majority of the neighborhoods in downtown Chicago, such as the Loop, Streeterville, River North, and Gold Coast also had rat complaints but they are covered in much lighter shades of red.
An interesting finding is that neighborhoods with higher complaints coincide with the neighborhoods in which high concentrations of poop complaints. This is most likely due to the fact that rats are attracted by dog poop as a food source, especially in the city.
From the map, we also observed that the top 3 least rat-infested neighborhoods are Museum Campus (0 complaints), Millenium Park (1 complaint) and Greektown (2 complaints). However, these neighborhoods are more parks than residential areas. Looking at the top 3 least rat complaint residential neighborhoods, we find that they are Printers Row (3 complaints), Riverdale (8 complaints) and Oakland (11 complaints). 1-bedroom median rents in the neighborhoods with the highest number of complaints seem to lie within a moderate range between $900 to $1,500. Is it possible that neighborhoods with a lower number of rat complaints are those with higher median rents?
Association of Rat Complaints vs 1-Bedroom Median Rents
Figure 5
Chicago Rat Complaints vs Median Rents
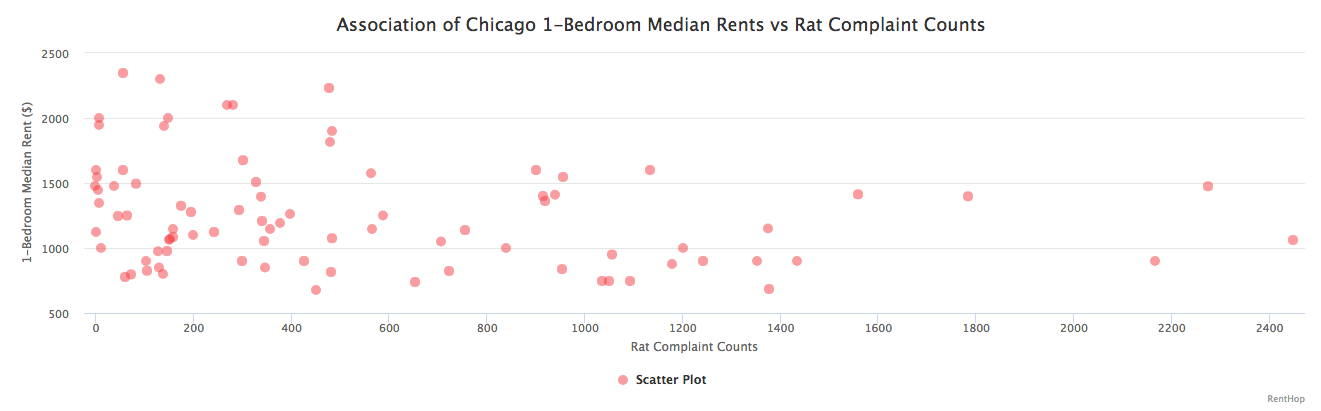
When looking at the plot of rat complaint counts versus median rents, with median rents as the independent variable, we can see a trend where neighborhoods with higher rat complaint counts are also the neighborhoods with lower 1-bedroom median rents. However, when measuring the correlation coefficient between median rents and rat complaint counts, we discovered that the variables follow a weak negative correlation with a value of -0.24. This indicates that the rat complaint counts and median rents might be associated, however, it is to be taken with a pinch of salt. Neighborhood amenities, distance from the L train stops and ease of accessibility to commute to downtown Chicago might also have an impact on the median rents.
Where Are the Exact Locations of the Most Complained Buildings?
Figure 6
Chicago Rat Complaints Top Addresses, 2017
Since rat complaints from the same address within the same day may point to the same rat incident in that location, it makes sense to group and look at unique complaints according to repeated calls from their respective addresses. The table above lists the most complained about addresses in 2017, sorted by unique complaint counts, accompanied by raw complaint counts. From the table, we see that the most notorious number of rat complaints came from 6931 S Campbell Ave (35 unique complaints), Lithuanian Plaza, followed by 1548 W Edgewater Ave (33 unique complaints), Edgewater, and then 6225 N Kenmore Ave (30 unique complaints), Edgewater Beach.
The number of rat complaints all over in Chicago is worrying, no wonder Chicago is touted as the “rattiest” city in the country. Most importantly, rat complaints have seen a spike, especially during the summer.
Have there been any changes in the number of rat complaints over the years?
We’ve also investigated the rat complaint counts over the years from Chicago’s 311 data from Chicago Data Portal over the years from 2014 to 2017.
Figure 7
Chicago Rat Complaints Yearly Comparison
The rat complaints in Chicago increase every year. In addition, we also discovered that there was a jump in the number of rat complaints from 2015 to 2016, likely due to milder winters and an increased awareness of the problem. The surge in rat complaints in 2016 has led to an increased amount of city efforts poured into decimating these vermin through dry ice.
Moreover, we also noticed that the rat complaints started soaring from April onwards till July, before dipping towards the end of the year in December, most probably due to seasonal changes such as milder winters and warmer summers which may have affected the rat activity level in the city.
What can I do to curb or avoid rat infestations?
If you frequently find yourself seeing these furry creatures scurrying around your building or neighborhood, you should first call 311 or visit the online portal for creating complaints, which allows you to make complaints, anonymously if you wish. An inspector from the Chicago HPD will come to check the building for violations, usually within a few days.
To further prevent these pests from populating in your area, remember to always securely tie and discard your garbage properly into a can with a lid. Rats love to thrive in places with food and leftovers. You wouldn’t want them to get access to such things so easily. In addition, you could also get rid of your garbage close to the garbage pickup truck’s arrival time at your building. This will significantly reduce the number of garbage bags left outside your building and it will also leave more space for any additional garbage the following day. Other than that, make sure that you make your living space as undesirable as possible even to deter even the most ambitious rats.
Regardless, be consistent. While these tips may seem easy to follow, but to practice them consistently requires consistent effort and commitment.
If you’re in the market for a new apartment or were just influenced to move because of this study, be sure to check out our extensive selection of Chicago Apartment for Rent.


