Finding the right apartment is never easy, especially in the City of New York.
To find the right apartment, we need to first identify the right neighborhood. But how do we do that? Well, this is where data science comes in handy. Instead of blindly recommending neighborhoods based on how “hip” they are, the Data Science team at RentHop crunched the numbers and ranked the NYC neighborhoods by livability. We all know that as people, we value different things. For some, finding an apartment in a quiet neighborhood is of the highest priority, while for others the number of subway stops in the area is just as important. We believe, by analyzing the pros and cons of each neighborhood, we can help renters make an informed decision and find the perfect apartment in less time. The findings will be released in our quarterly RentHop Neighborhood Livability Index.
Our findings this quarter include:
-
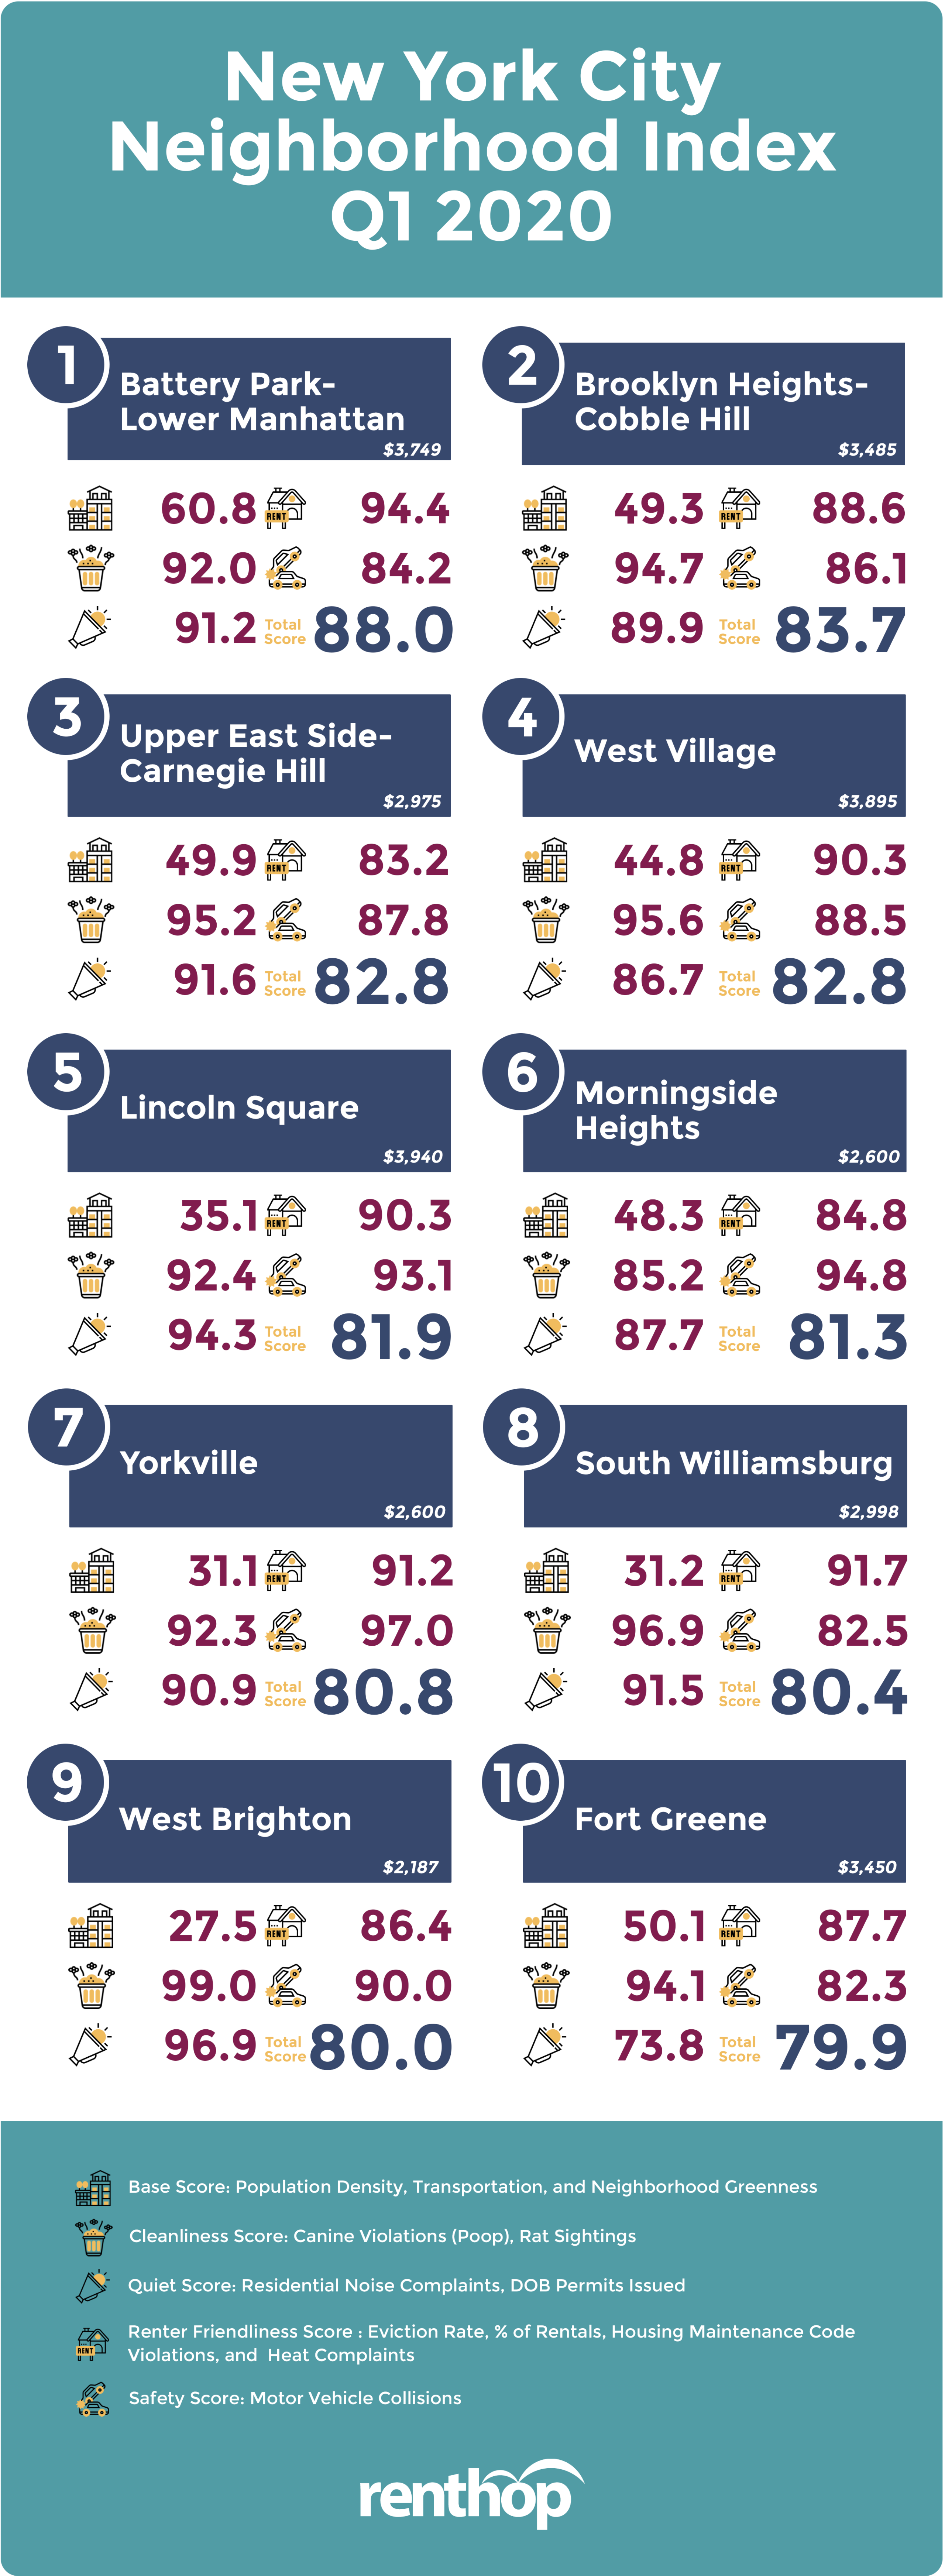
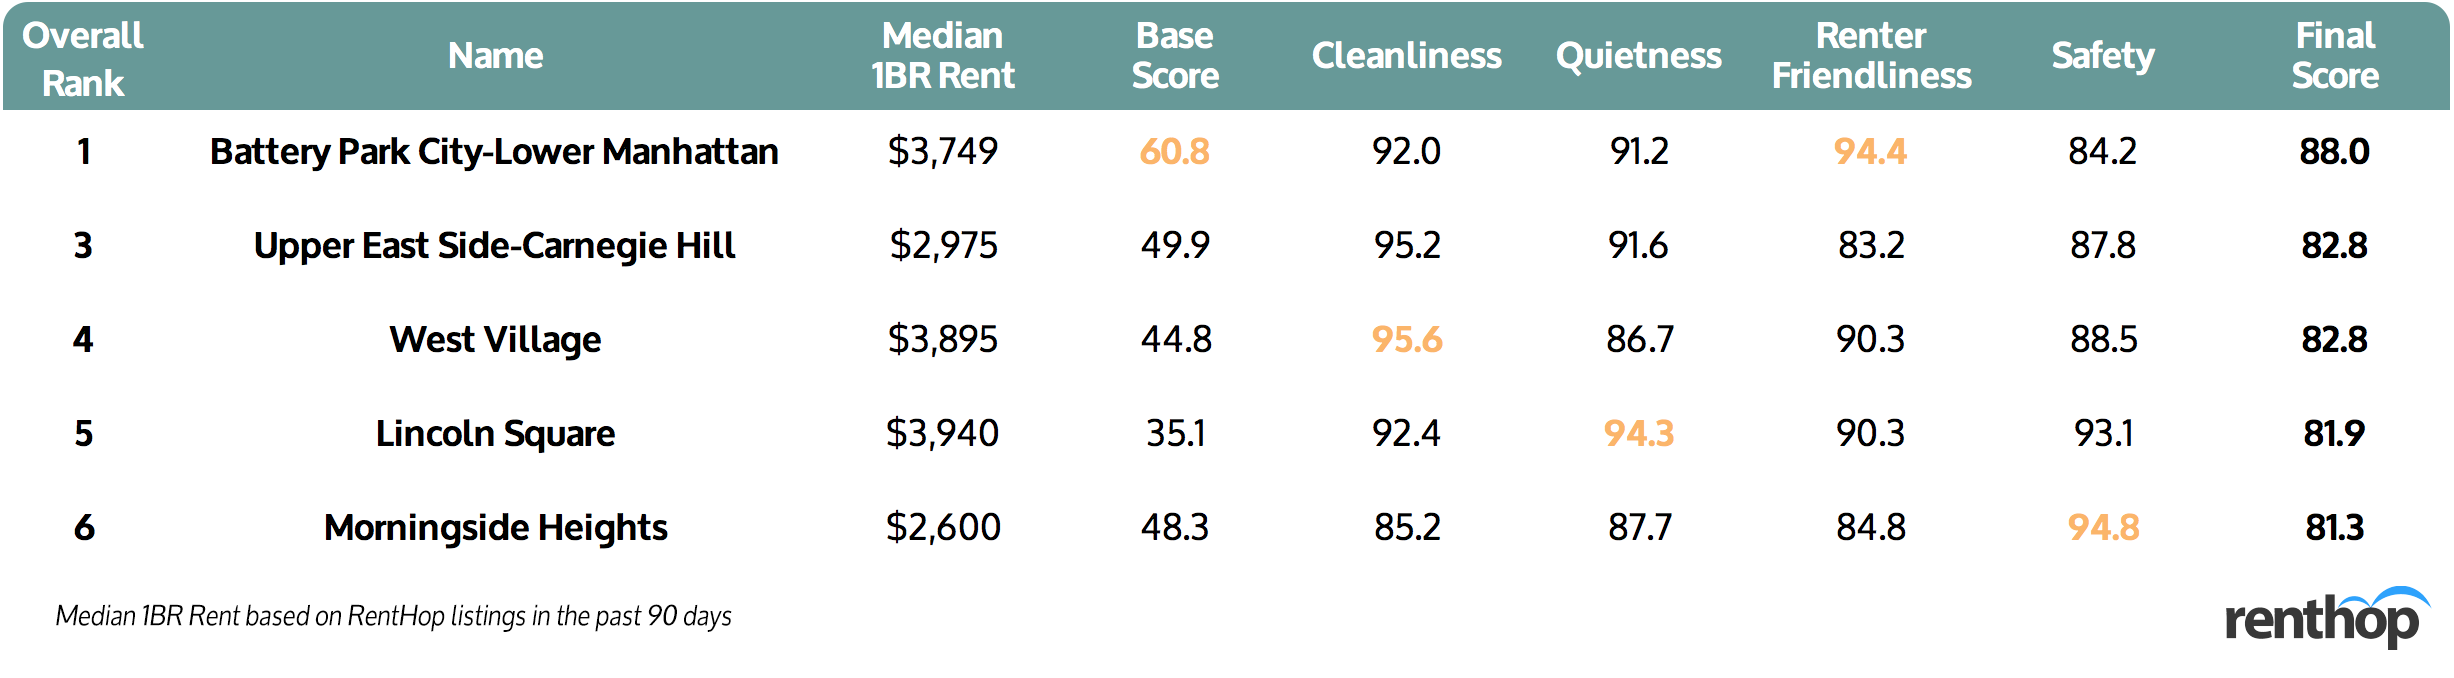
- Battery Park City-Lower Manhattan ranks the best neighborhood among 150+ NYC neighborhoods. The NTA, which includes FiDi and Battery Park City, has 14 subway stops, or 20.5 per sq mi, with a renter-friendliness score of 94.4. However, it is not cheap to enjoy such convenience – the median 1BR rent is $3,749 in this neighborhood. [Neighborhood Livability Infographic]
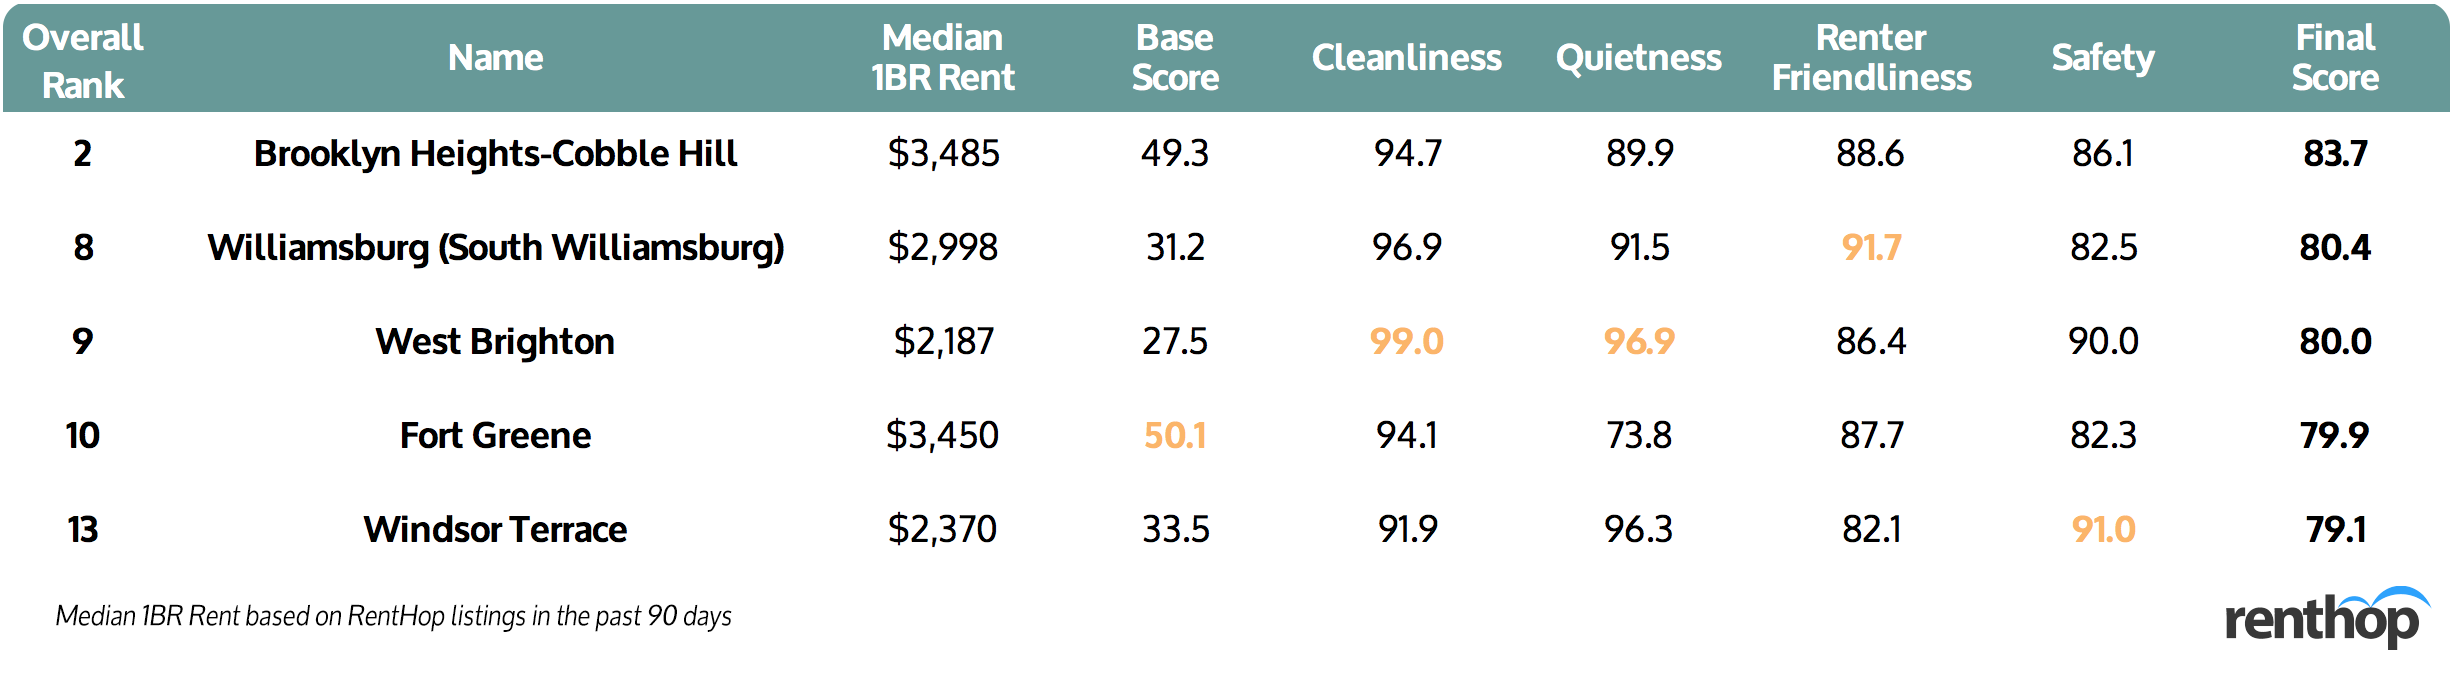
- Brooklyn Heights-Cobble Hill makes the second in NYC and top in Brooklyn with a high cleanliness score of 94.7, which means that the residents experience fewer poop complaints and rodent sightings. [Neighborhood Livability Map]
- Washington Heights South suffers a low renter-friendliness score. This is mainly due to heat complaints – the neighborhood received 640.2 heat complaints/10k households from October 16, 2019, to January 15, 2020. It also received lots of housing maintenance code violations. In total, 914 violations, or 338/10k households were issued during the same time period.
- Midtown-Midtown South, while being the healthiest neighborhood in New York City, saw the most motor vehicle collisions. From October 16, 2019, to January 15, 2020, the neighborhood saw 813 collisions, or 220 collisions/10k population.
- Surprisingly, the popular North Side-South Side (commonly known as Williamsburg) only scored 70.6, mainly due to its poor performance in the Cleanliness and Quietness categories. While receiving no poop complaints, the neighborhood saw 56 rodent complaints, or 29.2/10k households, which brought its cleanliness score to 75.0. Meanwhile, the neighborhood received 452 noise complaints, or 235.8/10k households, therefore earning only 69.9 in the quietness category.
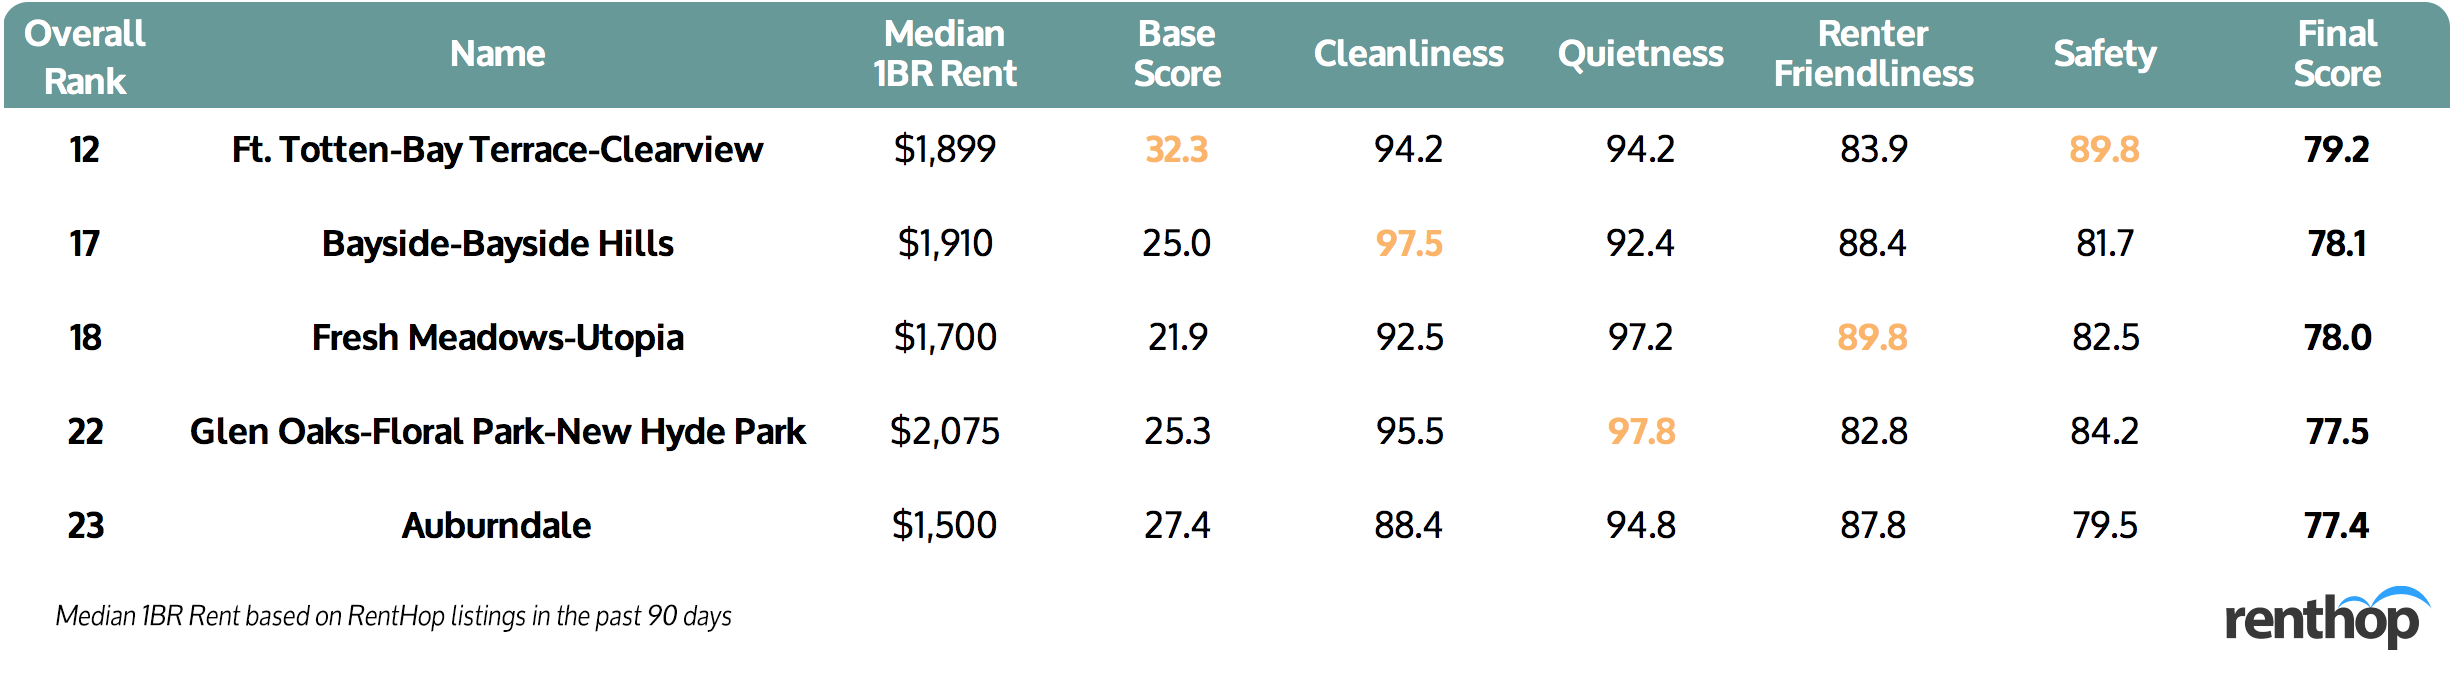
- Ft. Totten-Bay Terrace-Clearview, Bayside-Bayside Hills, and Fresh Meadows-Utopia are the top three neighborhoods in Queens, scoring 79.2, 78.1, and 78.0 respectively. [Top 5 Neighborhoods in Queens]
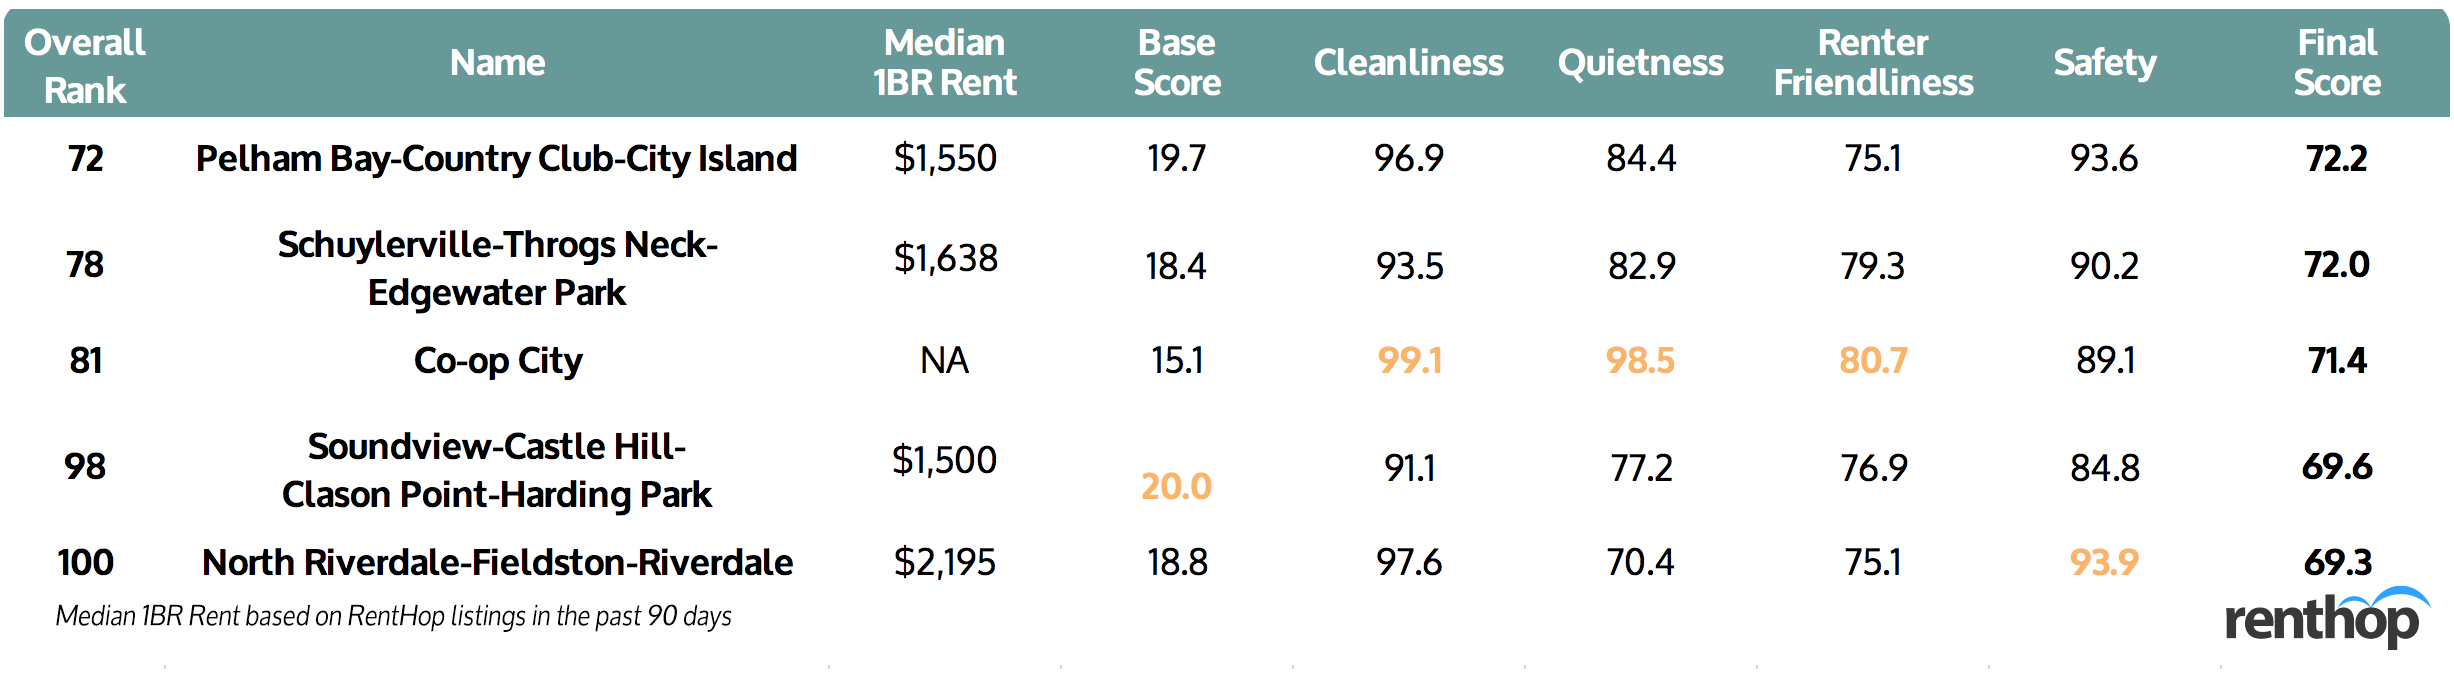
- The average score among neighborhoods in the Bronx is 61.7. This is mainly affected by the base score (mostly the transportation part), as well as renter friendliness. [Top 5 Neighborhoods in the Bronx]
NYC Neighborhood Livability Map
The map below illustrates the livability of each NYC neighborhood. The darker the shade, the higher the score. You can click on the neighborhoods to learn more about the score breakdown as well as the median 1BR rent.
Generally speaking, Manhattan neighborhoods enjoy higher base scores thanks to the comprehensive MTA subway lines. Compared to the other three boroughs, Manhattan neighborhoods also have relatively higher renter-friendliness scores (average 79.4). Neighborhoods in Queens enjoy higher cleanliness scores, averaging 91.6, with few poop complaints and rat sightings. It is also the quietest borough with the least noise complaints and DOB permits issued, averaging 86.5 in the quiet score category. The neighborhoods in the Bronx generally did not perform well in the quiet score category nor renter friendliness. Most neighborhoods suffer high heat complaints as well as housing maintenance code violations.
Here are the Top 10 Neighborhoods in New York City


How We Did It
To determine the most renter-friendly and best neighborhoods in New York City, we compared over 190 Neighborhood Tabulation Areas (NTAs) across six key categories, including (1) Neighborhood Greenness, (2) Transportation, (3) Quality of Life, (4) Renter Friendliness, and (5) Safety, using in total 13 relevant metrics.
The following metrics were used for this neighborhood livability index:
Base Score [25 points]
- Population Density — NTA Population / Land Size (sq mi) [2.5 points]
- Transportation — MTA Subway Stops / Land Size (sq mi) [10 points]
- Neighborhood Greenness: Tree Data — Street Tree Count / Land Size (sq mi) [6.25 points]
- Neighborhood Greenness: Park Coverage — Park Area / Land Size (sq mi) [6.25 points]
Cleanliness [15 points]
- Poop Complaints — 311 Canine Violations / 10k Households [7.5 points]
- Rodent — 311 Rat Sightings / 10k Households [7.5 points]
Quietness [20 points]
- Noise Complaints — 311 Residential Noise Complaints / 10k Households [16 points]
- Potential Construction Noise — DOB Permits Issued / Total Housing Units [2 points]
Renter Friendliness [30 points]
- Landlord Level of Responsibility: Heat Season — 311 Heat Complaints / Renter-Occupied Units [9 points]
- Landlord Level of Responsibility: HMV — Housing Maintenance Code Violations / Renter-Occupied Units [3 points]
- Percentage of Renter-Occupied Units — Renter-Occupied Units / Total Occupied Units [3 points]
- Evictions — Evictions / Renter-Occupied Units [15 points]
Safety [10 points]
- Motor Vehicle Collisions — Collisions / 10k Population [10 points]
We also adjusted the curve based on rental unit availability since that it’d be easier for renters to find an apartment in a given neighborhood if it has more available units on market. The rental rates were calculated using RentHop listings from October 16, 2019, to January 15, 2020.
We will be releasing the RentHop Neighborhood Livability Index on a quarterly basis, and we’d love to hear from you! Think we missed something? Any specific 311 complaints or dataset you’d like us to include? Or, would you like to work on an urban planning project using our underlying dataset? Email us at press@renthop.com.


