The wallet of a New Yorker has it pretty rough…
Anyone who’s spent a gratuitous chunk of their monthly wage on rent can agree. Unfortunately for business owners, they get hit twice, also having to stomach the similarly astronomical commercial real estate prices. A quick glance at data shared with us from commercial real estate platform 42Floors tells us the average business in SoHo shells out $67.93 per square foot per year on office space, while in Williamsburg it costs $44.41 for that space. Many of these businesses are very large, with monthly spends starting in the low tens of thousands ranging up to $140,700 for the average monthly rate for an office space in TriBeCa. Even the big guys with pockets that deep could benefit from a strategic office location, but it’s the employees that have considered sleeping under their desk and small businesses feeling nostalgic about having the headquarters in a “spare” room of the owner’s home that will benefit most from the data in this study.
The chart below shows how residential and commercial property costs compare. The line represents a line of best fit, with an equation of y = .66x + 15.51, where y is our commercial per square foot cost, and x is residential. Prices don’t hit $0 per square foot in this reality. Dots below the line represent areas where commercial real estate is more affordable than commercial. Above the line are areas where residential is more affordable. The presence of data points far from the line indicate that certain neighborhoods are more business than residential and vice-versa.
As a small business with access to nearly 100,000 listings in New York City, RentHop itself has had to consider the options very carefully. An office in a shared space like WeWork starts at $220 per desk for a unreserved desk, going up to $450+/desk for a “private” office space for your business. This might seem like a hefty price, but, consider that most will pay $40-70 per square foot per year for office space in New York with a mean value of about $49, and extremes like Southeastern Queens where it’s around $25 and the Upper West Side where it averages nearly $85 per square foot per year. Considering a load factor (explained wonderfully here) of 15%, and a range of 100-150 square feet per employee, monthly spend can be a wide-ranging $240 to $1,200 per employee. Prices like that make the median rent of $3,600 for a one-bedroom, 700 square foot apartment, seem almost reasonable, but not if I’m paying for both.
So you want to turn your home into your office (or vice-versa)?
First off, you’ll find that a significant portion of your rented space is given up to the load factor referenced above. In a one-bedroom apartment you’ll chalk up the entry way, kitchen and bathroom to that. If you’re lucky enough to have 700 square feet to work with, one could realistically fit three desks in the living room, and if you’re doing a full convert another two or three in the bedroom. We’re certainly not condoning this, and your landlord/property manager may frown upon this, but it’s certainly not unheard of in the high stakes startup culture.
The thought of living in the same environment in which you work may sound miserable to some, but many say that the time saved on commute is well-worth it. If you have a flexible office space in a mixed use building, it’s possible that you can convert extra space into bedrooms, which on average in NYC range from 150-200 square feet, a 15’x10’ to 14’x14’ space is plenty for a queen bed and a dresser or two. Closets might be a challenge, but when are they not?
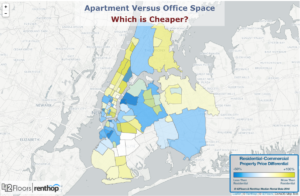
Some neighborhoods are much cheaper for residential and others for commercial space
Assuming all else is equal, the property owner doesn’t mind, and you just want to find some square footage for an office, there are some areas that are considerably cheaper for certain types of property. Using the map below you can find which areas are cheaper for different types of space.
*Areas not shown indicate that either RentHop or 42Floors did not have sufficient rental data in that region to make a confident claim
These 5 neighborhoods have the biggest savings on commercial space
Long Island City – $29.08 /Sqft/ year – 44.8% less than the residential rate ($52.71)
East Harlem – $27.94 /Sqft/ year – 43.8% less than the residential rate ($49.69)
Gowanus – $32.64 /Sqft/ year – 40.4% less than the residential rate ($54.77)
Hunter’s Point – $35.30 /Sqft/ year – 37.5% less than the residential rate ($56.49)
DUMBO – $44.42 /Sqft/ year – 33.2% less than the residential rate ($66.51)
These 5 neighborhoods save the most on residential space
Lower East Side – $46.28 /Sqft/ year – commercial space is 69.7% more ($78.54)
Chinatown – $37.71 /Sqft/ year – commercial space is 69.2% more ($63.81)
Clinton Hill – $42.00 /Sqft/ year – commercial space is 61.5% more ($67.84)
Upper East Side – $48.86 /Sqft/ year – commercial space is 54.7% more ($75.57)
Bedford-Stuyvesant – $37.71 /Sqft/ year – commercial space is 44.1% more ($54.33)
Not interested in living in your office, but still want to save money?
We’re with you, and this data is great for those of you with the flexibility to flip your commute. The reverse commute can be a wonderful thing. Instead of getting on a super crowded train (or sitting in traffic) with everyone else, heading to the most popular office destination, then heading home on another crowded train to the most popular neighborhood to live in, you can enjoy a more comfortable commute, quieter nights and much cheaper rent by living in say, Chinatown, and commuting to DUMBO, both of which have a favorable variation in the residential-commercial square footage differential.
Here’s how we calculated our Residential-Commercial Square footage differential
The median monthly rental price for one-bedroom rental properties was taken from our database of nearly 100,000 listings in New York City, excluding broker fees. 42Floors provided us with median commercial real estate figures for identical regions across New York City. We tested the number for variability, to see how much luxurious or cheap properties were pulling the data, and found that the coefficient of variation (the standard deviation divided by the mean) for both datasets was approximately 33%, (32.7% for commercial and 33.3% for residential) meaning both datasets have a comparable range, moderate variability, and are suitable for comparison.
We found that the average one-bedroom apartment has about 700 square feet, which may seem a bit high, but other sources say it’s even higher, namely a quote from a rival that pops up stating 750 is the average size if one Googles “average square feet of a NYC one-bedroom”. Using our figure, we converted median monthly rent to dollars per square foot per year. We found that despite price variations based on location and type of real estate throughout the city, the average value for a square foot of residential real estate was $47.78 and commercial was $48.86, making it all the more interesting when there was a large variation between types of real estate in the same location. The percentage shown with blue and yellow represents difference in commercial price per square foot over(blue) or under(yellow) the residential rate. Areas not shown indicate that either RentHop or 42Floors did not have sufficient rental data in that region to make a confident claim.
What will you do with all this knowledge?
If you’re a small business owner and you’re looking for office space, you may think more strategically about where you put your desks. Some out of the box (or out of the office) thinking could save your startup some significant coin when it’s needed most. If you’re not ready for that level of devotion, you can still arm yourself with the data to ensure you get a great deal on your next commercial or residential space with 42Floors and RentHop.