Hooray, it’s the holiday season again! While everyone’s love for gifts, candles, and gingerbread cookies increases dramatically around this time of the year, the temperature, sadly, decreases each day as we enter the coldest months. For many people, the best way to celebrate the holidays is to stay at home with their family, drinking wine and watching their favorite holiday movies. Not everyone is as lucky, unfortunately, especially those who rent apartments in the city.
Although required by the NYC Heat Law, some landlords are just too forgetful to turn on the heat, leaving the tenants to face the consequences of their irresponsible actions. Our studies in the past couple of years have shown that certain parts of the city, such as Erasmus (Brooklyn), Mount Hope (the Bronx), and Hamilton Heights (Manhattan) are just not getting the heat they need, despite people’s complaints to 311. As we welcomed the first snow in the city, it is time for us to see which neighborhoods are suffering this winter.
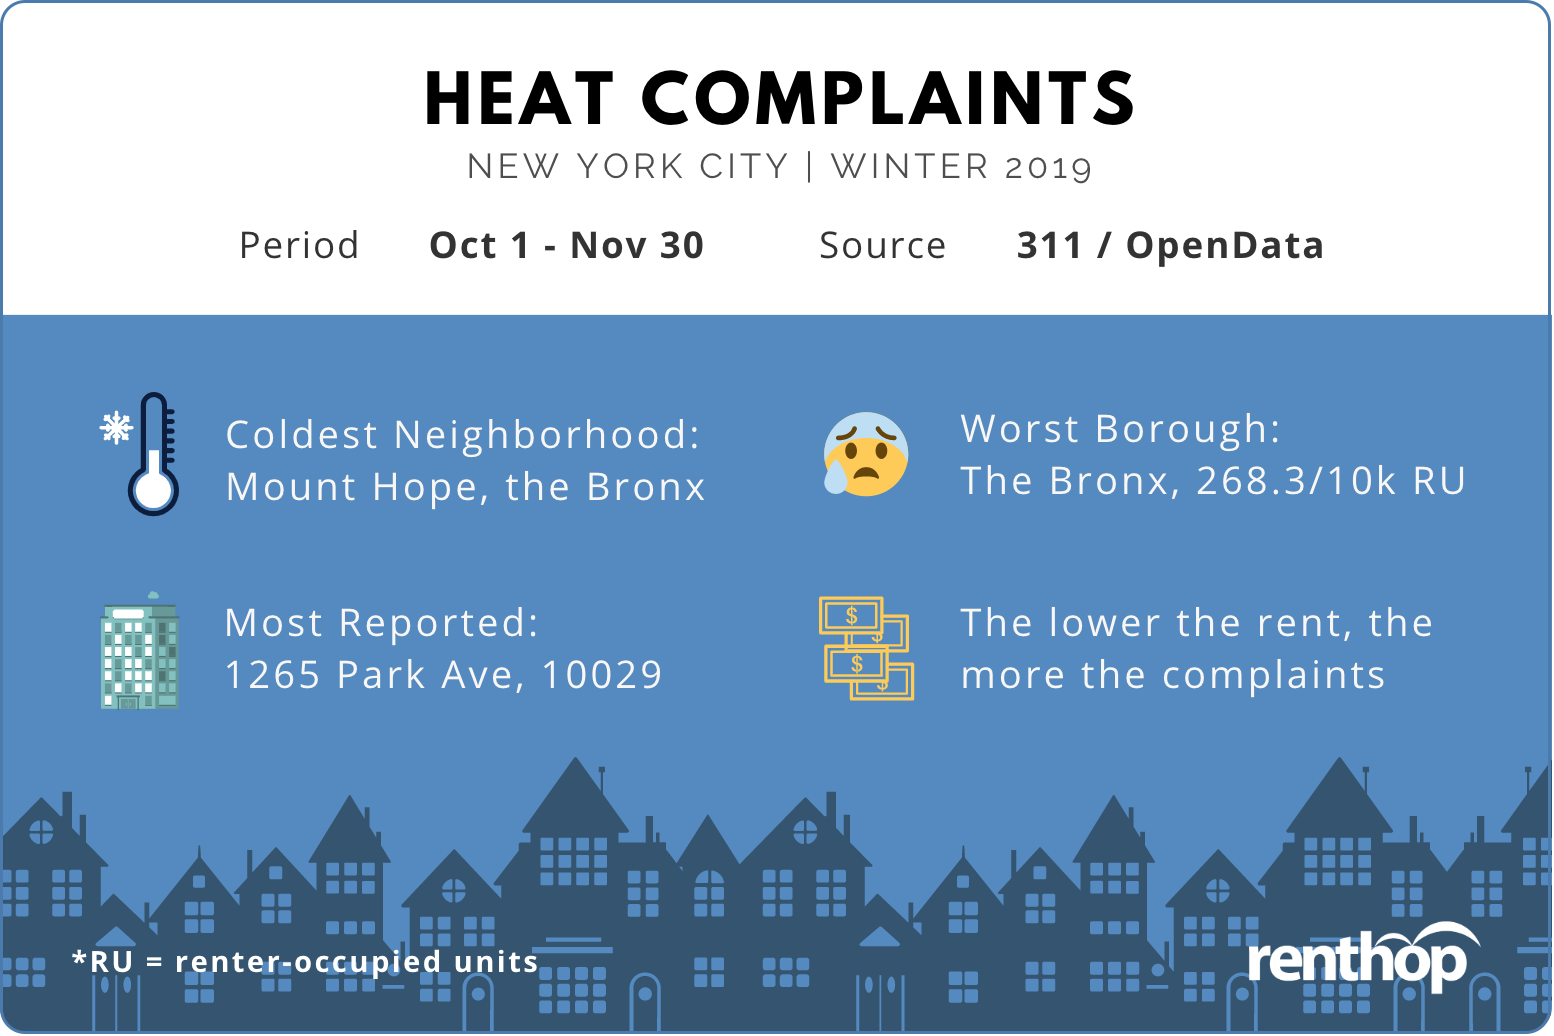
Here are our key findings this winter:
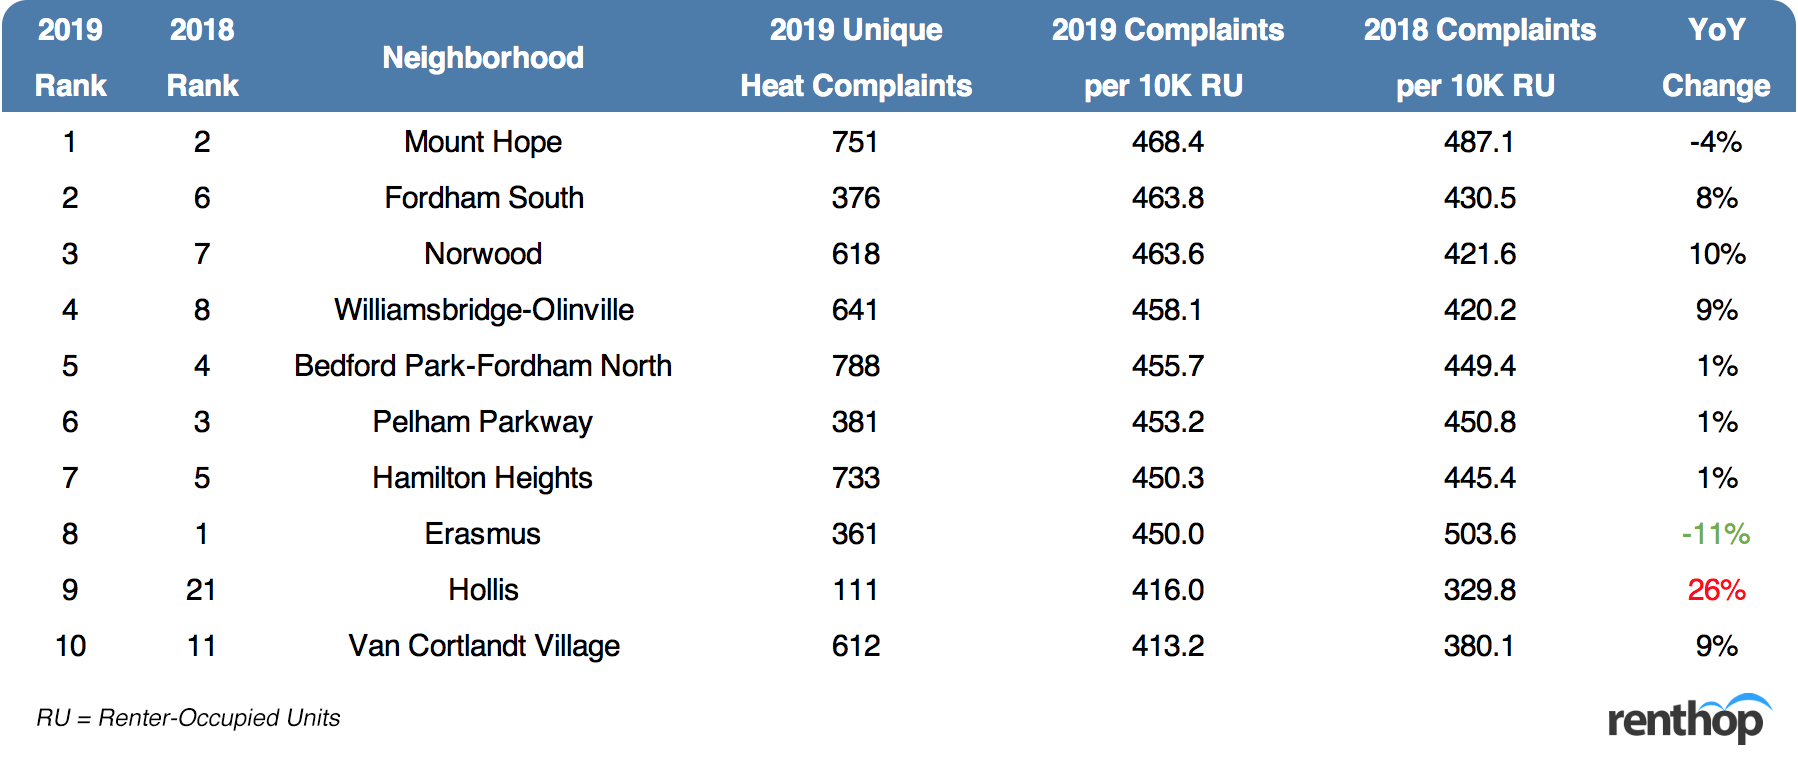
- Mount Hope (fig. 2) in the Bronx has replaced Erasmus as the coldest neighborhood in New York City this winter. From October 1st to November 30th, the neighborhood received 751 unique heat complaints, which translates to 468.4 complaints per 10,000 renter-occupied units. [2019 Heat Complaints Map]
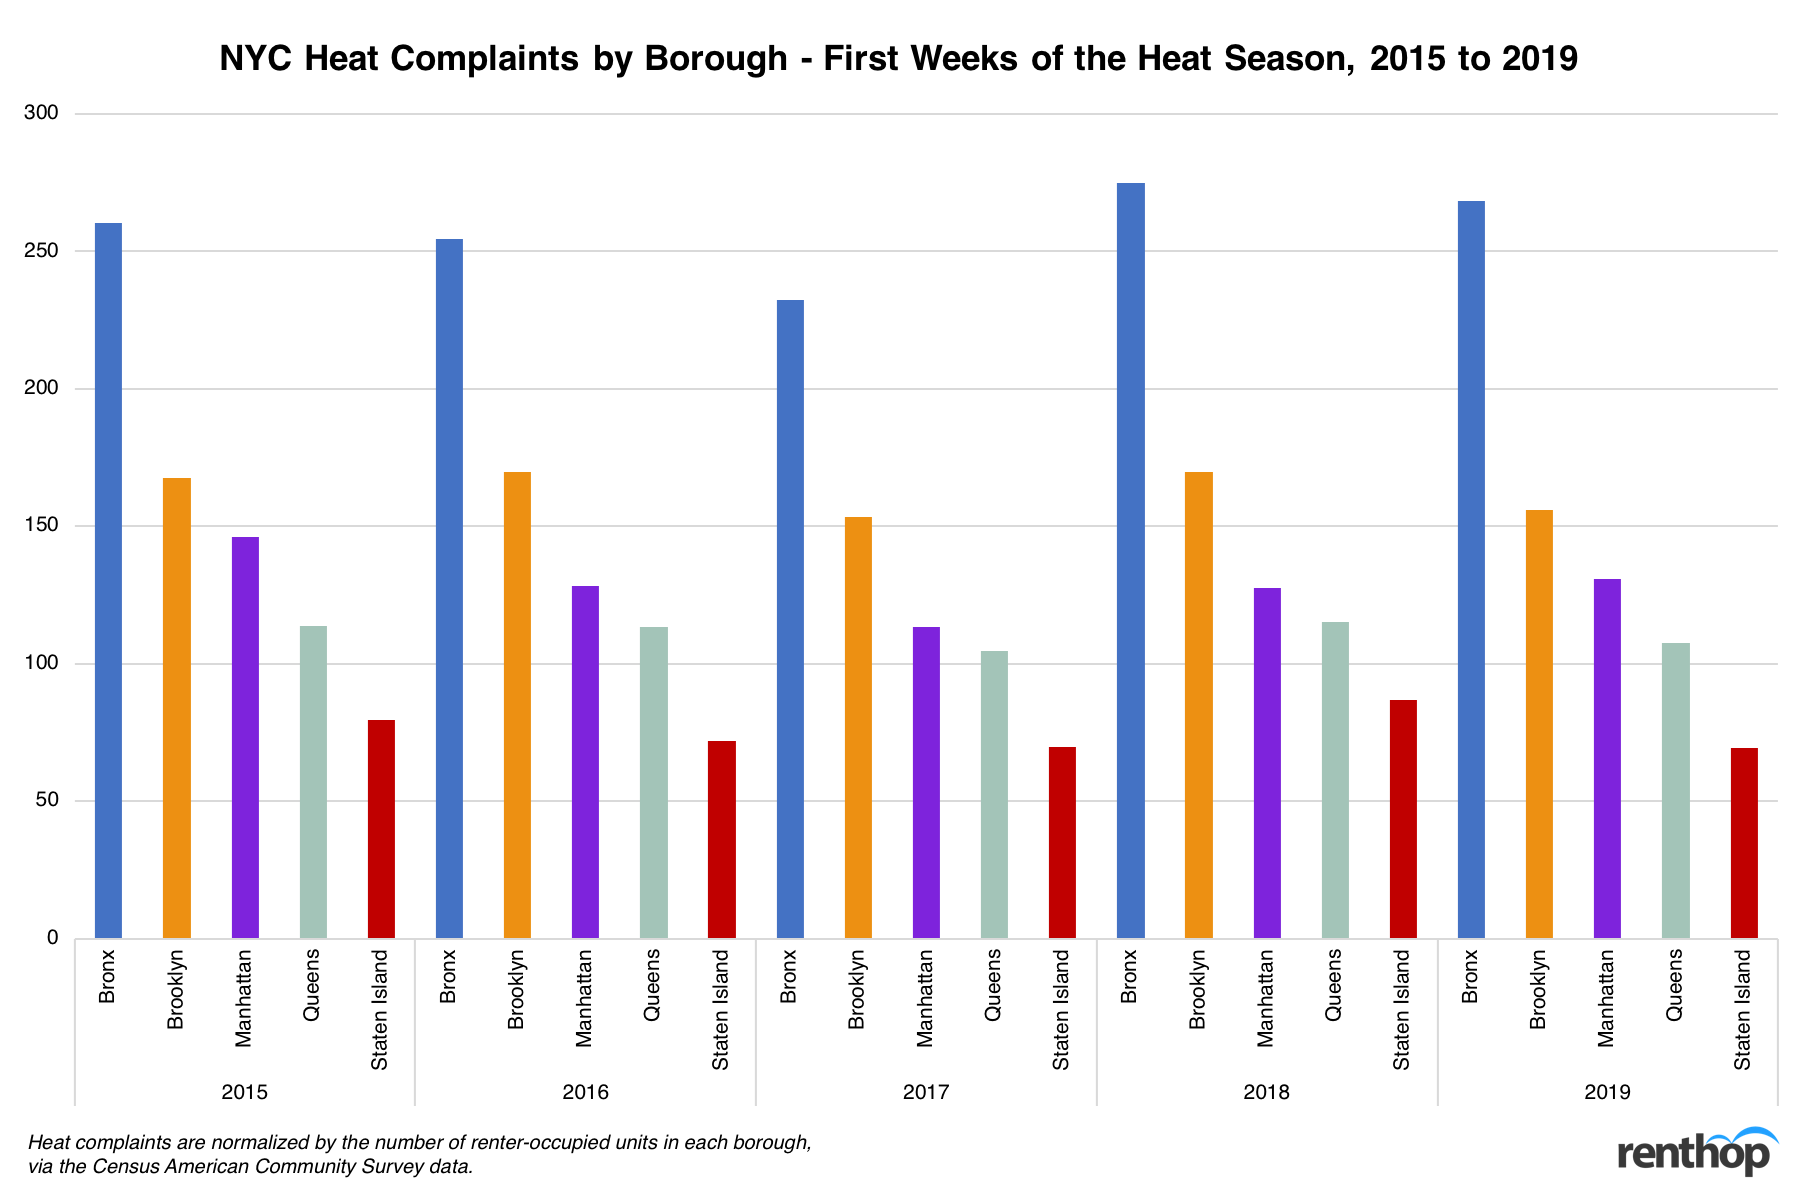
- The Bronx, historically, has been the worst borough when it comes to heat complaints. It has received 72% more normalized complaints than Brooklyn so far this winter. [Figure 1]
- Meanwhile, Manhattan is the only borough where the situation has slightly deteriorated. The borough has received 130.9 heat complaints/10k renter-occupied units in the first two months of the Heat Season, 3% more than in 2018. [Figure 1]
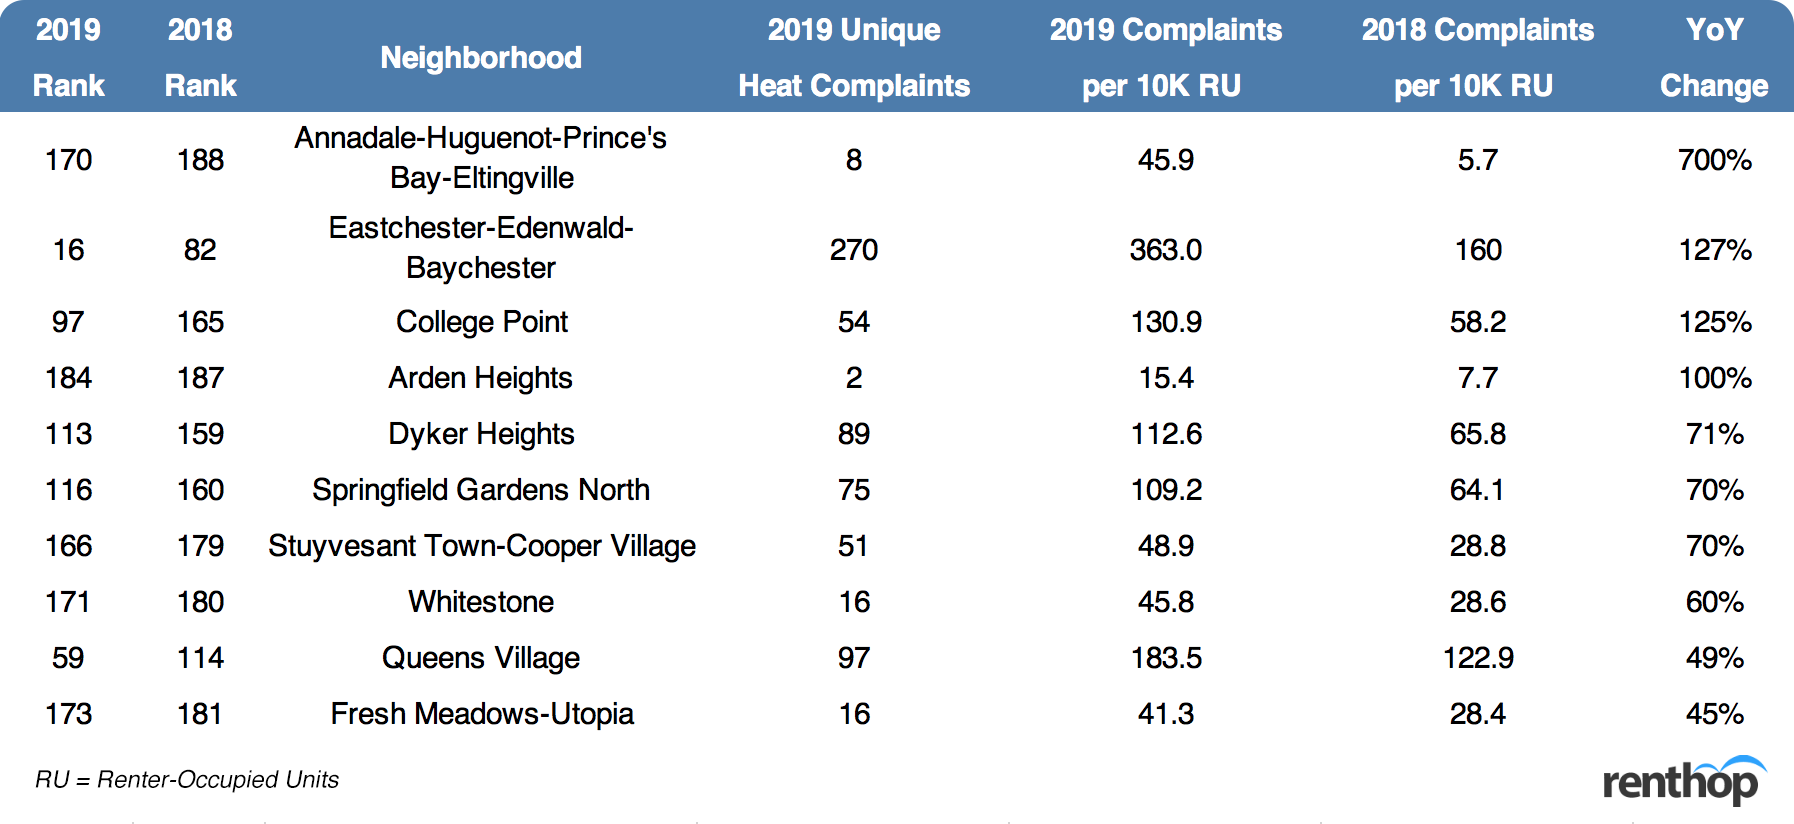
- The number of heat complaints has increased in certian neighborhoods, such as Annadale in Staten Island (YoY +700%), Eastchester-Edenwald-Baychester in the Bronx (YoY +127%), and College Point in Queens (YoY +125%). [Figure 3]
- We also found a negative correlation between rental rates and heat complaints (R = -0.436). Generally, the higher the median 1BR rent, the fewer the heat complaints/10k renter-occupied units. [Figure 4]
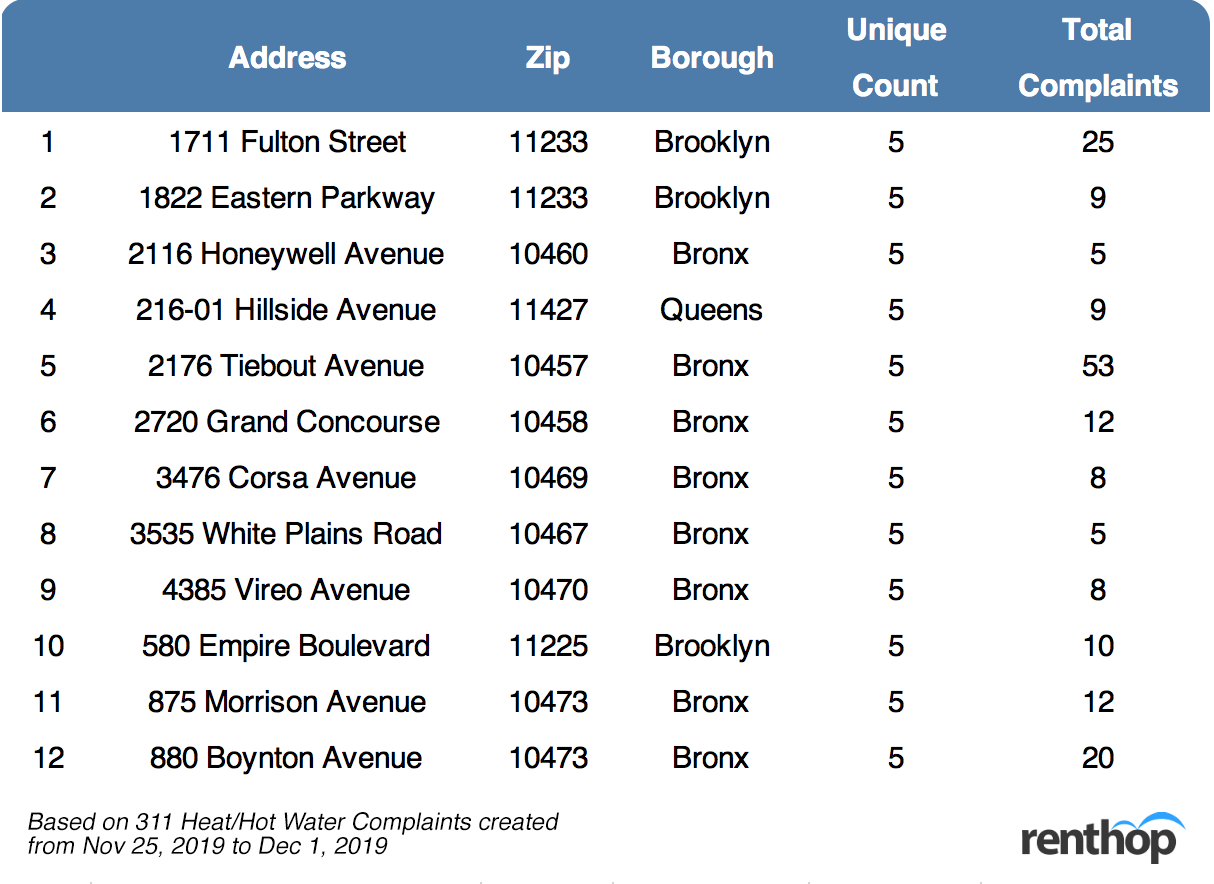
- Of the top 12 reported addresses this past Thanksgiving holiday, 8 of them, or 67% are located in the Bronx. [Figure 5]
- Surprisingly, 1265 Park Avenue in Manhattan has collected the most unique heat complaints this winter. The address received 46 unique complaints from Oct 1st to Nov 30th, 2019, 92% more than last year. [Interactive Table]
- Of the 50 most reported addresses, 44% are in the Bronx, and 28% are in Brooklyn. 8 of them, or 16% are located in Manhattan, whereas only 6 of them are in Queens.
When Does the Heat Season Start?
To begin, let us first touch on what the “Heat Season” entails. In New York City, landlords are required to provide heat for all tenants from October 1st through May 31st. While it is indeed a long period of time, the requirements are pretty low:
- Between 6:00 AM and 10:00 PM, if the outside temperature falls below 55 degrees, the inside temperature is required to be at least 68 degrees F
- Between 10:00 PM and 6:00 AM, if the temperature outside falls below 40 degrees, the inside temperature is required to be at least 55 degrees F
Sadly, not every landlord does a good job. Some addresses have been reported hundreds of times since we entered the Heat Season, such as 89-21 Elmhurst Avenue, 1711 Futon Street, and 72-10 41 Avenue. Surely, when tenants are suffering, they make dozens of complaints each day to 311. We, therefore, grouped the heat/hot water complaints by address and created date. Complaints filed on the same day regarding the same building are considered one unique complaint. From October 1st to November 30th this year, the city has received 37,319 unique heat complaints. While it has slightly improved from last year’s 38,847 during the same time period, it is still very concerning.
311 Heat Complaints by NYC Neighborhood
The map below illustrates the “coldness” of each NYC neighborhood. The darker the shade, the more heat complaints per 10k renter-occupied units a neighborhood has seen this winter. You can click on the neighborhood to learn more.
As we can tell from the shades, generally, landlords in the Bronx and Brooklyn tend to be less responsible compared to landlords in other boroughs. In the Bronx, Mount Hope has replaced Erasmus (Brooklyn) and is now the coldest neighborhood in the Big Apple, with 468.4 unique heat complaints/10k renter-occupied units filed from October 1st to November 30th this year, but Erasmus, which ranks the 8th so far this year, continues to be the coldest neighborhood in Brooklyn. In Manhattan, most landlords in Lower Manhattan have taken care of their tenants, but tenants in Upper Manhattan are less fortunate. While Washington Heights South has received the most unique heat complaints, 1,023 from October 1st to November 30th, Hamilton Heights is in fact the coldest neighborhood in Manhattan, with 450.3 complaints/10k renter-occupied units.
Figure 1 below further illustrates the number of normalized heat complaints by borough in the first weeks of the Heat Season from 2015 to 2019. We can see that, generally, the number of complaints is related to how cold the winter is – the colder the weather, the more complaints are filed to the city’s 311. The Bronx has historically been the worst borough when it comes to heat complaints, 62% worse than Brooklyn in 2018, and 72% this year. Meanwhile, Manhattan is the only borough where the situation has slightly deteriorated. This year, the borough received 130.9 heat complaints/10k renter-occupied units in the first two months of the Heat Season, 3% worse than in 2018.
These are the Coldest Neighborhoods in NYC
Winter is Getting Tougher for Renters in these Neighborhoods
The Higher the Rent, the Fewer the Complaints
In addition to the geographical locations of the heat complaints and proximity to city center, we also took the time to explore the relationship between rental rates and heat complaints.
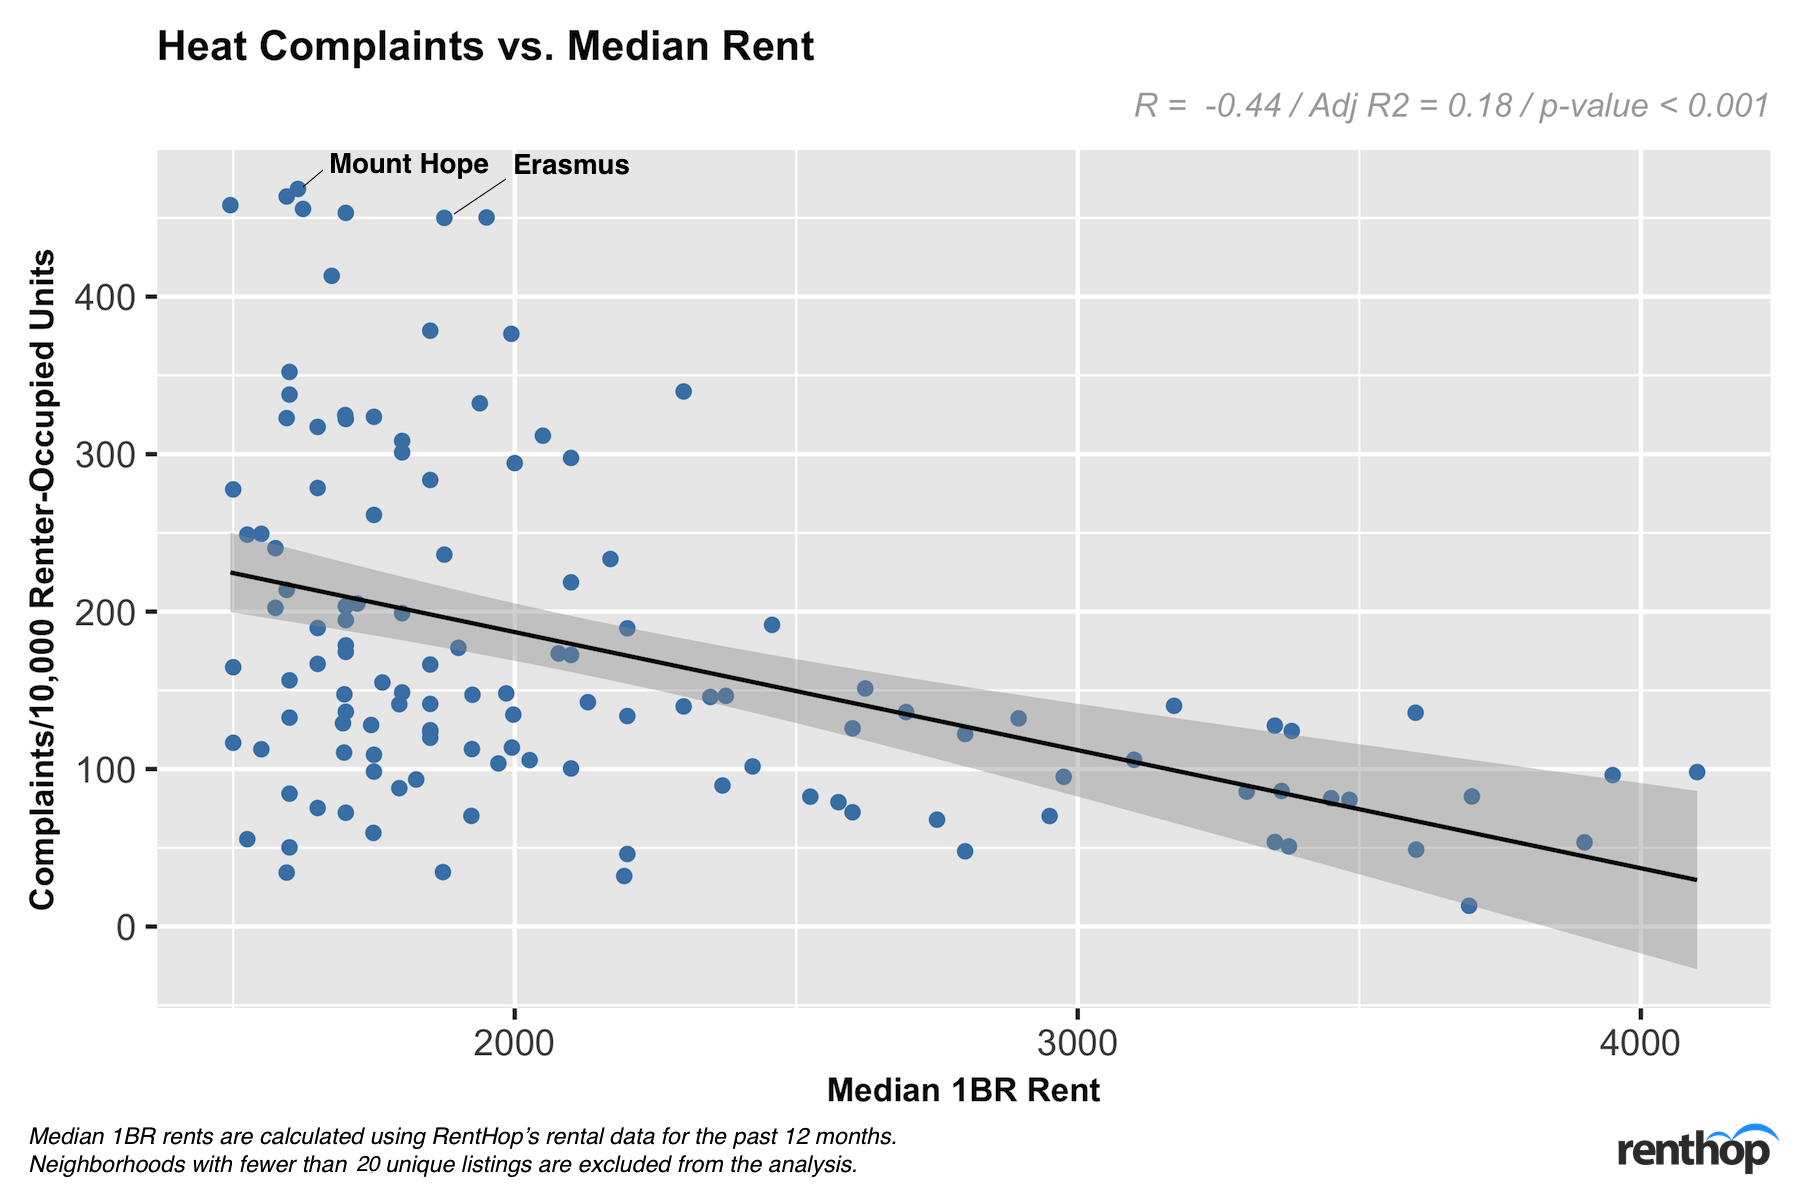
In order to assess the correlation between median 1-bedroom rent and incidence of a heat/hot water complaint, we plotted the two against one another and calculated the correlation coefficient. We found that there is a negative correlation between 2019 median 1-bedroom rent and the number of heat complaints/10k renter-occupied units (-0.436), which states that as rents increase, the observed incidence of heating violation decreases. While we do see some neighborhoods with lower rents and fewer complaints, we don’t see neighborhoods with high rents and high volumes of complaints. To a certain degree, this is not surprising, as landlords charging higher rents tend to have more resources and staffers on their management team.
Tenants at these Addresses Had a Tough Time this Past Thanksgiving
Are you one of the tenants who had to eat your turkey with five layers of blankets over your body? If so, our heart goes out to you. Maybe you’ve tried calling your landlord multiple times. Regardless, be diligent. Repeated calls and texts has helped numerious people get a little warmer. Usually just one call to 311 gets the message to a scroogey landlord that you know your rights.
Beware if You Live or Want to Rent in One of these Buildings
In addition to breaking down the heat complaints by their respective neighborhoods, we thought we’d also take a look at how many times each address has been reported this winter. Don’t want to spend the Christmas calling 311 and freezing at home? Be sure to check out these repeat offenders before signing your lease! You can further explore the data by sorting the data by column or doing a quick search using the search bar.
Methodology
For this study, we looked at all 311 Heat/Hot Water Complaints released by the NYC OpenData Portal. We limited the scope to only complaints created between October 1st and November 30th, as this allowed us to properly compare each neighborhood, borough, and address year over year. Of course, some tenants struggling with cold weather might create multiple complaints within a day. De-duping helps minimize the effect of potentially malicious or very angry residents. We achieved so by grouping together same-day complaints from the same address.
To fairly rank the neighborhoods, we further normalize the data by dividing the number of heat complaints by the number of renter-occupied units in a neighborhood retrieved via the American Community Survey (people owning their home and are cold should settle that dispute with their significant other). The number used when ranking neighborhoods and comparing to median rents represent unique complaints per 10,000 renter-occupied units (RU) in a neighborhood.


