In 2019 Residents Are Still Lacking Heat in the Same Neighborhoods
While the beginning of 2019 hasn’t been as cold as 2018’s bomb cyclone, the 2019 Heat Season has continued to show that certain parts of the city just aren’t getting the heat they need- despite peoples’ complaints to 311. And, despite the 120,780 complaints (83,161 unique) in 2018, this year’s Heat Season is shaping up to be very similar to last year, with the same areas cropping up once more. And, as the frigid cold cropped up this past weekend (single digit degrees in many parts of the city!), this is all the more concerning.
We can’t highlight enough how important this distinction is, as some outlier addresses keep popping up every year. 89-21 Elmhurst Ave tops the list this year once more, having received 1,078 complaints this season, spread across 50 days. This continues last year’s trend, where they clinched the spot with 1,298 complaints– while there are fewer complaints this year, the fact that the same address continues to have spotty heat is incredibly concerning. Surely someone there is really cold, but they’re fuming as they make over 25 complaints per day. That said, it’s not all bad – 1025 Boynton Avenue, which had 574 complaints across 75 days last year (and 430 complaints over 70 days in 2017) has dropped to fewer than 20 complaints this Heat Season. The top complaint list is below (fig. 4 below).
De-duping helps minimize the effect of potentially malicious or very angry residents. By grouping together same-day calls from the same address that is reduced. We further normalize the data when looking at neighborhoods, by dividing by the number of rental units in a neighborhood (people that own their home and are cold should settle that dispute with their significant other). The number used when ranking neighborhoods and comparing to Median rents represent unique complaints per 1,000 rental units in a neighborhood.
With all this in mind, RentHop has analyzed which neighborhoods have the coldest New Yorkers and why. Here are the key findings from the study:
- A strong correlation was found between rent prices and complaints about lack of heat. The ‘Normalized Heat Complaints vs Median Rent’ chart demonstrates this (fig. 1)
- Erasmus, Brooklyn; Mount Hope, Bronx; and Norwood, Bronx were the top 3 complaint neighborhoods, and both Erasmus and Norwood appeared in the top 3 last year as well (fig. 2)
- The Erasmus Neighborhood in Brooklyn again clinches the top spot for the most normalized heat complaints in the 2019 Heat Season.
- A side-by-side geographic comparison shows that the same NYC neighborhoods that were problematic for complaints last year are having issues again this year (fig. 3)
- Nearly half of the addresses receiving the most unique heat complaints this season ranked high last year as well (fig. 4)
- Heat Complaints for the first week of 2019 are down significantly from 2018 although this is likely due to the “bomb cyclone” having occurred in the first week of 2018 (fig. 5)
- 2019 has bucked the trend of increasing heat complaints, suggesting that overall there are fewer heating complaints this season (or that people have given up on calling 311) (fig. 6)
Figure 1
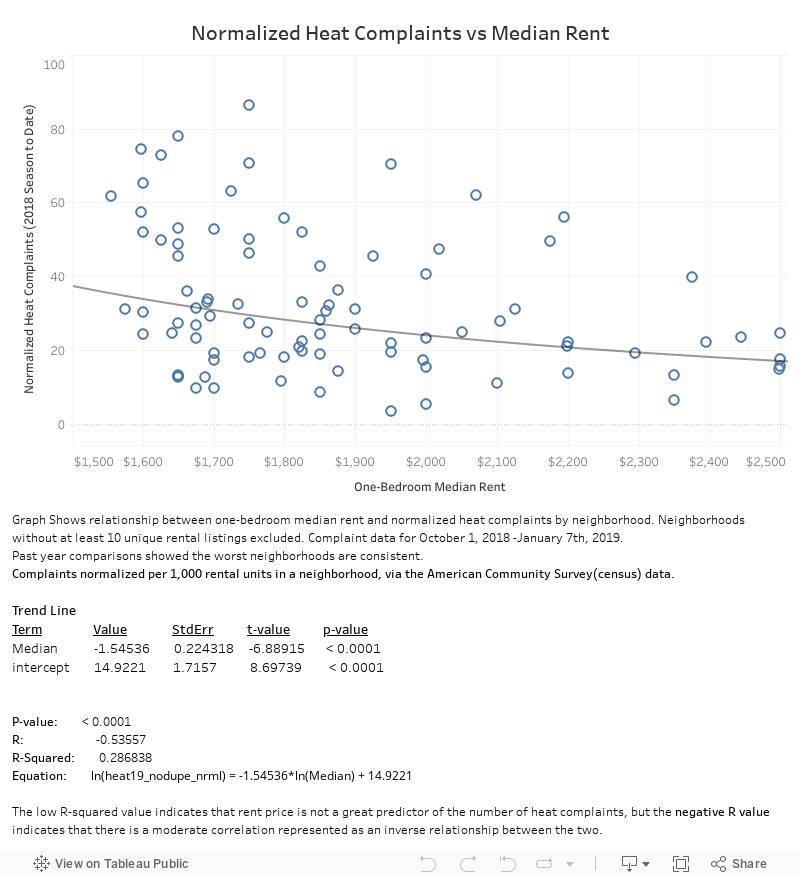
When looking at the graph of heat complaints versus median rent, with median rent as the independent variable, we can see clustering of high numbers of complaints where rents are lower. Complaints are less common as rents rise. While we also see some neighborhoods with both low rents and low complaints, but we don’t see any neighborhoods with high rents and high complaints. Median rent data is for all of 2017 via RentHop’s listing database; heat complaints are unique complaints normalized by the number of rental units in a particular neighborhood, via ACS data.
Figure 2
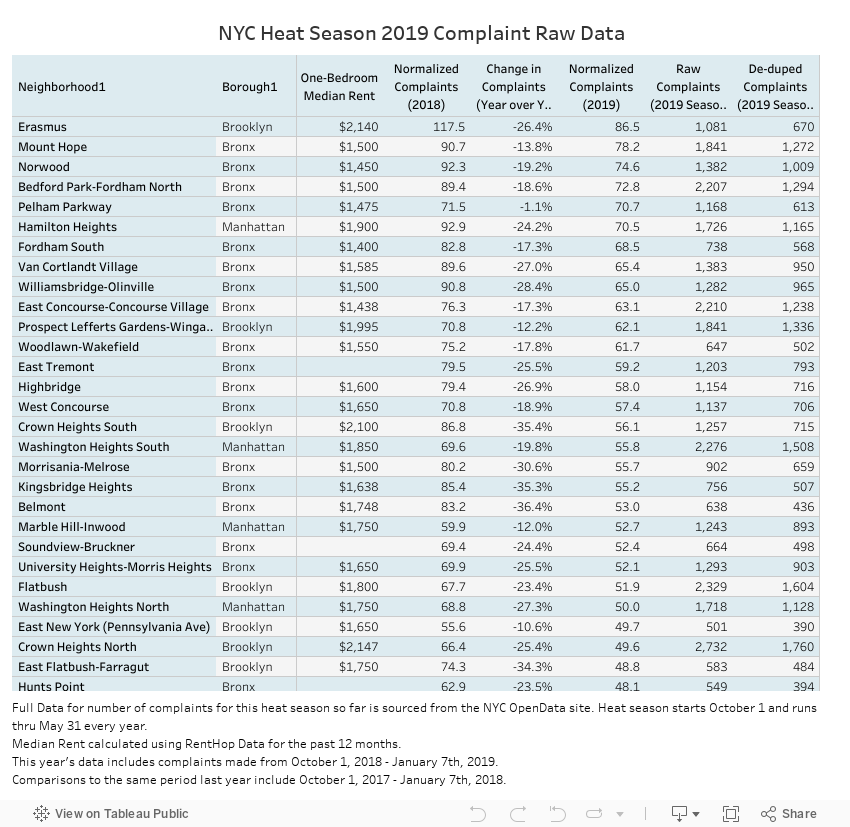
The above table contains the full list of NYC neighborhoods, 2019 one-bedroom median rents, the number of NYC heat complaints (unique, raw, and normalized 2018 & 2019). It’s currently sorted by the normalized number of complaints received through 1/7/2019, but can be re-sorted on any column. When re-sorting by normalized complaints for this period last year, the top 3 names – Erasmus, Mount Hope, and Norwood – stay in the top 5.
For the most part, the 10 neighborhoods with the most freezing New Yorkers are the same as last year but in a slightly different order. Rent in these neighborhoods is also well below the NYC median, which hovers around $3,000 for a one-bedroom. The top 10 neighborhoods all have rents near or below $2,000, save for Erasmus. We can see that these issues are repeated and prevalent over time. Shown geographically next, it is even more clear how things are unfortunately not changing.
Figure 3
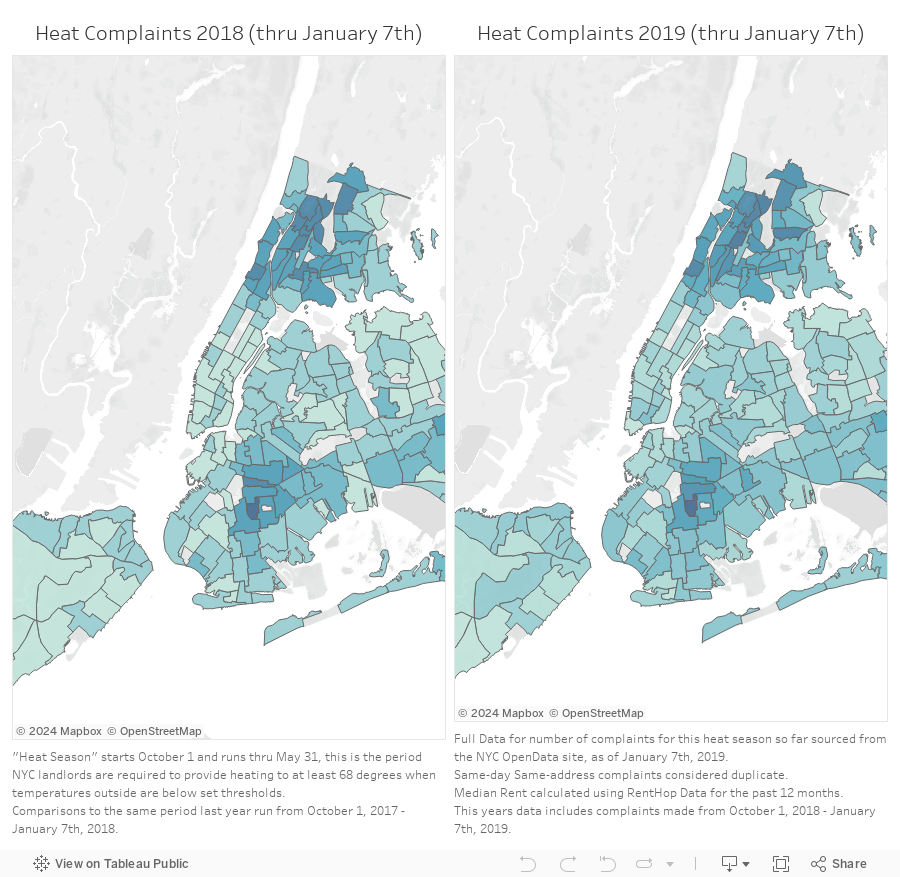
Taking a look at the above maps, it’s hard to discern one from another, which at first prompts a “so-what” or a kind of bored response. This means, however, that same people are suffering that were cold last year. The same landlords in the same areas still aren’t adequately heating their buildings, and the same Department of Housing isn’t doing enough to make sure these people aren’t cold. One can only imagine how the person or persons at these addresses making hundreds of calls must feel. Year-after-year, cold and seemingly screaming into the wind for help.
Figure 4
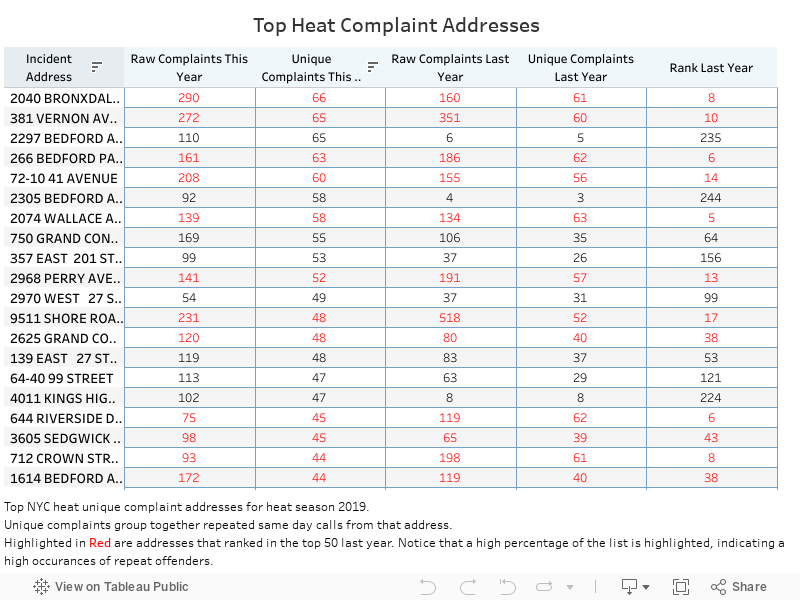
The table above lists the most complained about addresses, ranked by unique complaint count, with raw counts as well. If the address received complaints last year as well, the number of complaints from this same period last year (October 1 – January 7th) as well as their rank last year is displayed. Any address that also ranked in the top 50 last year is highlighted in red. A significant portion of the list appeared in the top 50 last year too.
The prevalence of repeat offenders is quite disconcerting. It’s certainly possible that there are people that have it out for their landlords, but this many repeat names likely means that things aren’t being fixed and the same people that suffered last year are again this year.
Figure 5
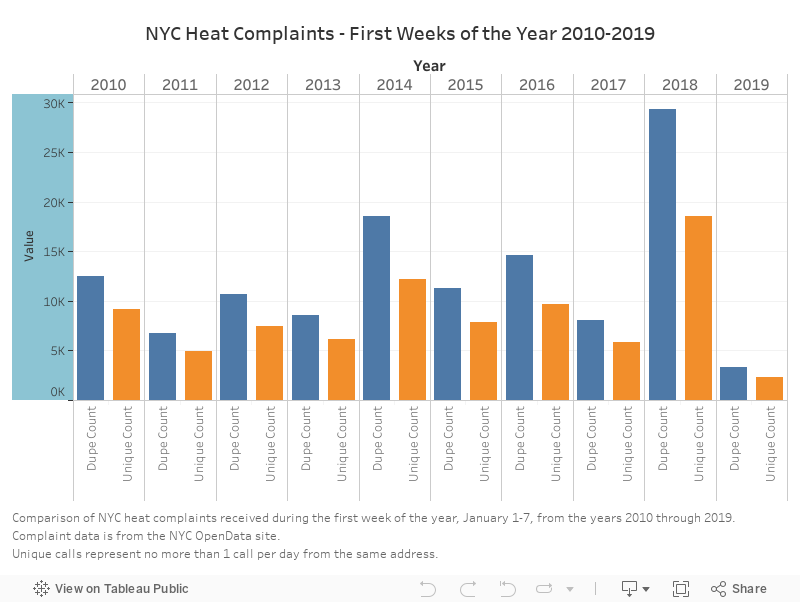
The chart above shows how bad last week really was, compared to other first weeks in the last 9 years. And, by all accounts, the first week of 2019 was quite mild compared to last year’s “bomb cyclone.”
How does the NYC “Heat Season” work?
From October 1st through May 31 landlords are required to provide heat for all tenants. The requirements are pretty low:
- Between 6:00 AM and 10:00 PM, if the outside temperature falls below 55 degrees, the inside temperature is required to be at least 68 degrees F
- Between 10:00 PM and 6:00 AM, if the temperature outside falls below 40 degrees, the inside temperature is required to be at least 55 degrees F
Figure 6
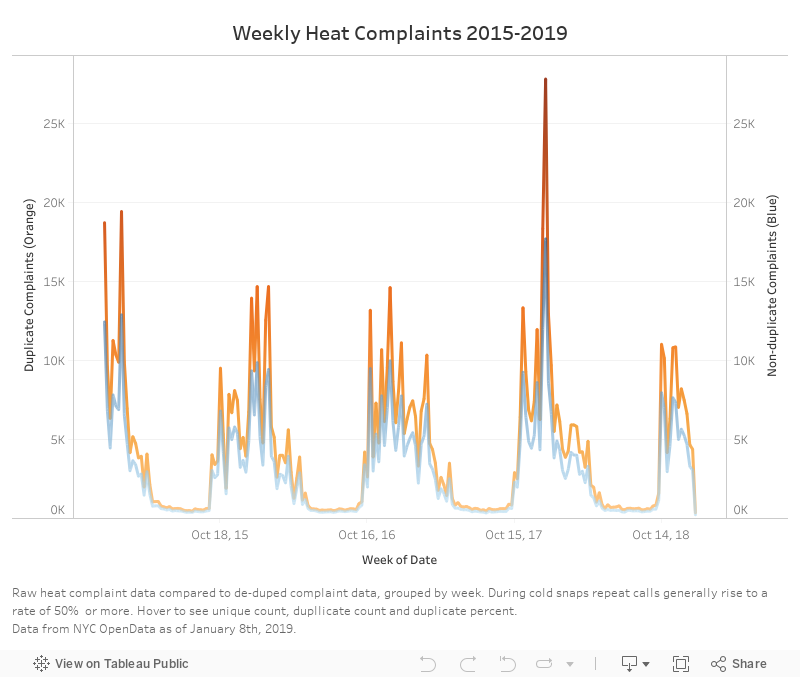
Looking back at the past 4 years of complaints grouped by week, we can see that, with the exception last year, complaints have been fairly evenly distributed across the heat season, with a distinct ramp-up and ramp-down at the beginning and the end of the season.
What can I do if I think my apartment isn’t being adequately heated?
If you find that your heat isn’t meeting the low minimum requirements, you should first reach out to your landlord. Certified Mail is recommended if it’s an ongoing issue, but I’ve found that text also helps keep a record of the issue and sometimes false promises. If this doesn’t work, calling 311 or visiting the online portal for creating complaints, allows you to make complaints, anonymously if you wish. An inspector from the NYC HPD will come to check the building for violations, usually within a few days, but from the looks of things, they may be backed up.
Regardless, be diligent. Repeated calls and texts to my own landlord has helped me get a little warmer. Usually just one call to 311 gets the message to a scroogey landlord that you know your rights.
Moving into a new place?
Use the NYC Housing Preservation & Developments’s tool to check the address of the building for past and open violations.


