Best Metro for Each Job
Congratulations, all new graduates! If you are one of those who just graduated from college or will be, these are exciting times! You no longer have tons of papers to finish, reading material to complete, waking up at the crack of dawn to attend a lecture, and most importantly: no more student loans! However, you now have some other, new daunting tasks in front of you, and that is getting a job, and for a lot of people that require relocation as well. Did you know that for some occupation fields, you might be able to get a higher annual salary than compared to other metros? Our dedicated research team here at RentHop took on the task of finding which metro you could potentially get paid the most and least based on your occupation field!
Metro Profiles
Before jumping into each occupation, let us first take a look at each of the top 50 metro areas in the U.S. After all, population growth and macroeconomic trends have a huge impact on your future career. The interactive map below outlines each metro’s population count and growth, employment growth, current unemployment rate, median income, the average time to work, and one-bedroom median rent, which is calculated using RentHop’s proprietary data.
Of all metros included in this study, the Austin metro area has seen a population growth of 25.5% in the past 10 years! Pittsburgh, PA, on the other hand, has experienced negative population growth. The total population has gone down to 2.3 million, or by 1.4%. In terms of employment growth, while all metros have experienced positive growth in the past year, thanks to the booming U.S. economy, the Orlando metro saw the most robust growth of 3.5%. Virginia Beach, meanwhile, saw only 0.2% growth from April 2018 to April 2019.
Where You Should Live if Your Goal is to Make the Most Money
For this study, we took a deeper look into 12 different major occupation fields that will most likely require a bachelor’s degree or higher and the annual income by occupation field at a metro level. To make sure that we take employment opportunities into consideration, we included only occupations with a location quotient above 1. Location Quotients quantify how concentrated industry or occupation is in a region compared to the nation. As measured by BLS, the location quotients show the occupation’s share of an area’s employment relative to the national average. Therefore, if an occupation has a location quotient above 1, it indicates that the occupation employs more people within that metro area relative to the U.S. and that people will more likely find a job related to that occupation field. See table below for the metros with the highest annual salary in each occupation field.
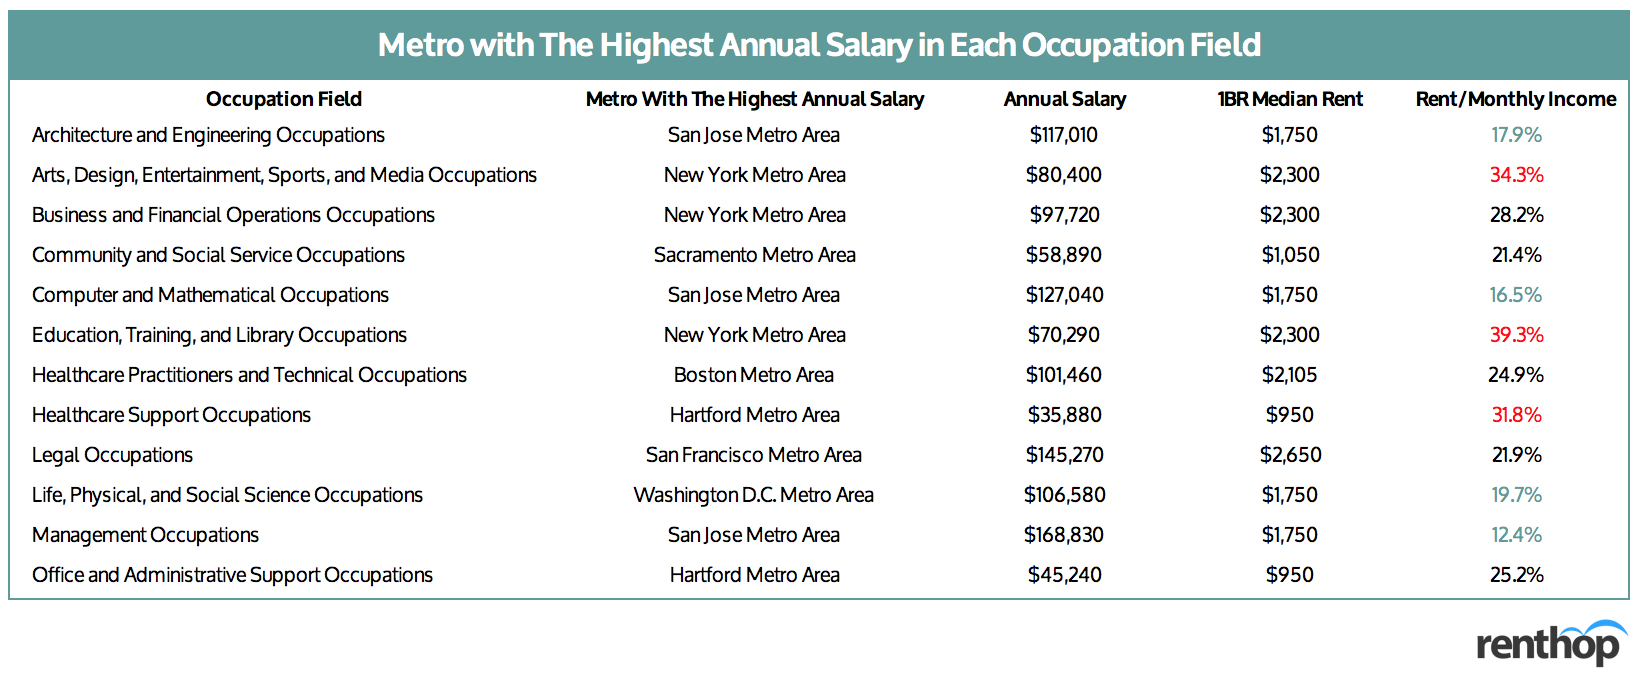
The table above is sorted alphabetically and gives an idea of where you should move if you are looking to move to an area where the job market is good in terms of job availability and annual salary. For those educated within the field of Architecture and Engineering, we see that the San Jose-Sunnyvale-Santa Clara, CA metro has the highest annual salary of $117,010. For those looking for jobs in Life, Physical, and Social Science, you might want to move to the Washington D.C. metro. Management Occupations enjoy the highest pay on this list. Of all metros, people in the management occupations in San Jose-Sunnyvale-Santa Clara receive an annual salary of $168,830.
Before you make up your mind, however, be sure to take into account the cost of living. While fashion designers, graphic designers, and media professionals make the most in the New York metro, the cost of living is so high that they will have to spend around 34% of their monthly income on rent to afford a one-bedroom apartment. Sounds scary, doesn’t it? That does not mean, however, that you have to spend more than a third of your income on rent. You can always find roommates to share an apartment with. In fact, across the US, one can expect to save on average 40% off their monthly rent by sharing a two-bedroom versus having a one-bedroom alone.
Where You Shouldn’t Live if Your Goal is to Make the Most Money
We also took a look at the occupation fields that would be paying the least, annually, and in which metro area. If your plan is to make as much money as possible, relocating to one of the following areas might not be the best option. See table below for the metros with the lowest annual salary in each occupation.
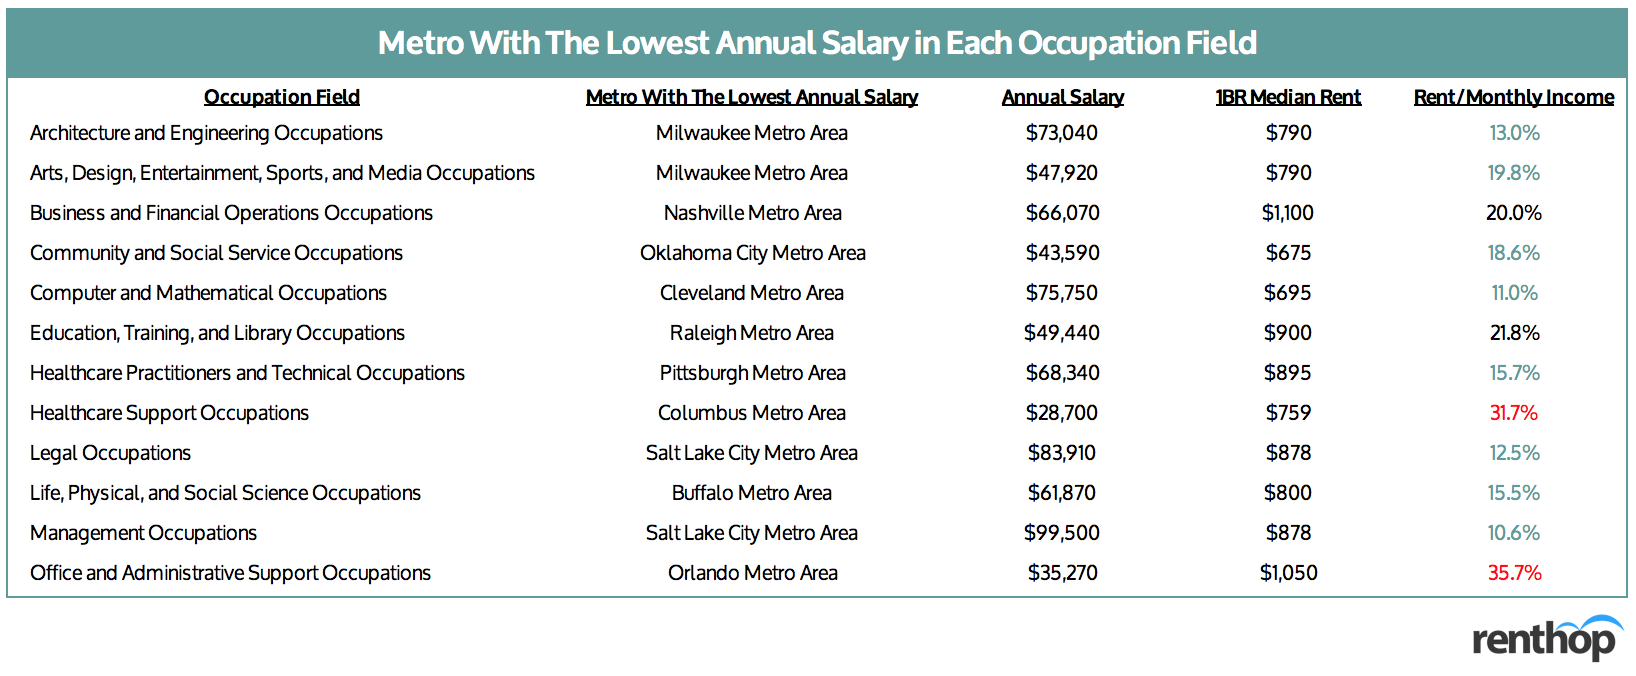
Again we see that the table above is sorted alphabetically and is meant to give an idea of which area has the lowest annual salary based on each occupation field. From the table above, we see that the Columbus, OH metro has the lowest annual salary for the Healthcare Support occupations, with an annual salary of $28,700 and rent/income ratio of 31.7%, and that does not include taxes, food, insurance, etc. If you are looking for a job in Office and Administrative Support, you might want to skip the Orlando-Kissimmee-Sanford metro, as on average around 36% of your annual income will go towards rent. Want to become a teacher? Make sure you don’t move to the Raleigh, NC metro area.
While the rent/income ratios in the table above are generally lower, lower rent does not always equal to more savings. Since most of these metros don’t have a convenient public transportation system, you will probably need a car, and that, after including the cost of gas, car insurance, maintenance, etc., translates into hundreds of dollars per month on top of your rent.
Occupation Fields by Metro
To give you a better sense of the labor market in each metro, we have compiled the interactive table below. The table includes all 12 occupation fields by metro, along with average annual income, location quotient, median rent, and rent/income ratio. You can sort by column or do a quick search using the search bar.
Methodology
This occupation study analyzed occupational employment data released by the Bureau of Labor Statistics at a metro level to give recent graduates a better sense of the labor market in the U.S. The study included 12 major occupation categories that will most likely require a bachelor’s degree or higher, and ranked them by the average annual income across the top 50 U.S. metro areas (based on the population size from the American Community Survey by the Census Bureau). Using our proprietary rental database, we at RentHop calculated the one-bedroom median rent across these 50 U.S. metro areas. In general, the higher the rent, the more expensive it is to live in a metro.
Full Dataset
The interactive table below includes all occupations under the 12 occupation categories, along with the highest- and lowest-paying metros, average annual income, and median rent. You can sort by column or do a quick search using the search bar.


