Chicago has been considered a dangerous city in many respects since as early as the 1960s and, in many years, has been considered the “murder capital” of the United States. With attention focused on shootings and gun crimes in Chicago, RentHop’s data science team has taken a look at violent crime in the city to gather insights about how one can evaluate neighborhoods in the context of violent crime.
Key Findings:
-
- Forest Glen was identified as being the safest neighborhood, with only 0.0027 violent crimes per capita in 2018.
- Conversely, West Garfield Park was identified as being the least safe neighborhood, with 0.0701 violent crimes per capita in 2018.
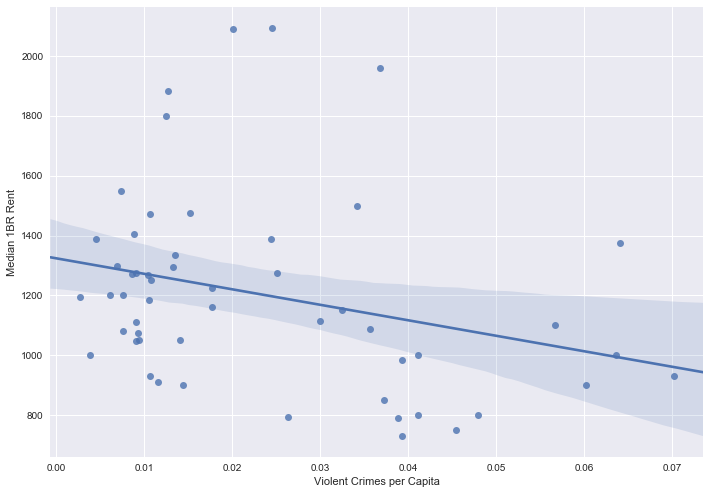
- There is a slight negative correlation between median 1-bedroom rent prices and violent crime (-0.286). As such, as rents increase, observed incidence of violent crime decreases. Despite this slight negative correlation, however, the notion that correlation does not imply causation remains.
- The Loop, despite having high rents, has a fairly high incidence of violent crime in 2018. Though median 1-bedroom rents hover slightly above $1,950 per month, violent crime in 2018 clocked in at 0.0367 per capita.
- The most commonly reported violent crime in 2018 was battery, representing roughly 61% (28,130 of 46,076) of violent crimes reported in 2018.
The map below shows violent crime in 2018 along with neighborhood statistics like population and median 1-bedroom rent:
By clicking on any of the community areas highlighted in green (with shades of green varying by the median 1-bedroom rent), you can see statistics for a given neighborhood like the community area’s population, its median 1-bedroom rent, the number of reported violent crimes, and the violent crimes reported per capita. Note, that these statistics include crimes that were reported even if no arrests were made.
Furthermore, as you click on the map’s clustered circles, you can zoom further into neighborhoods to see instances where violent crimes have occurred, down to specific blocks and locations. Note that the specific crimes on the map only include those that have an arrest associated with them, whereas the aggregate statistics by neighborhood include all reported crimes (irrespective of whether or not an arrest was made).
You can also look at individual neighborhoods using the following data table:
Note that you can sort on any of the fields by clicking the header column.
Methodology
To make the map above, we pulled data from Chicago’s open data portal, pulling the trailing 12 months of data, made public by the Chicago Police Department’s CLEAR (Citizen Law Enforcement Analysis and Reporting) system. Then, to normalize the data, we pulled population data from community data snapshots provided by the Illinois government.
We limited the scope of our analysis to violent crimes, which include robbery, assault, battery, criminal sexual assault, and homicide, and we only used data for the 2018 calendar year (e.g. January 2018 onwards). For median 1-bedroom rental prices, we used RentHop’s proprietary rental data over the 2018 year-to-date, focusing on community areas where we had sufficient rental data.
In order to assess the correlation between median 1-bedroom rental prices and incidence of violent crime, we plotted the two against one another and calculated the correlation coefficient. There is a slight negative correlation between median 1-bedroom rent prices and violent crime (-0.286), which states that as rents increase, observed incidence of violent crime decreases. Despite this slight negative correlation, however, the notion that correlation does not imply causation remains. As is evidenced by certain neighborhoods with high rents still having high incidence of violent crime (e.g. The Loop), higher housing prices do not necessarily mean that a neighborhood will be safer.
What does this mean for you?
While there’s no escaping violent crime in any city, let alone in Chicago, having insight into where said crimes occur is an important data point in your apartment search. This combined with moving further away from downtown, or adding some more time to your daily L commute can be an important consideration when thinking about an apartment.


