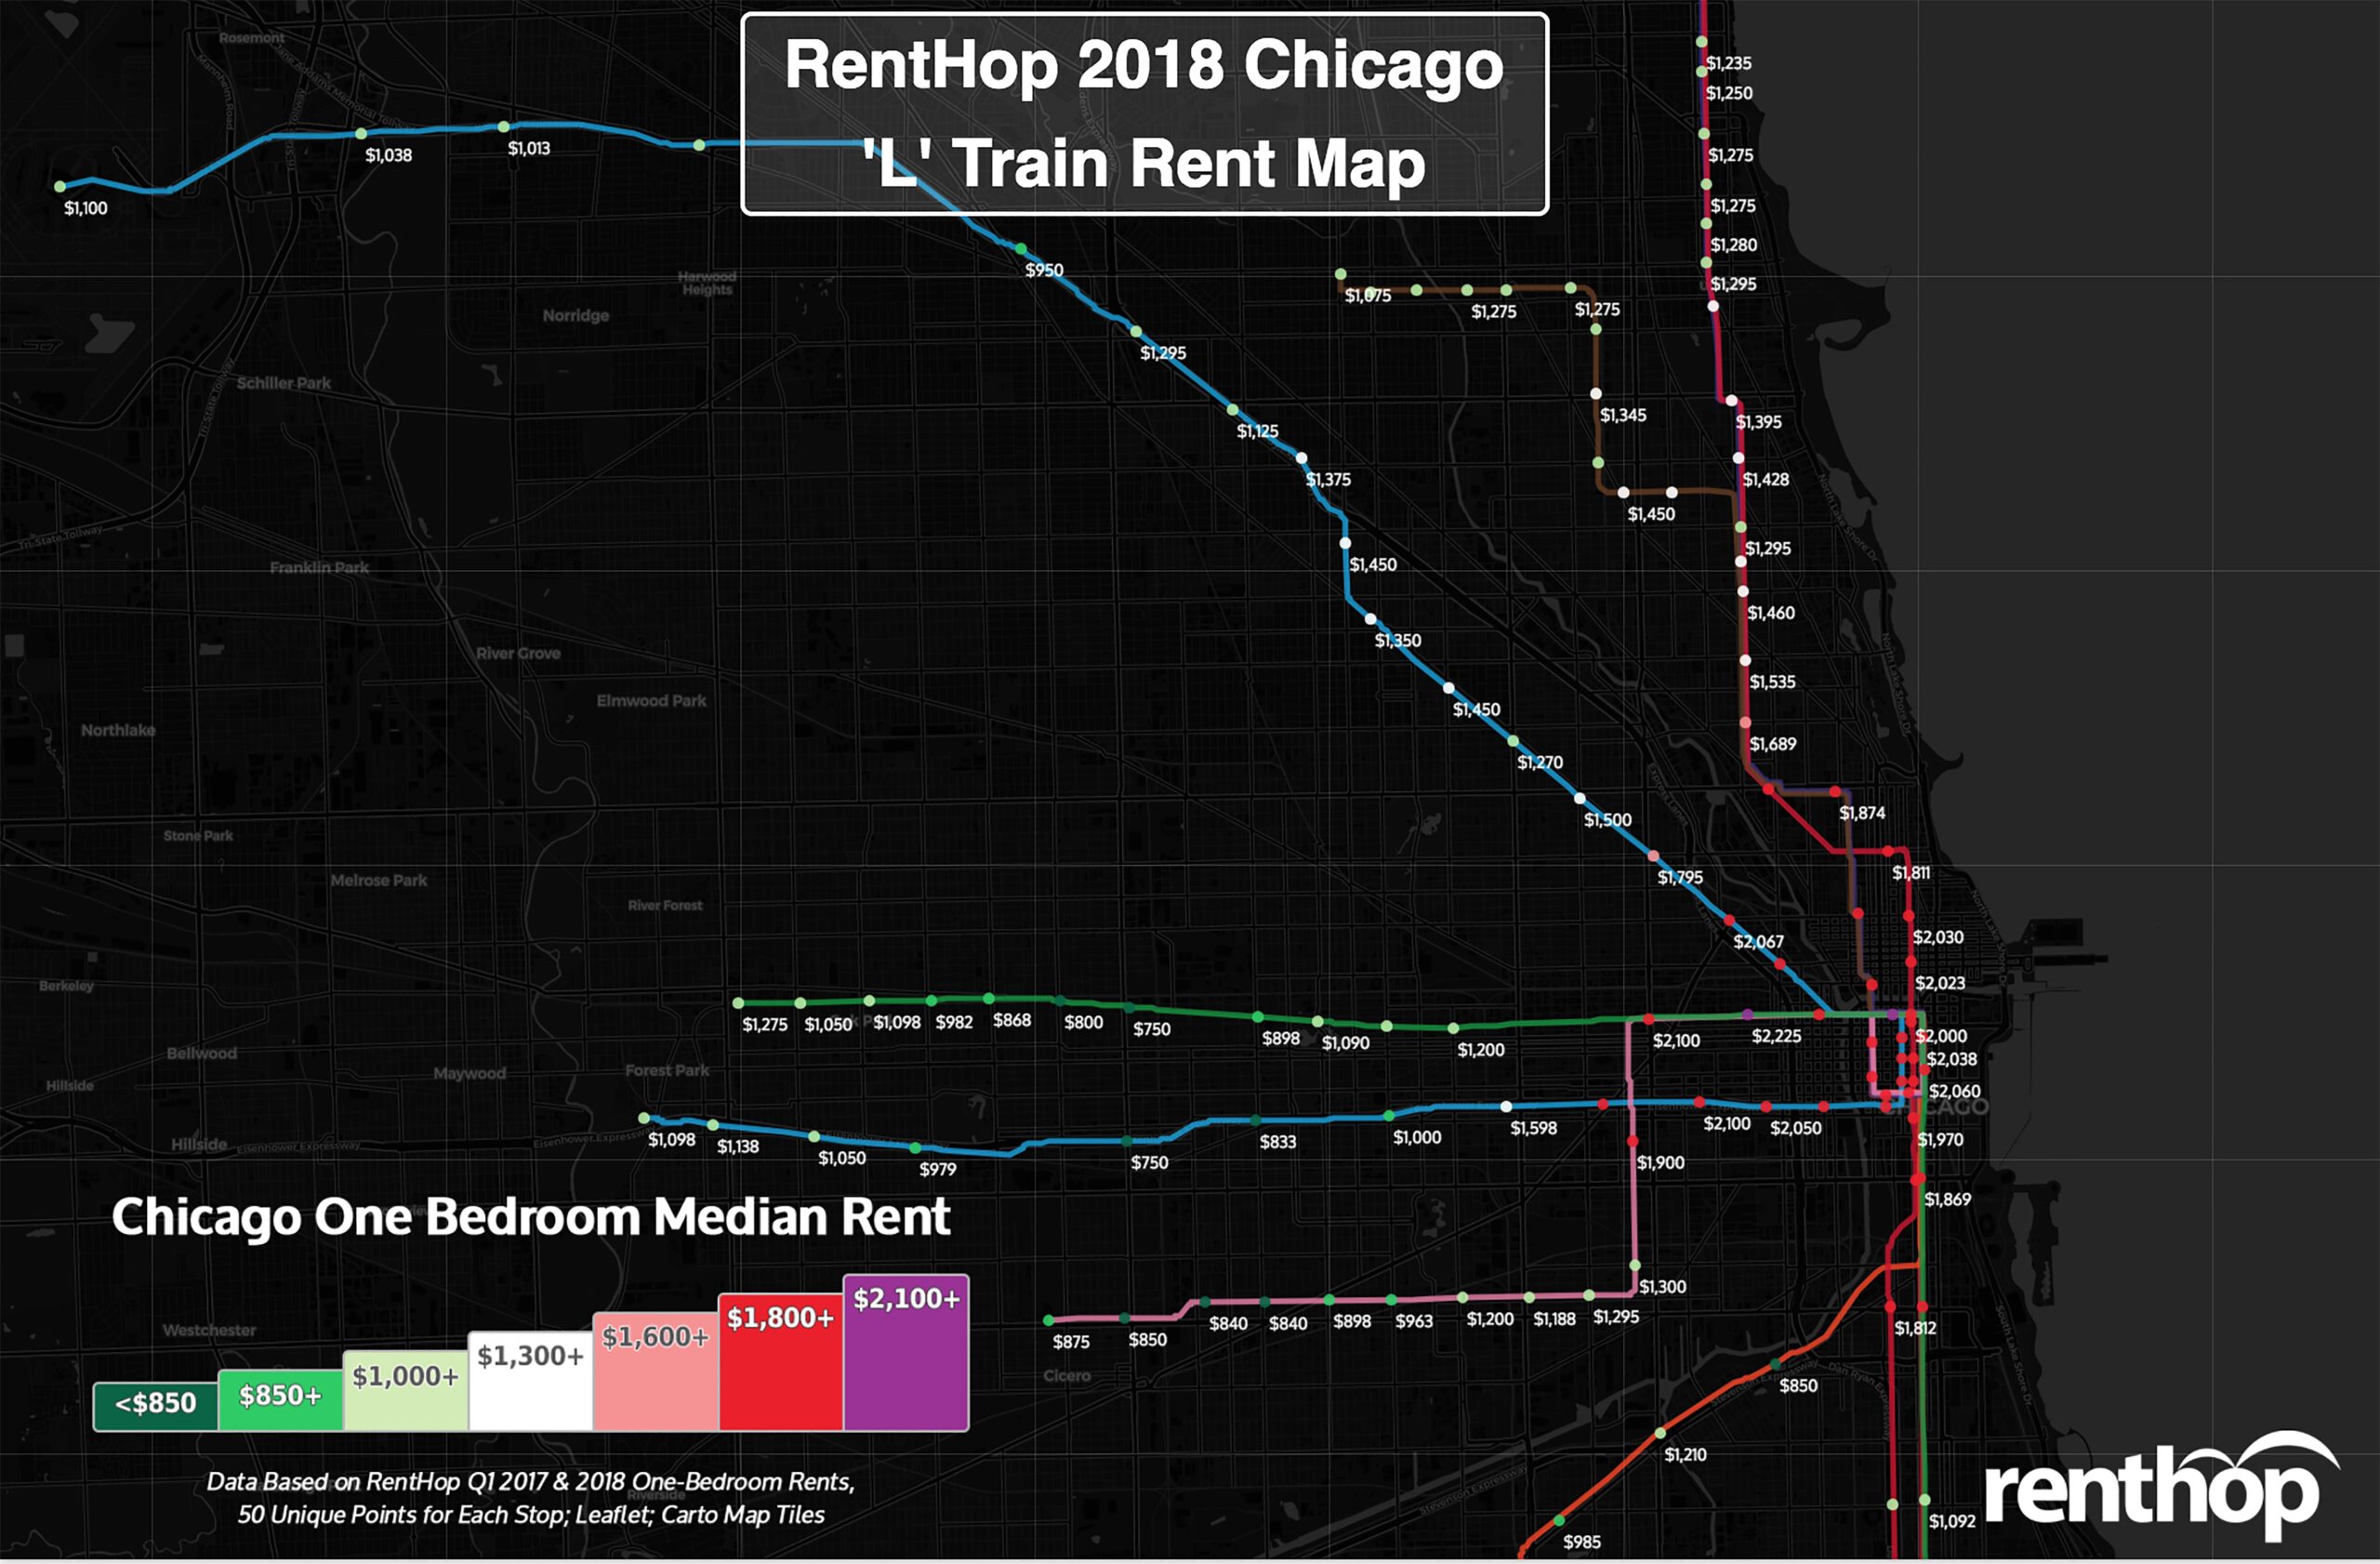
The Chicago “L” is the fourth largest heavy rail rapid transit system in the U.S. As an essential part of most Chicagoans’ lives, the L system, on average, served 740,000 riders each weekday in 2017. We at RentHop, therefore, believe that it is our duty to map out the rental data by the L train stop every year to assist in your apartment hunting endeavors.
Some highlights from our study this year include:
- Median rents in Downtown Chicago dropped slightly over the past year. Several stops experienced negative rent growth, including Washington – Blue Line ($2,037/YoY -15.4%), State/Lake – Brown, Green, Orange, Pink & Purple Lines ($2,000/YoY -11.3%), and Clark/Lake – Blue, Brown, Green, Orange, Purple & Pink Lines ($2,234/YoY -10.1%).
- Renters can save $600 by traveling one stop south from Polk – Pink Line ($1,900) to 18th Street – Pink Line ($1,300).
- Renovated/rehab units pushed up the median rents along the Pink Line. Specifically, median rents at Western, Kedzie, Central Park, and Cicero all went up over 10% the past year.
***
In order to calculate the median rent for the map below, we used the RentHop rental data for one-bedroom apartments from January to April 2018 and GIS data for subway stops from data.cityofchicago.org. To get accurate prices near the L train stops, we looked first at non-duplicated listings within 0.62 mile of an L train stop. We then calculated the median rent if there were at least 50 unique data points. If not, the radius from the L train stop was increased to 1.24 miles and the data was resampled to ensure enough unique listings were used when calculating the median.
The Interactive Map Below Shows Chicago Rents by L Train Stop
You can use the interactive map to see the current one bedroom rent prices as well as how prices have changed since last year. You can also scroll down for an easy-to-share version of this map.
Similar to last year, this year we have seen a variety of rising and falling rental prices across Chicago. Overall, the rental prices for one-bedroom apartments went down in Chicago, coinciding with the rising housing supply. Specifically, in Downtown Chicago, over 4000 apartment units were built in 2017, and several stops in downtown experienced negative rent growth, including Washington – Blue Line ($2,037/YoY -15.4%), State/Lake – Brown, Green, Orange, Pink & Purple Lines ($2,000/YoY -11.3%), and Clark/Lake – Blue, Brown, Green, Orange, Purple & Pink Lines ($2,234/YoY -10.1%). Renovated units also contributed to the rent growth at certain stops, such as Western – Pink Line ($1,188, YoY 13.1%).
These Stops Have Seen Rent Increase
- Damen – Pink Line: $1,295, YoY 18.7%
- Halsted – Orange Line: $850, YoY 17.2%
- 95th/Dan Ryan – Green Line: $850, YoY 14.1%. This potentially is related to the terminal renovation project that brought over 700 jobs and local economic opportunities to the South Side.
- Western – Blue Line – Forest Park Branch: $1,598, YoY 14.5%
- LaSalle/Van Buren – Brown, Orange, Purple & Pink Lines: $2,029, YoY 14.0%
These Stops Have Seen Rent Decrease
- Harlem/Lake – Green Line: $1,275, YoY – 16.3%
- Sedgwick (Brown & Purple Lines): $1,874, YoY -15.4%
- Washington – Blue Line: $2,037, YoY -15.4%
- 63rd Street – Red Line: $823, YoY -12.5%
- Washington/Wells – Brown, Orange, Purple & Pink Lines: $2,067, YoY -8.7%
How Much Can You Save?
- Save $728 between Cermak-Chinatown – Red Line ($1,812) and Sox-35th – Red Line ($1,084)
- Save $600 by traveling one stop south from Polk – Pink Line ($1,900) to 18th Street – Pink Line ($1,300)
- Save $531 by traveling one stop north from North/Clybourn – Red Line ($2,066) to Fullerton – Red, Brown & Purple Lines ($1,535)
- Save $272 between Chicago – Blue Line ($2,067) and Division – Blue Line ($1,795)
- Save $260 between Illinois Medical Center ($1,858) and Western – Blue Line – Forest Park Branch ($1,598)
Here’s a Condensed Map for Sharing

***
What Does This All Mean For You?
Finding an apartment in Chicago is hard. Deciding where to live and starting your search is probably the most difficult step. By giving you as much information about the market as possible, RentHop hopes to point you in the right direction. This map is just one of the data-backed insights we offer. All of our Chicago apartment listings are ranked using available data to ensure that renters always see the best quality apartments.


