2017 – The Year of the Pothole
As we leave the Winter behind and enter Spring, the team at RentHop thought it would be the perfect time to remind everyone to beware the dreaded pothole. We hope applying a little data science to the Pothole Requests from the City of Boston helps to prevent your unsuspecting tires, axles and undercarriages from falling victim to these motor vehicle nemeses.

Here’s a summary of our findings
- 1,015 unique potholes requests submitted in 2016 and 2017 (as of April 17, 2017)
- Almost as many requests submitted in first four months of 2017 (471) as all of 2016 (544)
- The Fenway/Kenmore/Longwood area has the most pothole requests
- Mission Hill has the highest density of pothole requests
- The BOS:311 app appears to be effective in getting citizens to report potholes
- Most (93.7%) of the requests for pothole maintenance are overdue
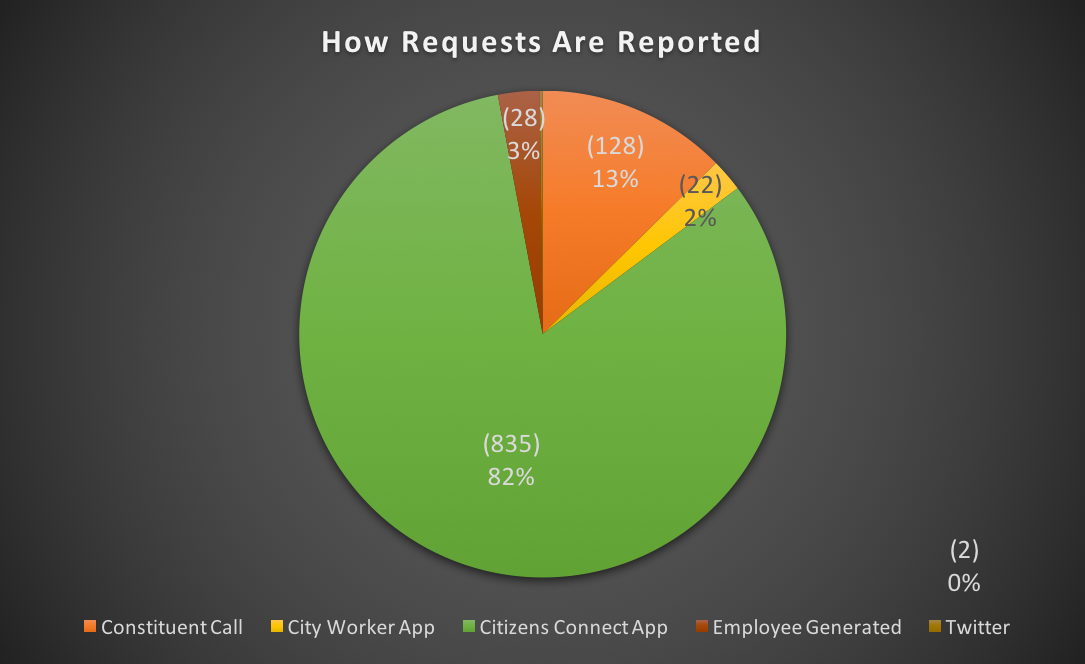
See a pothole? There are many ways to make a complaint
There are a number of methods to report a pothole if you see one. You can call in, tweet, but by far the most common way is to use the Citizens Connect app (a.k.a. the BOS:311 app). The BOS:311 app helps residents and visitors improve City neighborhoods, by facilitating easy reporting of non-emergency issues, like graffiti and potholes.
Which neighborhoods have the most potholes?
Is your neighborhood one of Boston’s holiest? To determine and rank fairly, we normalized requests by the square mile area of the neighborhood. We also de-duped the requests, by looking at calls within a week about the same address/intersection/coordinates.
| Neighborhood | Pothole Requests | Requests / Sq Mile |
|---|---|---|
| Mission Hill | 75 | 136.36 |
| Downtown / Financial District | 80 | 129.03 |
| Fenway / Kenmore / Audubon Circle / Longwood | 146 | 124.79 |
| Back Bay | 71 | 114.52 |
| Beacon Hill | 16 | 51.61 |
| South End | 38 | 51.35 |
| Jamaica Plain | 111 | 28.17 |
| Charlestown | 34 | 25 |
| Roxbury | 67 | 20.36 |
| South Boston / South Boston Waterfront | 46 | 14.29 |
| Allston / Brighton | 61 | 13.74 |
| Dorchester | 77 | 10.56 |
| East Boston | 43 | 9.13 |
| West Roxbury | 42 | 7.65 |
| Roslindale | 16 | 6.37 |
| Hyde Park | 20 | 4.38 |
| Mattapan | 1 | 0.474 |
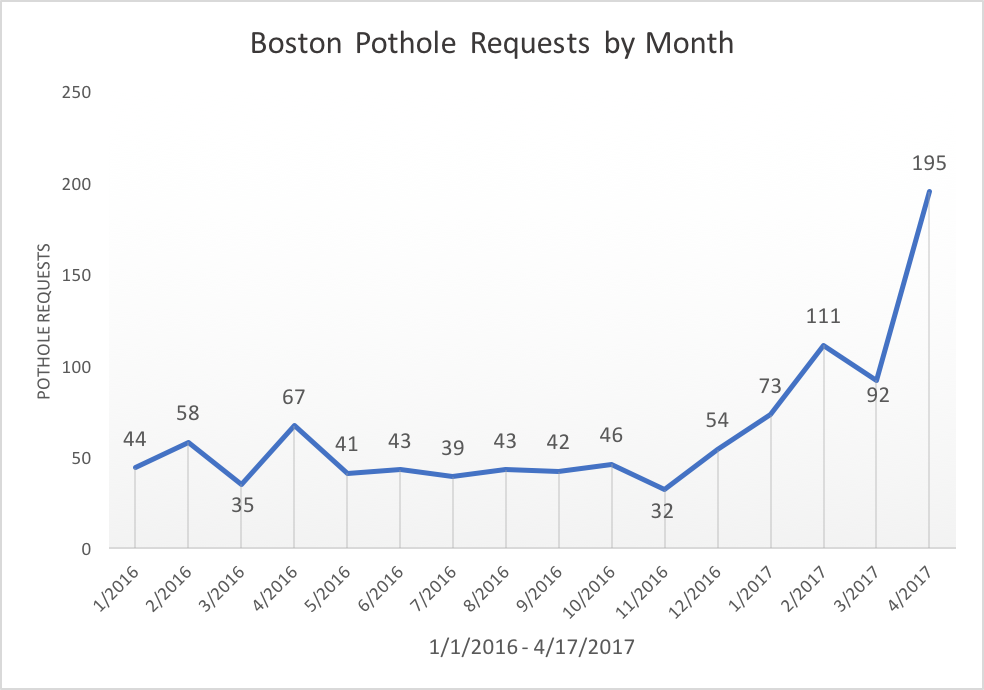
When are they reported? Do they get fixed?
With the Super Bowl parade, repeated snow storms, and huge temperature swings between deep-freeze to 50 degrees immediately following these snows – the first four months of 2017 have seen a spike in potholes reported. Looking just at the April requests so far, we can see it’s been the busiest month on record, with 195 unique requests as of April 17. At this pace we’re sure to surpass 2016’s number of requests soon.
Once a pothole is requested is submitted, an estimated time until job completion is generated. As of April 17, 2017, there were 1,015 complaints logged in 2016 and 2017. 951 of them are marked as ‘overdue’ That’s 93.7% of requests, suggesting that the city simply cannot keep up with volume of complaints.
What does this mean for you?
While we didn’t find a correlation between potholes and rent prices, we know that smooth roads are a concern for drivers as well as bicyclists. For those that primarily ride the ‘T’, it may not be as relevant to you.
You can use this new found knowledge to filter RentHop’s thousands of Boston Apartment listings.
Happy Spring, and good luck out there!


