While climate change has certainly made winter more bearable for many, the recent cold spell reminded us how brutal the weather in New York could be, especially for those who live in areas with poor heating. Each year, renters across the city fall victim to inadequate heat and hot water in their apartments.
Despite the NYC Heat Law, many landlords do not comply with heating regulations, resulting in many tenants reporting their buildings to 311. Each winter, RentHop analyzes the frequency of these calls throughout buildings, neighborhoods, and boroughs, finding that certain areas receive more heat complaints than others. Areas like Fordham Heights (Bronx), Flatbush (Brooklyn), and Little Italy (Manhattan) continue to receive a high volume of heat complaints. The following describes where renters are more likely to be left out in the cold.
Key findings from this year’s report include:
- In total, 172,692 heat and hot water complaints were filed to 311 residents across New York City from October 1, 2023, to February 16, 2024, 23.22% fewer than last winter.
- After grouping complaints by day and address, we found 120,092 unique complaints, 23.46% more compared to the same period last year.
- Many New Yorkers were left without heat on Valentine’s Day, with a total of 1,353 complaints, or 1,008 unique, filed. [Figure 1]
- Of the five boroughs in NYC, four received more heat complaints than last year, including the Bronx, Brooklyn, Manhattan, and Queens. [Section “Heat Complaints by Borough“]
- Some of the worst heat violation offenders include 76 Saint Nicholas Place (634 complaints / 128 unique), 31-35 Crescent Street (1,889 complaints / 116 unique), and 2176 Tiebout Avenue (1,413 complaints / 115 unique) [Data Table]
Heat Complaints by Borough
The Bronx
- The Bronx remains the coldest borough, receiving 41,010 unique heat complaints this winter as of February 16.
- Norwood is the coldest neighborhood in the city, with 2,013 unique complaints, or 1828.67 complaints/10k renter-occupied units. Complaints increased by 2.94% from last year.
- 80%, or eight, of the 10 coldest NYC neighborhoods reside in the Bronx.
Brooklyn
- Brooklyn received 33,686 unique heat complaints, increasing by 1.29% from last year.
- Flatbush remains the coldest neighborhood in Brooklyn, with 5,563 unique complaints and 1,146.51 complaints/10k renter-occupied units.
Manhattan
- Heat complaints are up 4% from last year during the same period, with residents filing 26,166 unique heat complaints.
- In the coldest neighborhood, Little Italy, heat and hot water complaints are down 9.78% from last year.
Queens
- Queens received 17,667 unique heat complaints this year, up 6.9% from last year, the most of all boroughs.
- Holliswood is the coldest neighborhood in the borough, where complaints are up 106.82%.
Staten Island
- Renters in Staten Island have filed 1,563 unique complaints as of February 16, 2024, down 6.07% from last year.
- The neighborhood with the most complaints, Clifton, has 1528.48 unique heat complaints per 10k renter-occupied units this year.
When Does the Heat Season Start?
Landlords in New York City must provide heat for all of their tenants from October 1st through May 31st. This period is referred to as the “Heat Season.” Heating requirements include:
- Between 6:00 AM and 10:00 PM, if the outside temperature falls below 55 degrees, the inside temperature is required to be at least 68 degrees F
- Between 10:00 PM and 6:00 AM, if the inside temperature is required to be at least 62 degrees F, no outside temperature requirement
Many buildings in the city do not provide adequate heat for their residents, with some addresses receiving significant numbers of complaints throughout the Heat Season. Buildings like 31-35 Crescent Street in Queens and 2176 Tiebout Avenue in the Bronx received hundreds of complaints this year.
Surely, when tenants are suffering, they make dozens of complaints each day to 311. Therefore, to accurately measure the number of days a building goes without heat, RentHop grouped the heat/hot water complaints by address and created date. Complaints filed on the same day regarding the same building are considered one unique complaint. From Oct 1, 2023, the start of this Heat Season, to February 16, 2024, the city received 120,092 unique heat complaints, 4.33% higher than the total unique count of 115,166 in the same period last year.
Renters Suffer as Temperatures Drop Below Freezing
It is no surprise that when the temperature drops, renters are more likely to file a complaint, but by how much? We at RentHop visualized the correlation for you in Figure 1. As you can see, the recent cold waves have driven many renters in despair to call 311, with unique complaints shooting over 2,000 on January 18 and 19, when the lows in mid 20s. The volume of complaints 311 had to process soon dropped below 750 as the temperature rose above freezing. Complaints picked up between February 5 and 6 and broke 1,000 again on February 14, when the averages fell close to 32 degrees. It looks like many New Yorkers were left with only the heat of passion on Valentine’s Day to keep them warm.
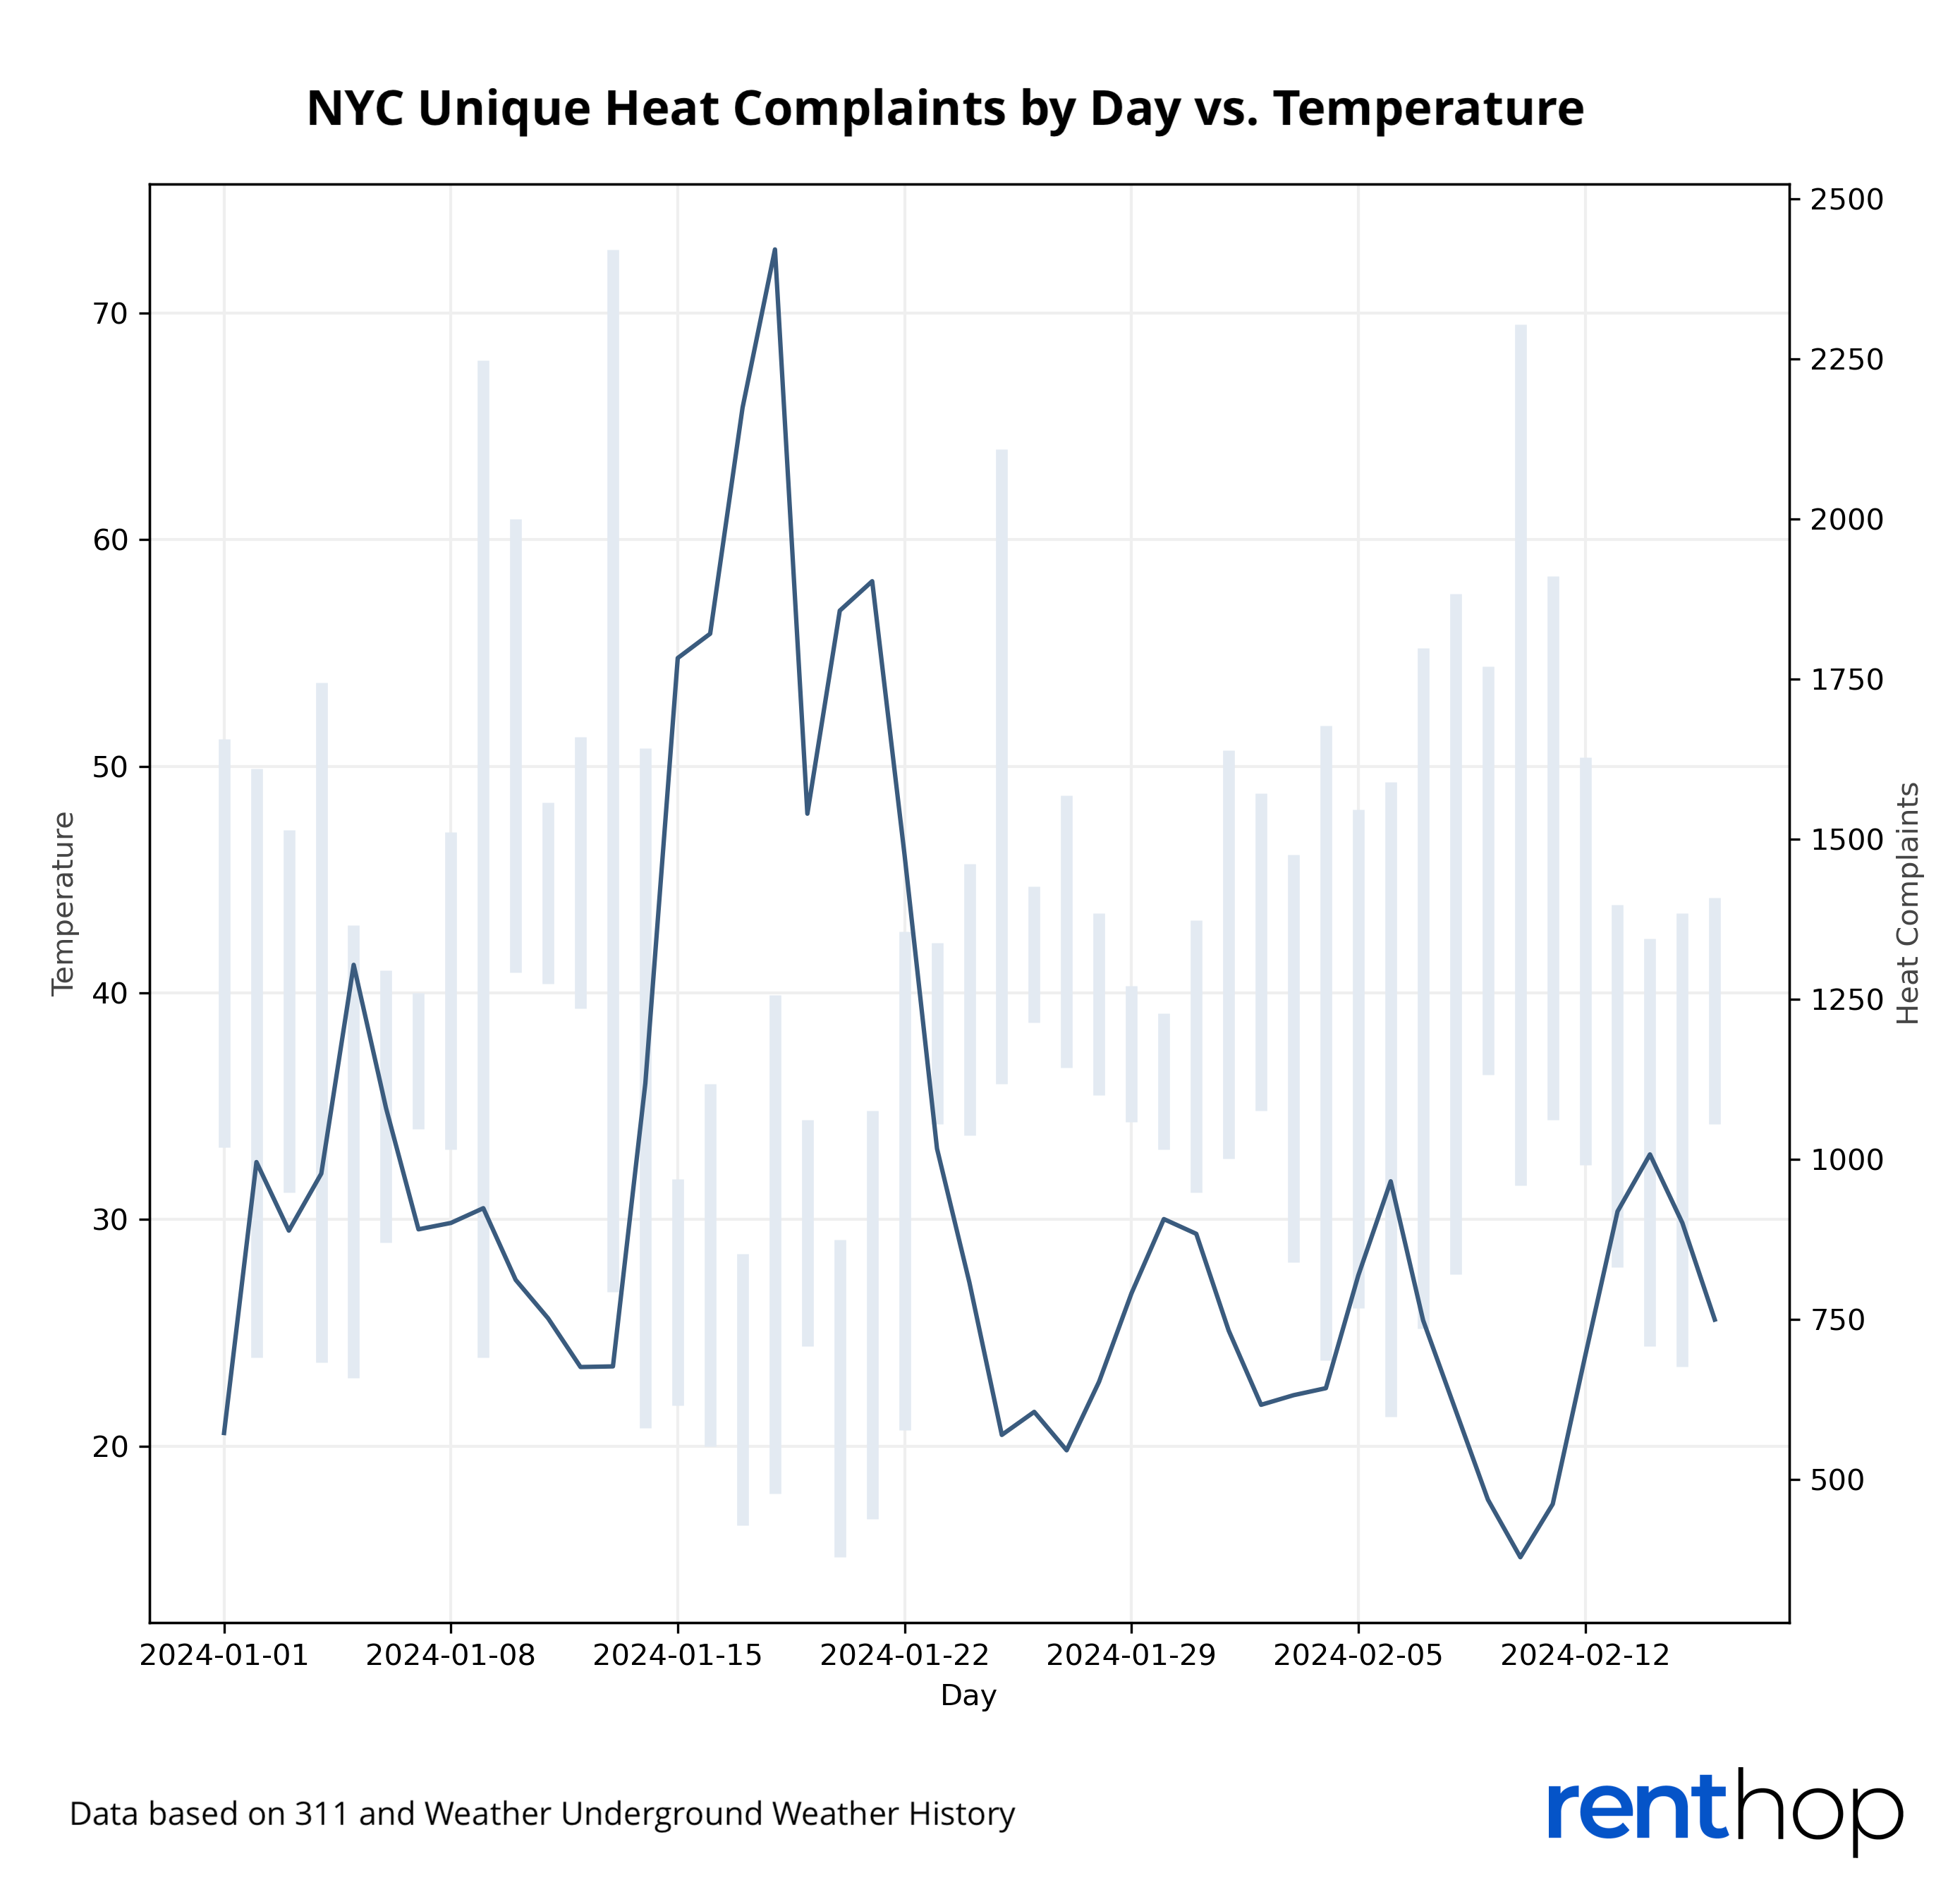
Figure 1
The Bronx Remains NYC’s Coldest Borough
Figure 2 demonstrates the number of normalized heat complaints per borough from October 1st to mid-February of 2020 through 2024. The Bronx consistently receives the highest number of heat complaints annually, accounting for 34.15% of total city-wide complaints this season. Brooklyn outpaced Manhattan this year and became the second-coldest borough in New York. The borough received 510.35 complaints per 10,000 renter-occupied units. Heat complaints have risen across all boroughs other than Staten Island this year.
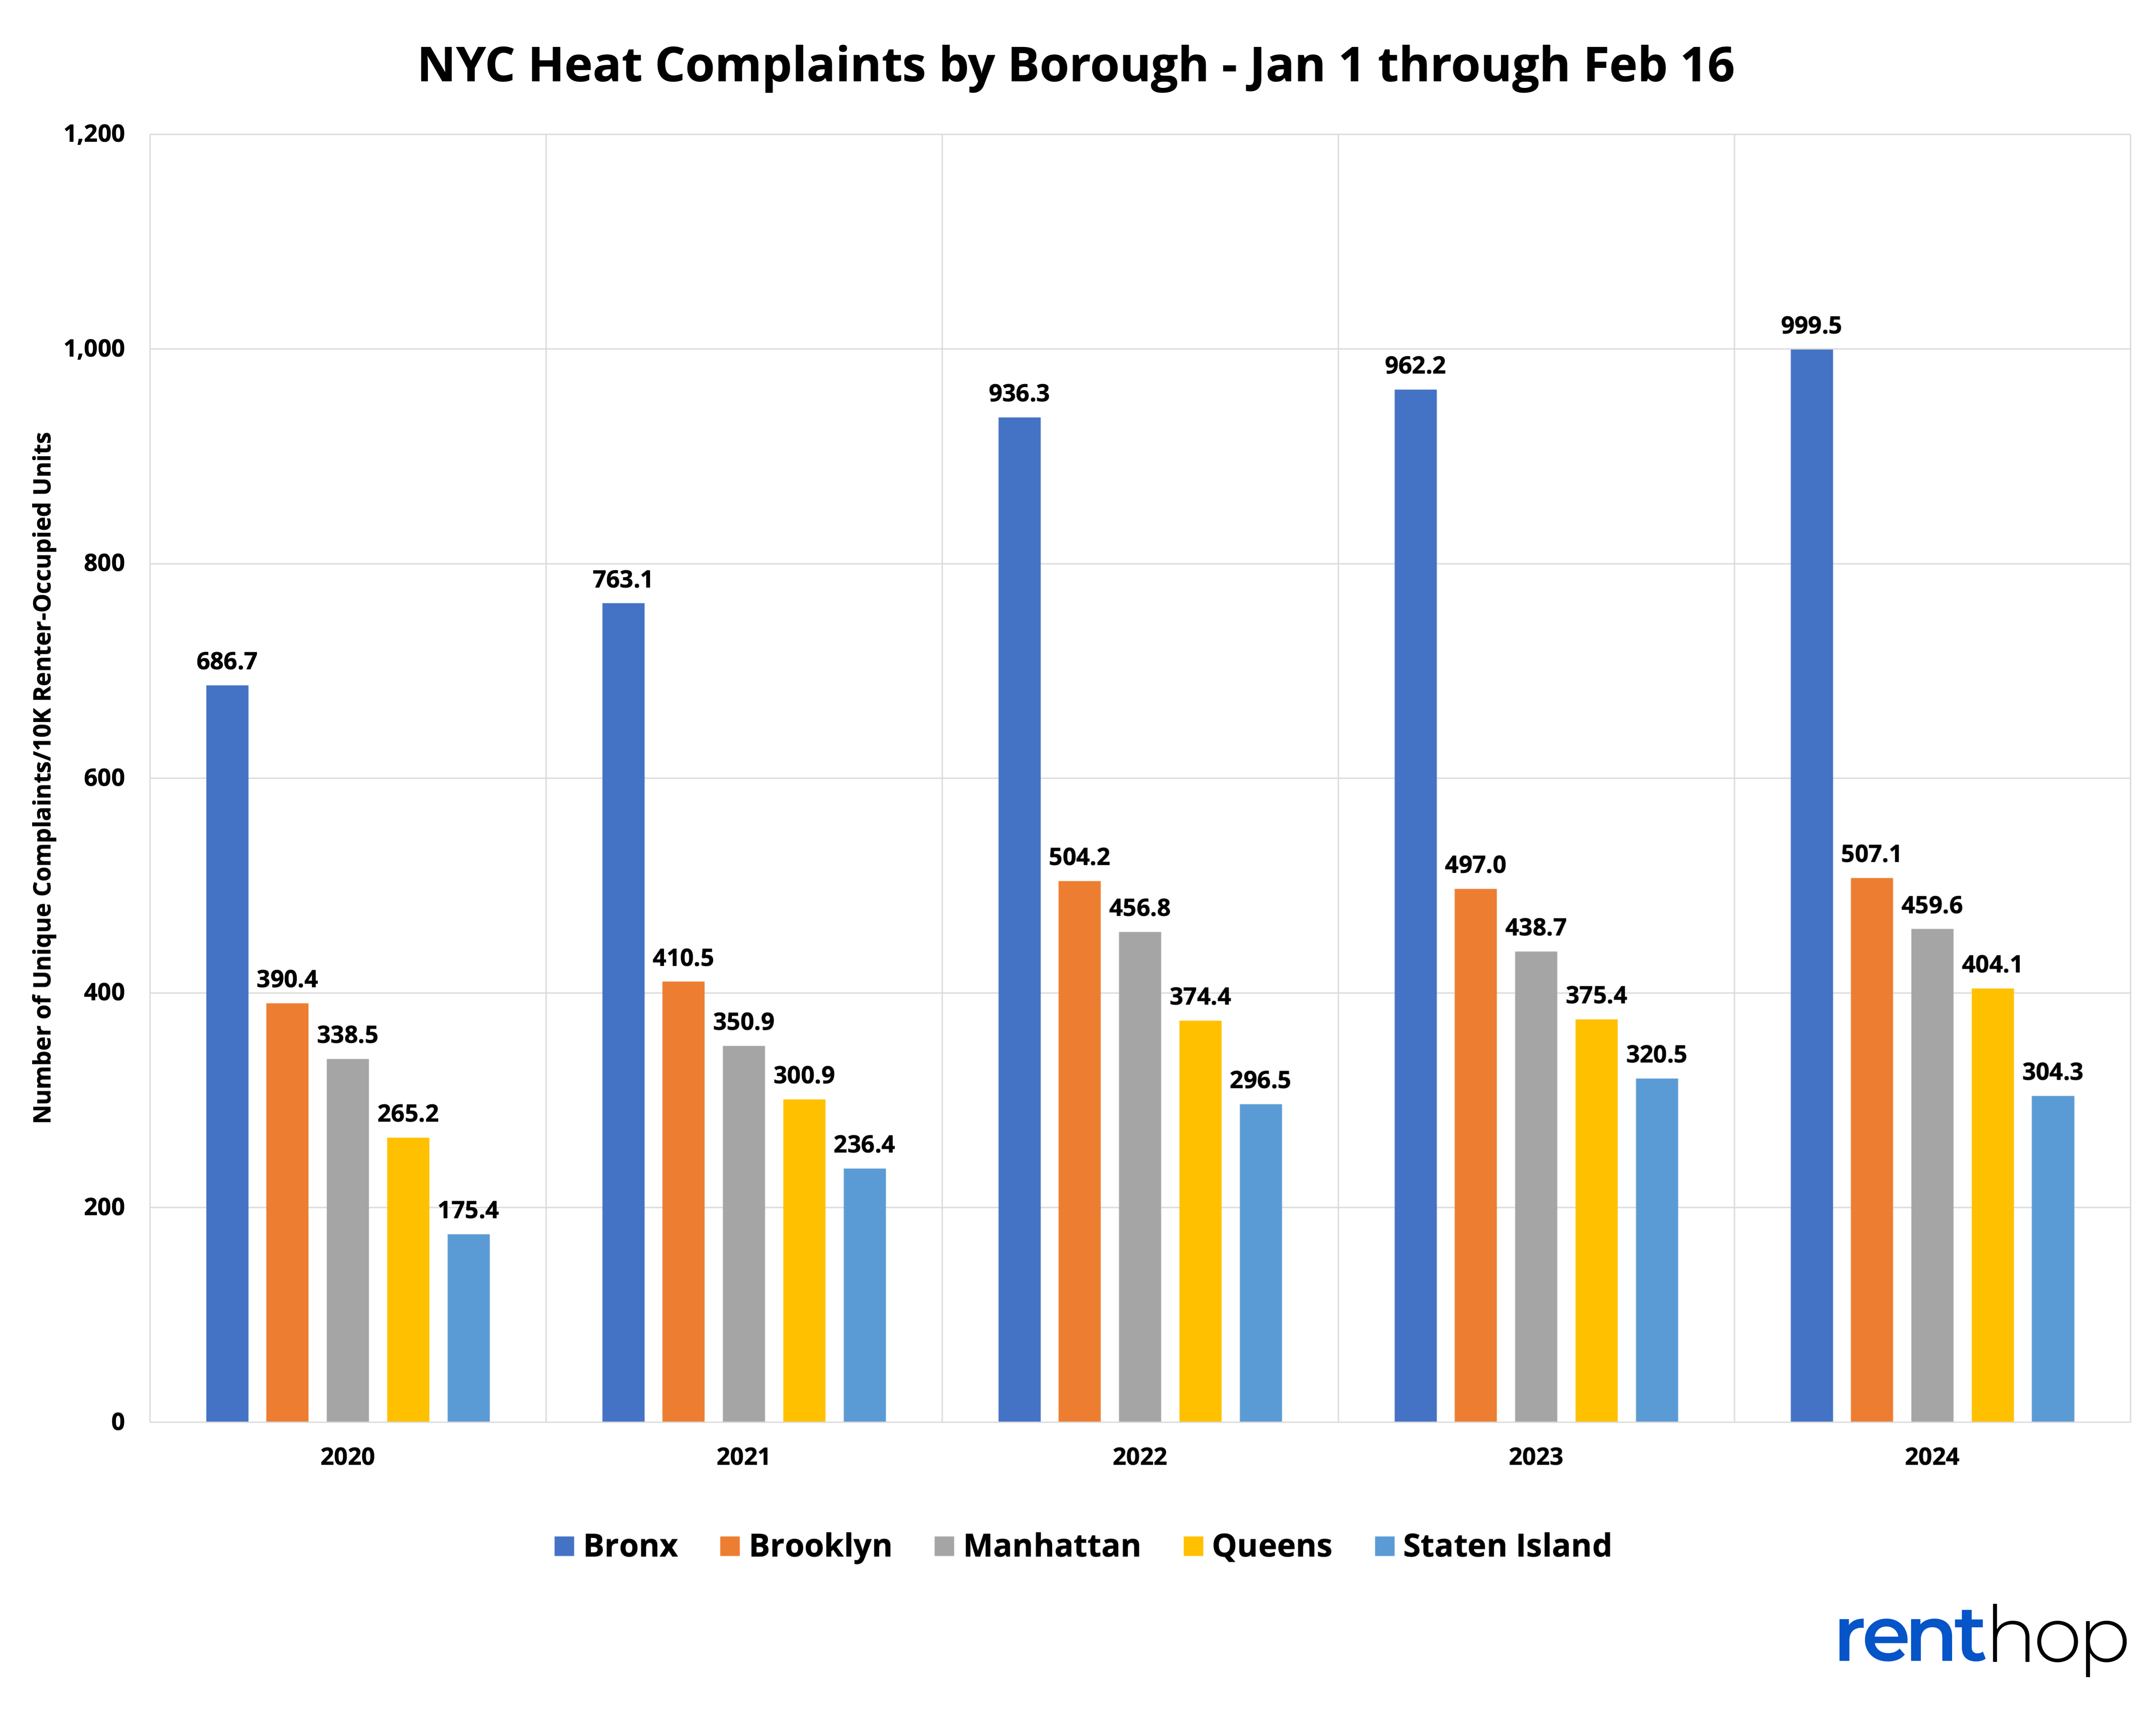
Figure 2
Mapping the 311 Heat Complaints by NYC Neighborhood
To fairly rank the neighborhoods, we further normalize the data by dividing the number of heat complaints by the number of renter-occupied units in a neighborhood retrieved via the 2021 American Community Survey (homeowners can control their heat and are therefore excluded from this study).
The map below illustrates how “cold” each NYC neighborhood is. The darker the shade, the more heat complaints per 10,000 renter-occupied units a neighborhood has seen this winter. Click on the neighborhood to learn more.
Neighborhoods in the Bronx received more heat complaints than the other boroughs. Out of the 20 coldest neighborhoods in New York City, 14, or 70%, are in the Bronx. Other areas of the city, like neighborhoods in Manhattan above Central Park and Central Brooklyn, receive frequent heat complaints as well.
These are the Coldest Neighborhoods in NYC
Figure 3 showcases the top 20 neighborhoods with the largest amount of normalized heat complaints this season, from October 1st to January 9th, 2023. 17 of the 20 neighborhoods are located in The Bronx.
Norwood took over first place this year, replacing Pelham Parkway. The neighborhood received 10.73% more complaints than last year, with 1,828.67 complaints per 10k renter-occupied units reported between October 1 and February 16, 2024. Overall, 16 out of the coldest 20 neighborhoods received more complaints this year than last year. These neighborhoods include Concourse Village (-9.58% YoY), East Tremont (-2.99%), and Bedford Park (-1.39%) in the Bronx.
Little Italy remains Manhattan’s coldest neighborhood despite 9.76% fewer complaints than last year. It’s worth noting that most buildings receiving complaints in Little Italy are older and smaller, built in the early 1900s and hosting fewer than sixteen residential units. As of February 16, the neighborhood had received 1,401.52 complaints per 10k renter-occupied units this heating season. Inwood ranks as the second coldest neighborhood in Manhattan, with a total of 1,294.12 unique complaints filed per 10k renter-occupied units, 30.78% worse than in the previous winter.
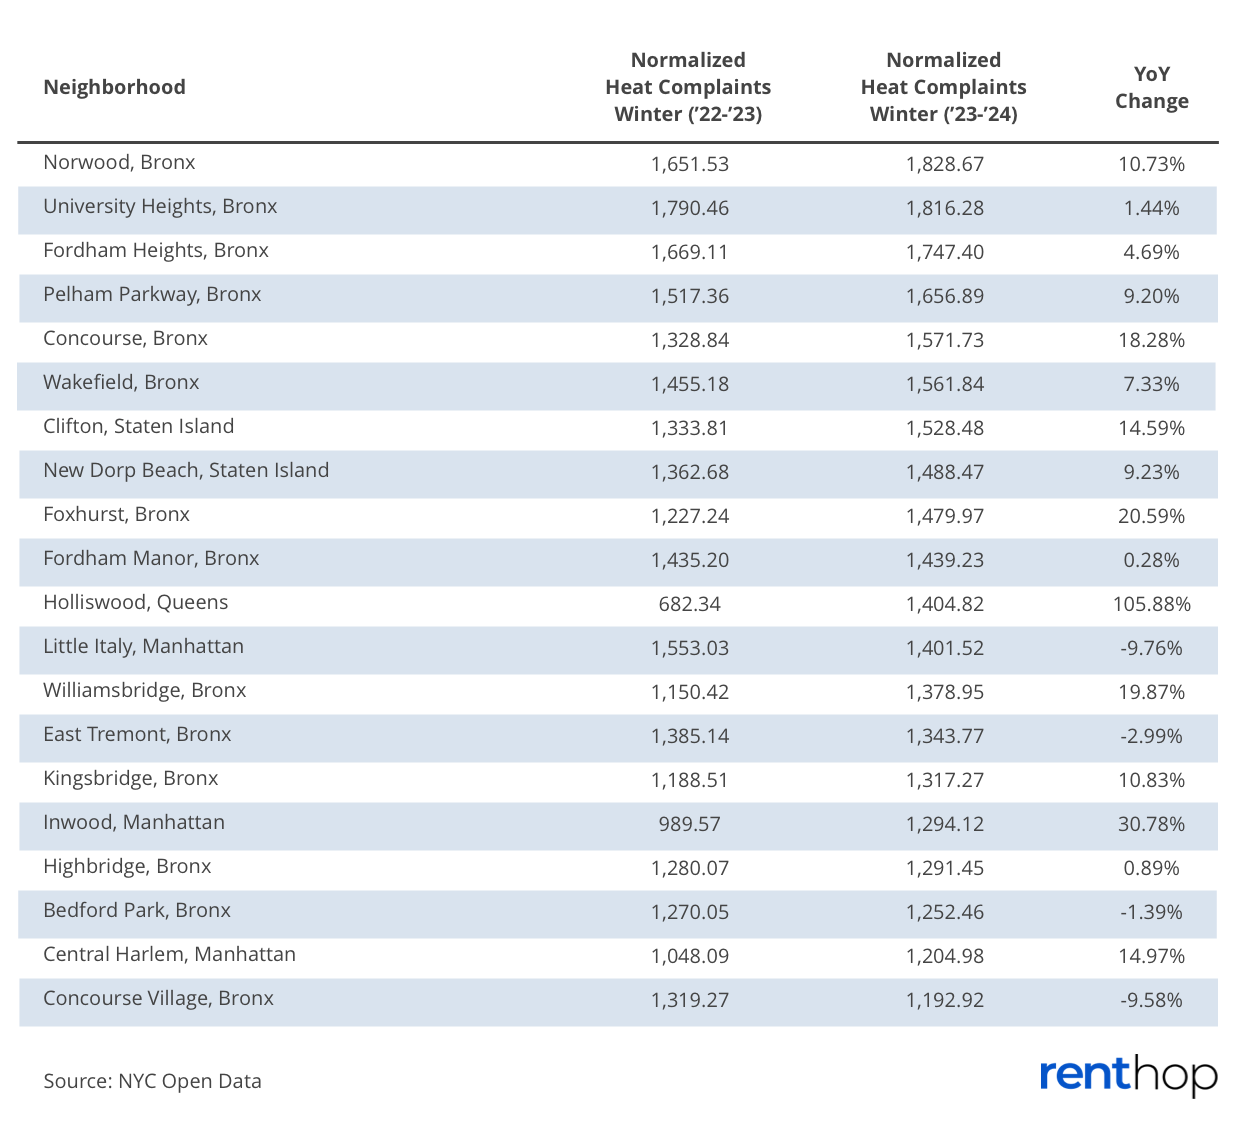
Figure 3
Winter Just Got Colder in These Neighborhoods
Figure 4 displays the neighborhoods with the greatest increase in heat complaints this year. Complaints in Huguenot, Staten Island shot up eight times year over year. Meanwhile, renters in Glen Oaks filed more complaints than in 2023. The neighborhood has received 167.17 complaints per 10k renter-occupied units this winter, 175% worse than a year ago.
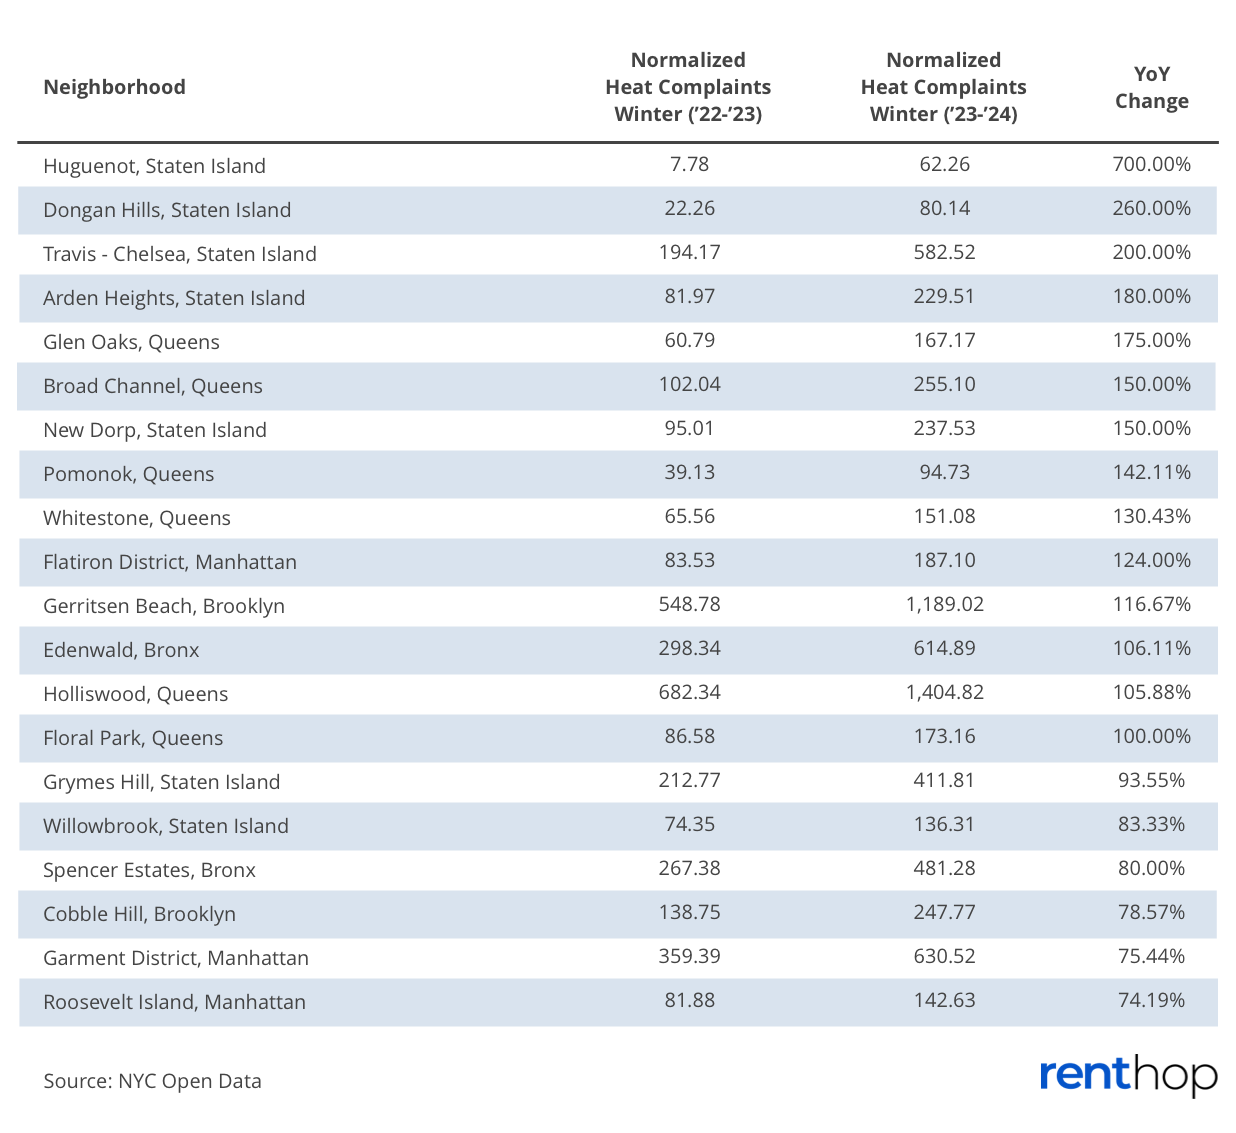
Figure 4
Buildings with Frequent Heat Complaints
While some neighborhoods receive more complaints than others, certain buildings have a high amount of complaints as well. The following table displays the 100 buildings across the city with the highest number of heat complaints this year. If you’re looking to sign a lease, make sure to check your building against this list to ensure you’ll stay warm in the winter. You can further explore the data by sorting the data by column or doing a quick search using the search bar.


