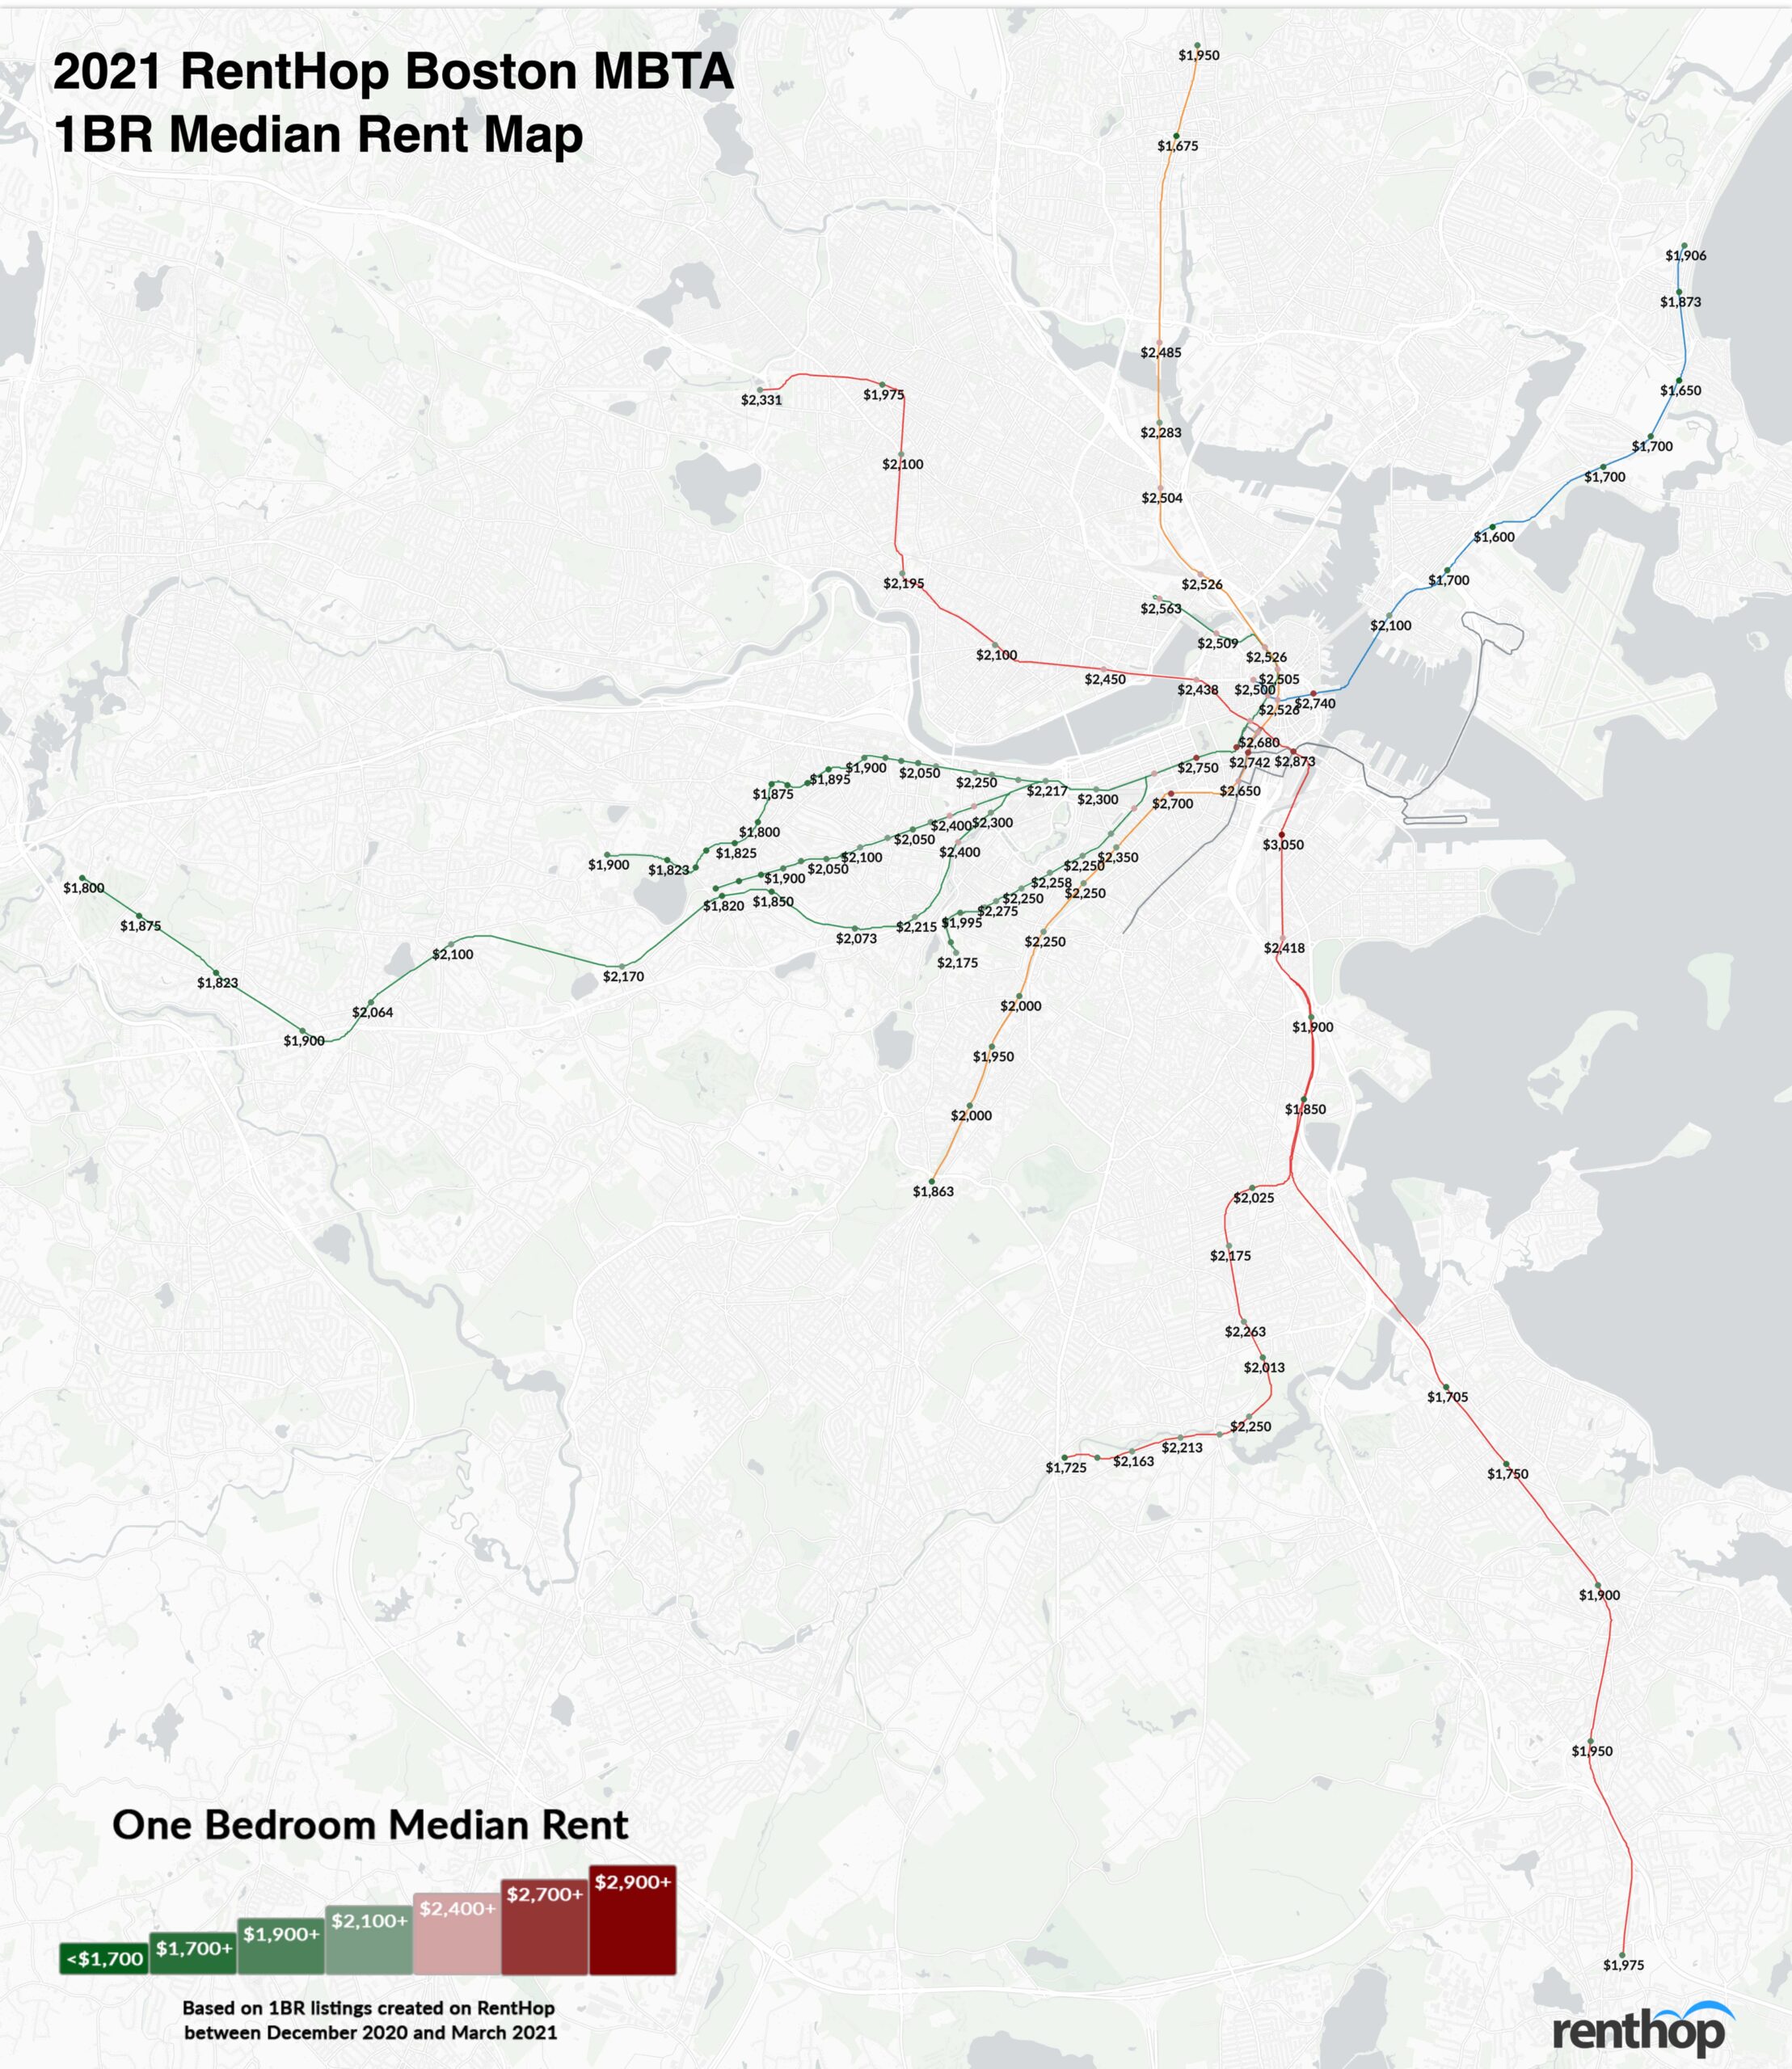
Boston’s rapid transit system saw a drastic drop in ridership during the Covid-19 pandemic, and it currently faces a projected budget deficit of up to $600 million for 2021. Social distancing precautions are still in place as folks continue to work from home, and eschew the T. As a result, close proximity to a train station to ease a work commute isn’t the must-have for apartment hunters that it used to be.
However, there’s a silver lining.
Single renters in Beantown are seeing new — and cheaper — one-bedroom leases drawn up at just about every subway stop along the Green, Red, Orange, and Blue lines.
RentHop data scientist Shane Lee recently crunched the numbers to map out median rents by each T train stop. Here’s what she discovered:
- Rents decreased at 105 stops across all train lines.
- That’s 87% of Boston’s train stops.
- Rents increased at just 11 stops in the past year.
- 5 stops experienced no change.
- Median rent dipped 25% at Government Center (Blue) — a five minute walk from 1 Devonshire Place, a luxury building that’s now 22% cheaper (with 2 months of free rent).
- Median rent slid roughly 24% at both the State (Blue, Orange) and Park Street (Green, Red) stops.
- The trend also resulted in a 16% rent drop near Fenway Park (Green).
Peruse Our Interactive T Map For All Stops With Respective Rents and YoY Fluctuations
To calculate the median rent for the map above, we used RentHop rental data for one-bedroom apartments from December 2020 through March 2021 and from December 2019 through March 2020, as well as Massachusetts Bay Transportation Authority (MBTA) GIS data for T stops from Mass.gov.
To get accurate prices near the subway stops, we looked first at non-duplicated listings within 0.62 miles of an MBTA stop. If there were 50 unique data points we calculated the median. If not, the radius from the stop was increased to 1.2 miles and the data was resampled to ensure enough unique listings were used when calculating the median.
Ride the Train to Savings
Would you travel an extra stop to save $800? Normally, Greater Boston is one of the most expensive rental markets in the U.S., but on the heels of the pandemic, the scenario has changed. Median rent near Tufts Medical Center, for example, typically climbs. This year, the MBTA stop saw a decline of more than 21% from the previous year with a median rent of $2,650. And that’s not even the steepest drop. The list below represents the largest price disparities between each stop.
The Biggest Rent Drops On One-Bedroom Apartments
- Government Center — Blue Line: $2,500, YoY -25%
- State — Blue, Orange: $2,526, YoY -24.7%
- Park Street — Green, Red: $2,552, YoY -24.5%
- Haymarket — Green, Orange: $2,505, YoY -23.5%
- Bowdoin — Blue: $2,500, YoY -$23.2%
According to our previous Boston report, 88 stops experienced rent growth. This time, only 11 stops experienced rent growth. Below are some neighborhoods that bucked the trend.
These Stops Saw The Biggest Rent Hikes
- Shawmut — Red: $2,175, YoY 5.5%
- Quincy Adams — Red: $1,950, YoY 4.9%
- Waban — Green: $1,822, YoY 4.1%
- Wonderland — Blue: $1,852, YoY 2.9%
- Newton Centre — Green: $2,100, YoY 2.4%
Like the transit systems in New York City and Chicago, thousands of Bostonian commuters still rely on the MBTA to zip across the city. But if you want to turn your commute into extra cash, consider the following:
Turn your commute into extra cash at these stops
- Save $640 between Aquarium ($2,740) and Maverick ($2,100) – Blue Line
- Save $810 between Wellington ($2,485) and Malden Center ($1,675) – Orange Line
Tell Your Friends! Here’s A Condensed Map for Easy Sharing

What Does This Mean for You?
Finding an apartment in any city can be daunting, while deciding where to live and starting your search can be the most difficult step. By giving you as much information about the market as possible, RentHop wants to point you in the right direction. This map is just one of the countless data-backed insights we offer. All of our Boston rentals are ranked using available data to ensure that you always see the best quality apartments.


