Yesterday, the U.S. Small Business Administration (“SBA”) released detailed loan-level data regarding the loans made under the Paycheck Protection Program (“PPP”). This disclosure covers each of the 4.9 million PPP loans that have been made under the program.
Digesting this massive data set, we’ve analyzed the PPP loan data by NYC zip code and compared the disclosure with U.S. Census data to assess which neighborhoods received the highest and lowest percentage of PPP loans as compared to the number of qualified businesses in that zip code. As detailed below, PPP funds did not assist all neighborhoods equally, with neighborhoods such as Greenpoint, the Financial District, and Carnegie Hill receiving a disproportionate number of loans relative to the number of qualified businesses.
In this study, we also break down the business sectors and NYC neighborhoods receiving the highest number of loans and retaining the highest number of jobs as a result of this sweeping federal program.
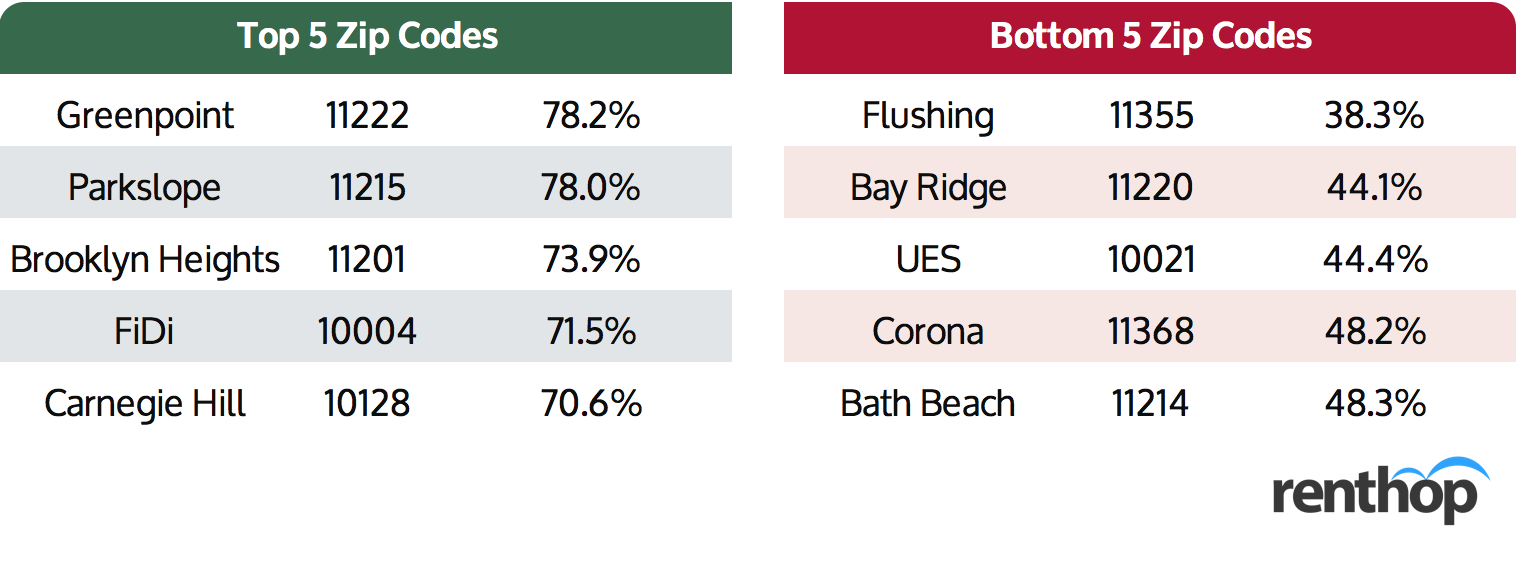
Top and Bottom 5 NYC Zip Codes By Percentage of PPP Loans to Businesses
Comparing the disclosure provided by the SBA with available U.S. Census data, we found large disparities in the proportion of PPP loans received by certain NYC zip codes relative to the number of qualified businesses (less than 500 employees) located in those zip codes.
For instance, Greenpoint (Zip Code 11222) received 1,394 PPP loans for its 1,782 qualified businesses – a rate of 78.2%. By contrast, Flushing (Zip Code 11355) only received 913 PPP loans for its 2,381 qualified businesses – a rate of 38.3%. In effect, Greenpoint’s PPP loan / qualified business ratio was double that of Flushing*.
Below is a chart highlighting the top and bottom 5 NYC zip codes ranked by percentage of PPP loans to qualified businesses:
Jobs Retained By Zip Code
Based on the SBA’s disclosure, a staggering 1,390,686 jobs were “retained” in NYC as a result of the PPP loans. We’ve taken this data and created an interactive map showing the number of jobs retained in each zip code.
As one might expect, the top 5 zip codes ranked by jobs retained all fell in the Midtown Manhattan area.
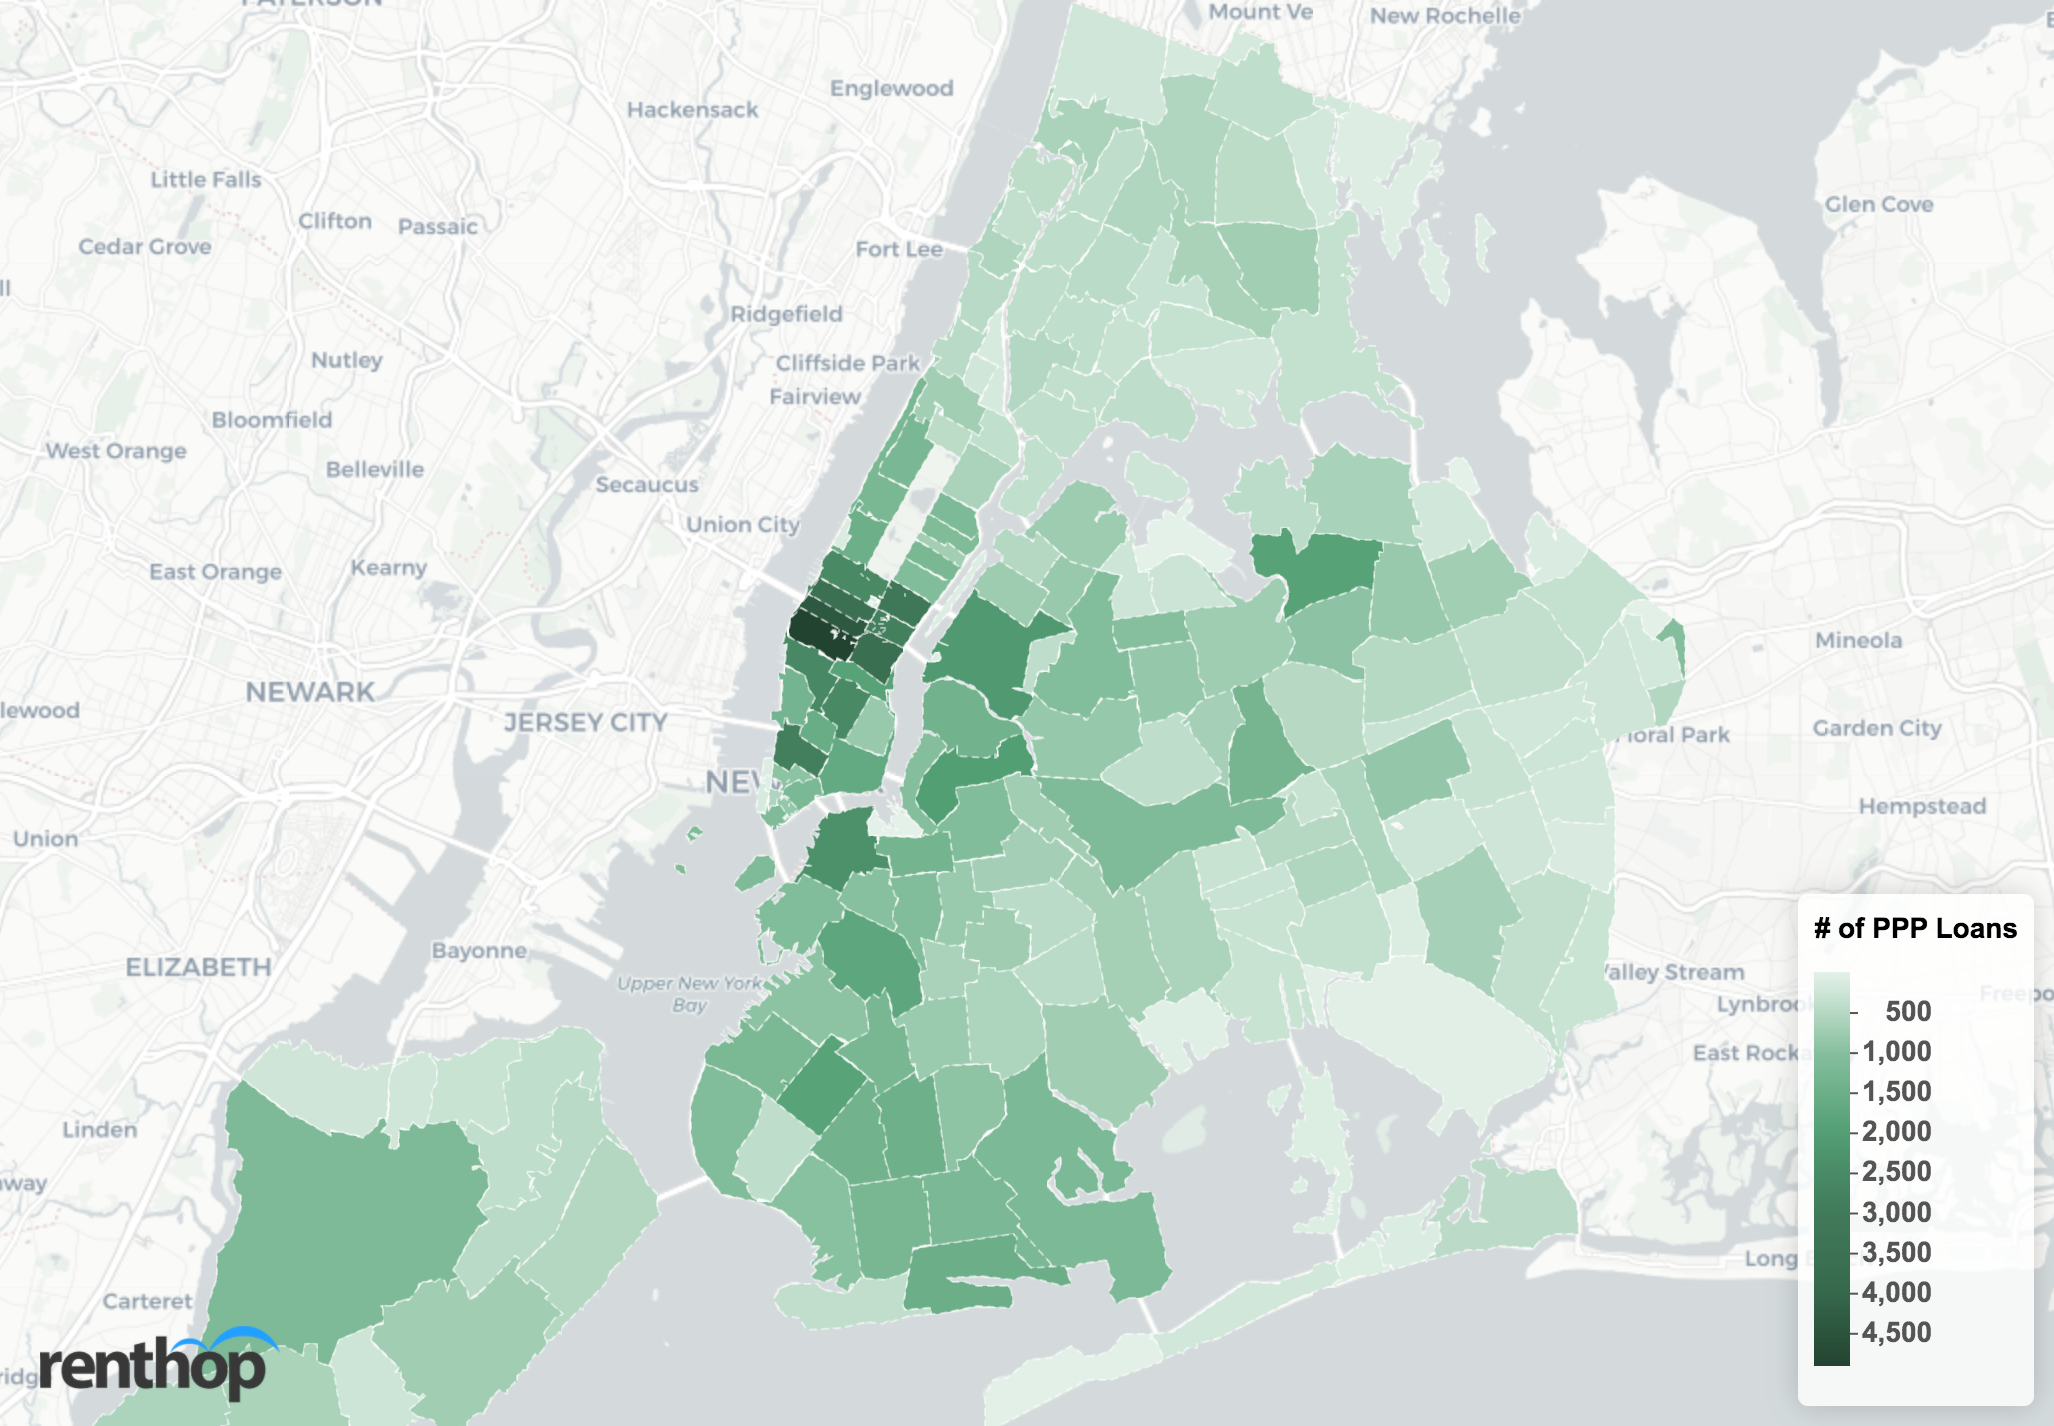
Number of PPP Loans By Zip Code
According to the SBA, 147,371 PPP loans were granted to qualified NYC businesses. Below is an interactive map showing the number of loans granted in each zip code.
Similar to the jobs retained ranking above, the top 5 zip codes ranked by PPP loans received all fell in the Midtown Manhattan area, while Long Island City (11101) and Dumbo and Brooklyn Heights (11201) being some of the outerborough zip codes receiving the most PPP loans.
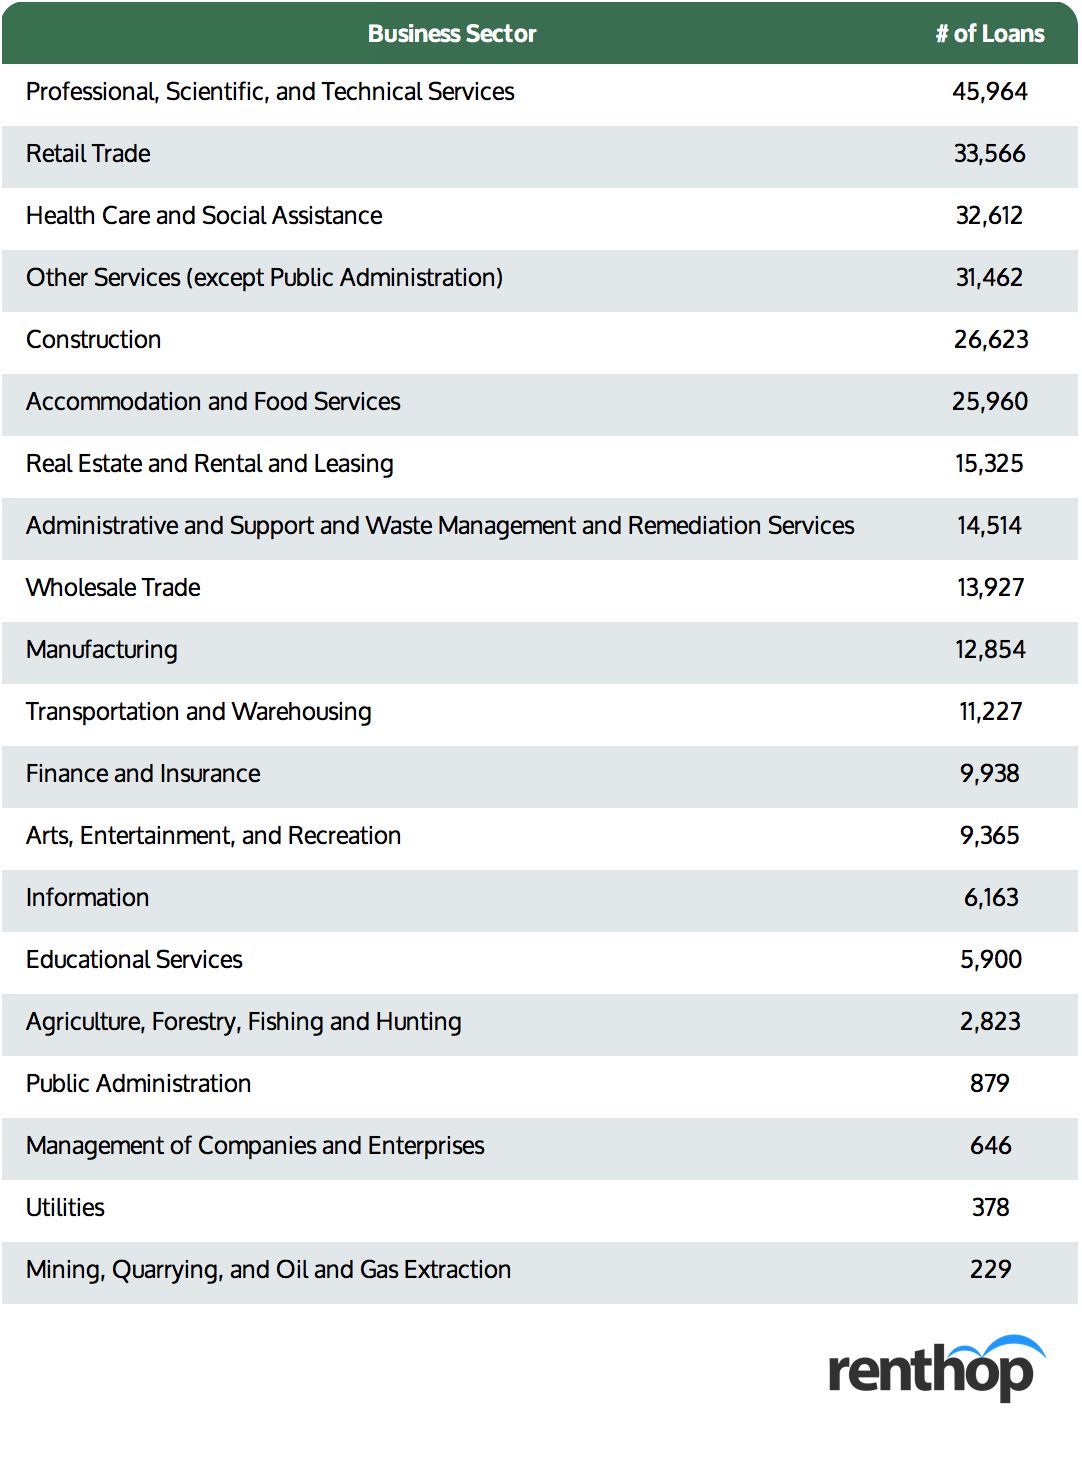
Top Business Sectors Receiving PPP Loans in NYC
The SBA disclosure includes information concerning the business sector of each PPP loan recipient. With this data, we ranked each NYC industry by the number of PPP loans received.
Below is a chart ranking each NYC industry by the number of PPP loans they’ve received through the program:
PPP Loan Data by Loan Range
The interactive table below summarizes the PPP loan data by loan range. You can sort the table by clicking on the column header, or search for a specific zip code using the search bar.
Not surprisingly, zip code 10001, which includes part of Midtown and specifically Hudson Yards, one of the largest commercial real estate developments in New York City, received the most number of PPP loans, and 31% of the loans approved in zip code 10001 were above $150K. Meanwhile, while there were only 1,133 approved PPP loans in Bowling Green (zip code 10004), over 40% of the loans were above $150K.
Methodology
This report examines the Paycheck Protection Program Loan data released by the U.S. Department of Treasury, which includes two datasets, PPP Loans of $150,000 and above, as well as PPP Loans under $150,000. For loans above $150,000, the release consists of loan-level data, including business names, addresses, NAICS codes, zip codes, business type, demographic data, non-profit information, lender, jobs supported, and loan amount ranges as follows. For all loans below $150,000, SBA released all of the above information except for business names and addresses.
We grouped the loan data by zip code and loan range and further analyzed the business sectors using the NAICS Code structure and titles released by the U.S. Census Bureau. For the number of business establishments, we utilized ZIP Codes Business Patterns (ZBP) data released by Census on an annual basis. We filtered the data by employment size, and so any establishments with more than 500 employees were excluded from this report.
*For this analysis, we compared the top 50 NYC zip codes as ranked by the number of qualified businesses located therein as reported in the most recent Census ZBP data.
↩


