If you haven’t heard, the U.S. is the only country that refused to sign the Stockholm Declaration, an agreement pledging to eliminate traffic deaths by 2050. While we respect the administration’s decision and know that road safety shares its utmost priority on the agenda, we cannot deny the cost we have to pay in exchange for mobility. Traffic fatalities have generally gone down in major global cities and even decreased to zero in places like Helsinki and Oslo, but that, sadly, is not the case in the U.S.
In 2019, the country as a whole saw more pedestrian and cyclist deaths even though the total number of traffic fatalities was in decline, and such trend did not spare New York City, which prides itself in fighting for traffic safety. For the first time in six years, the number of traffic deaths rose since Mayor de Blasio took office and launched the Vision Zero program, with the number of cyclists and pedestrians killed almost tripled. Indeed, progress is not always linear, and we should not be discouraged. However, this reiterates the importance of adding bike lanes, expanding sidewalks lowering speed limits, and redesigning certain street intersections.
To help generate awareness on traffic fatalities, we at RentHop took a look at the motor vehicle collisions data in the past year, and here’s what we’ve found:
- The number of traffic fatalities rose by 30% in Manhattan in 2019. Neighborhoods such as Midtown-Midtown South, Hudson Yards-Chelsea-Flat Iron-Union Square, and Hamilton Heights all experienced more traffic deaths than in 2018.
- While Upper West Side is considered one of the safest neighborhoods (ranked 185 with only 105.3 collisions/10k population), the neighborhood, unfortunately, experienced three deaths in 2019.
- Brooklyn, similarly, saw a 24% increase in traffic fatalities. The number of persons killed in motor vehicle crashes went from 62 in 2018 to 77 in 2019, making it the borough with the most casualties.
- While traffic fatalities dipped in Queens, some neighborhoods saw more deaths instead. The total persons killed in South Ozone Park rose from two to seven, or 250%, in 2019.
- In Annadale-Huguenot-Prince’s Bay-Eltingville, Staten Island, while the number of collisions went down by 47%, the death toll rose from zero to three in 2019.
- While the number of collisions did decrease in Mount Hope, the Bronx, the neighborhood saw three traffic deaths in 2019.
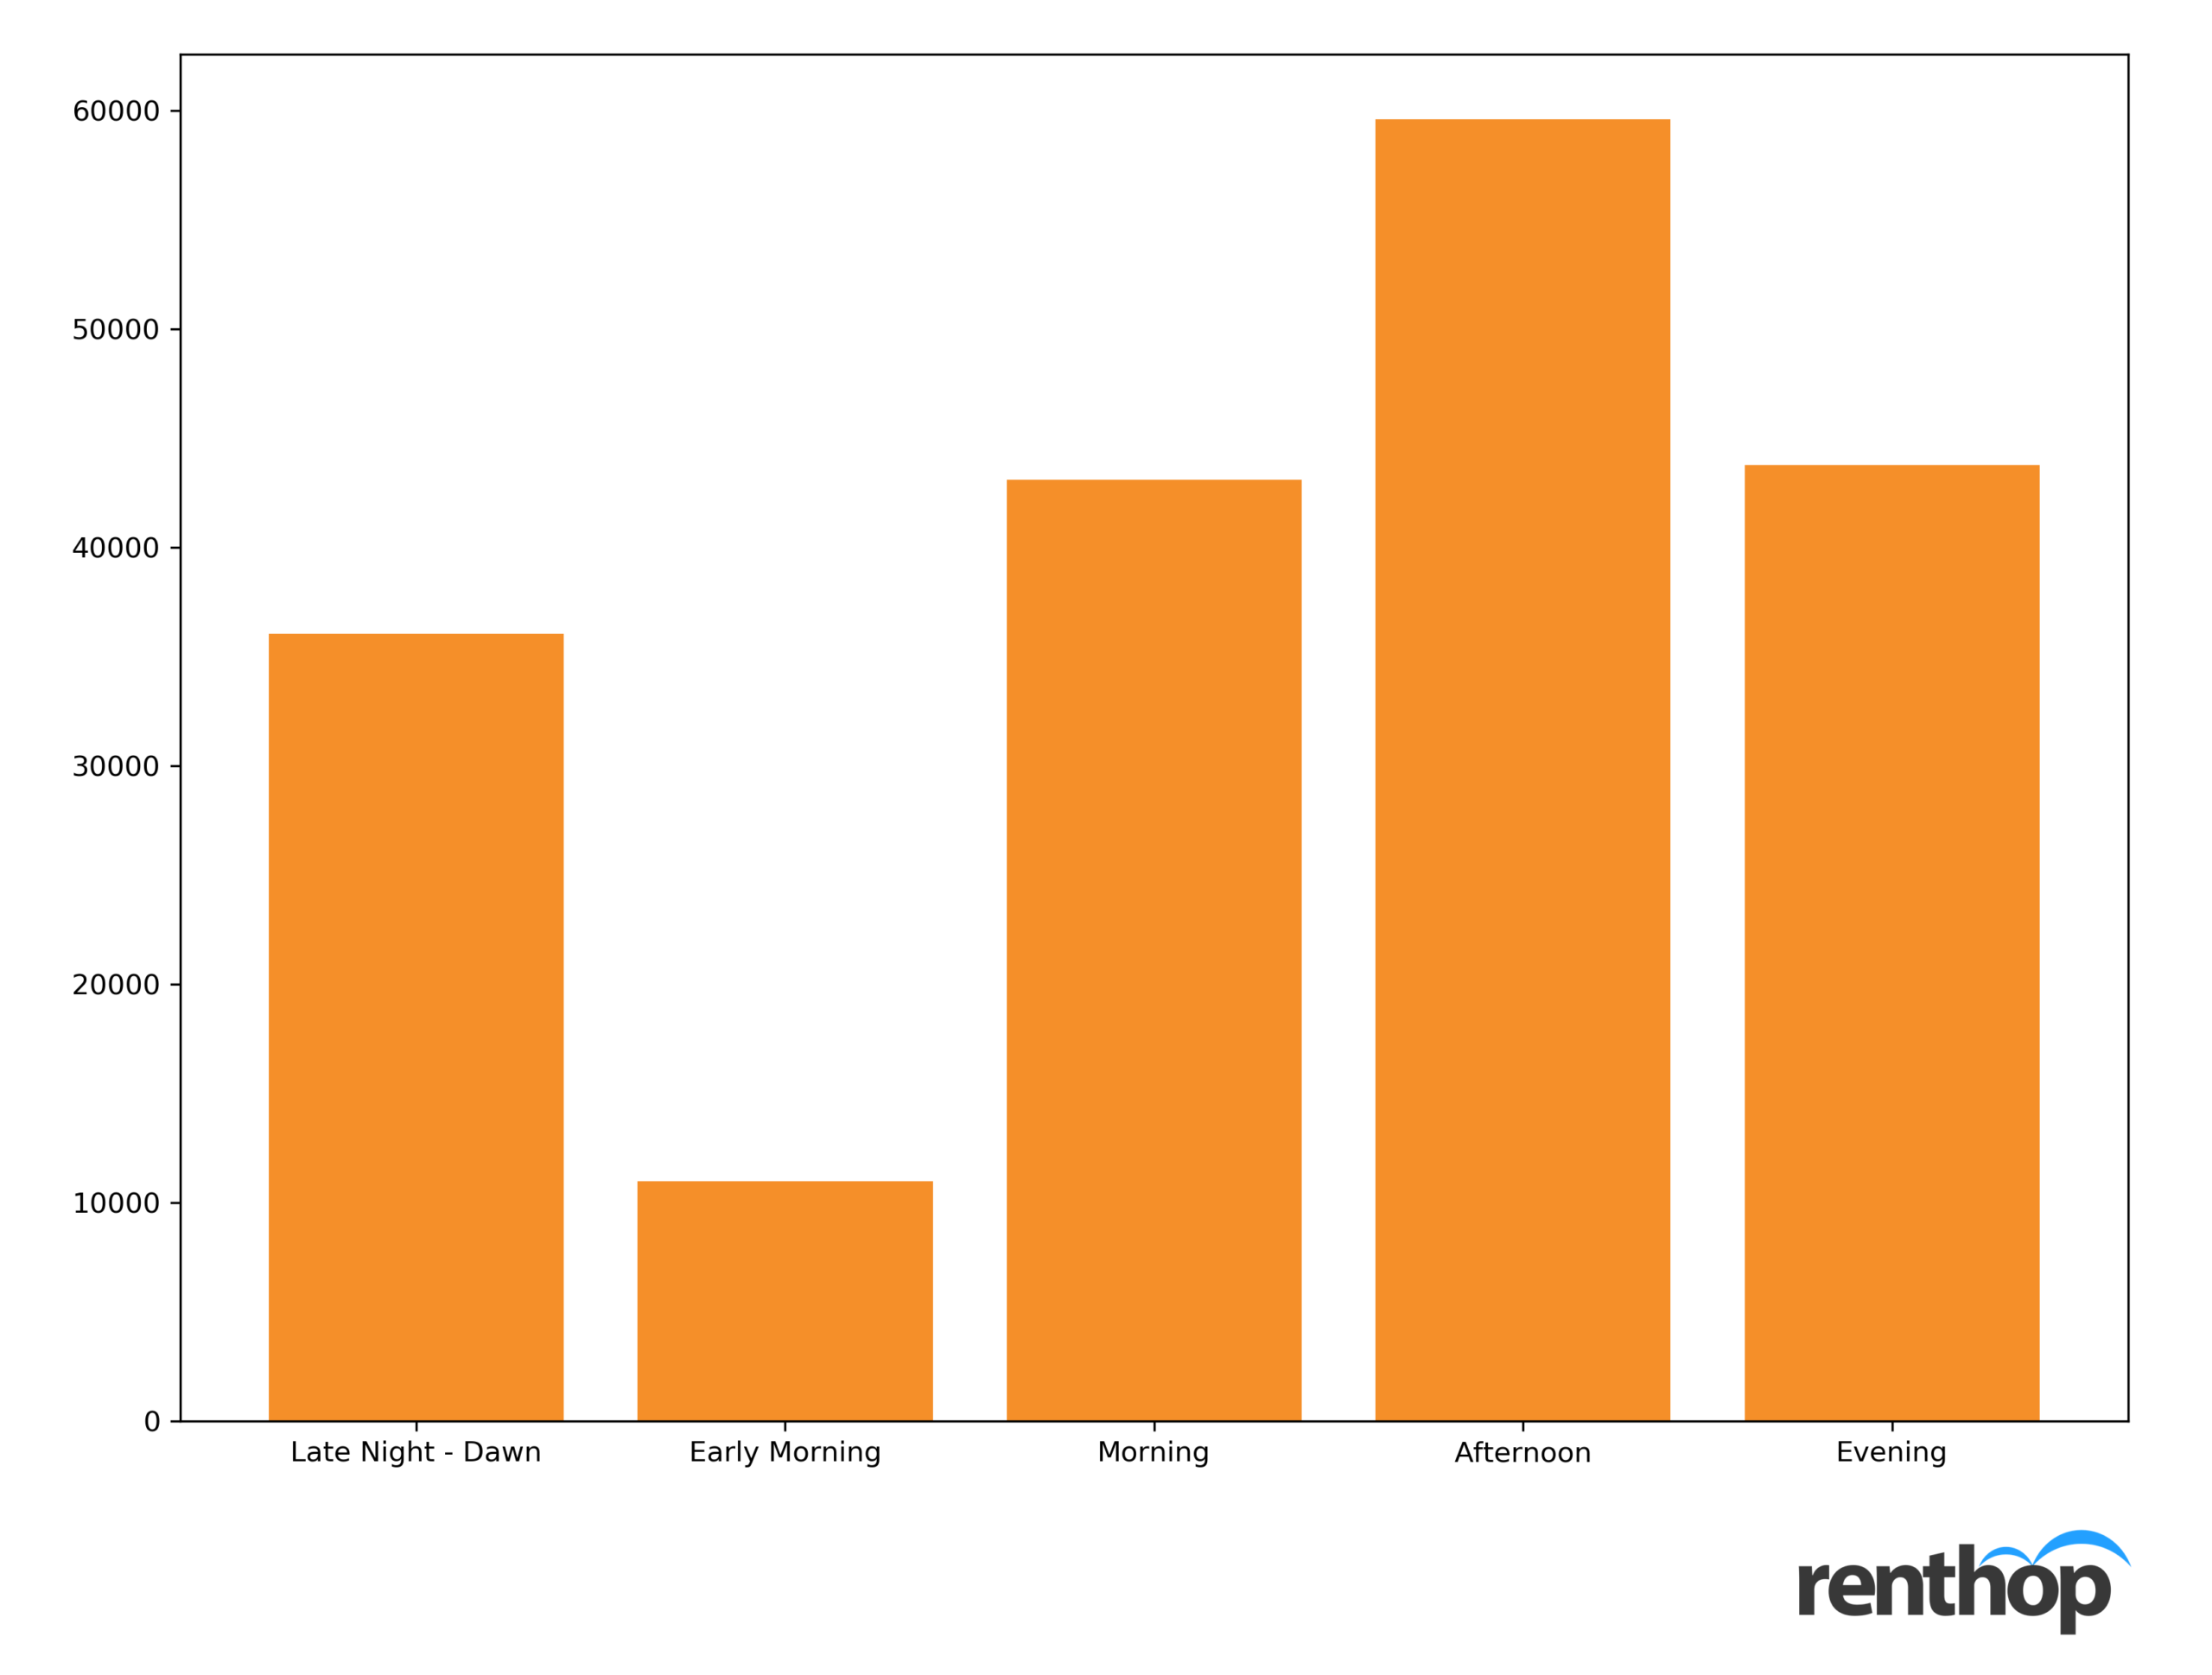
- In 2019, more traffic collisions occurred in the afternoon (12 PM – 5 PM) than any other parts of the day.
[Map]
[Table]
2019 NYC Traffic Fatalities Map
The interactive map below highlights the traffic safety of NYC neighborhoods. Lighter pink indicates a decrease in the number of traffic fatalities from 2018 to 2019, whereas red indicates an increase in the number of traffic fatalities. You can click on the neighborhoods to learn more about the total number of motor vehicle collisions, the number of collisions/10,000 population, the total number of persons injured, fatalities, as well as year-over-year change.
Based on our analysis, while motor vehicle collisions went down in around 90% of NYC Neighborhoods, certain neighborhoods saw more casualties in 2019. The number of persons injured in traffic collisions rose in 77, or 41% of the neighborhoods and 31% of the neighborhoods experienced an increase in traffic deaths, including Hudson Yards-Chelsea-Flatiron-Union Square (+3), Sunset Park East (+2), Corona (+2), and Mount Hope (+3)
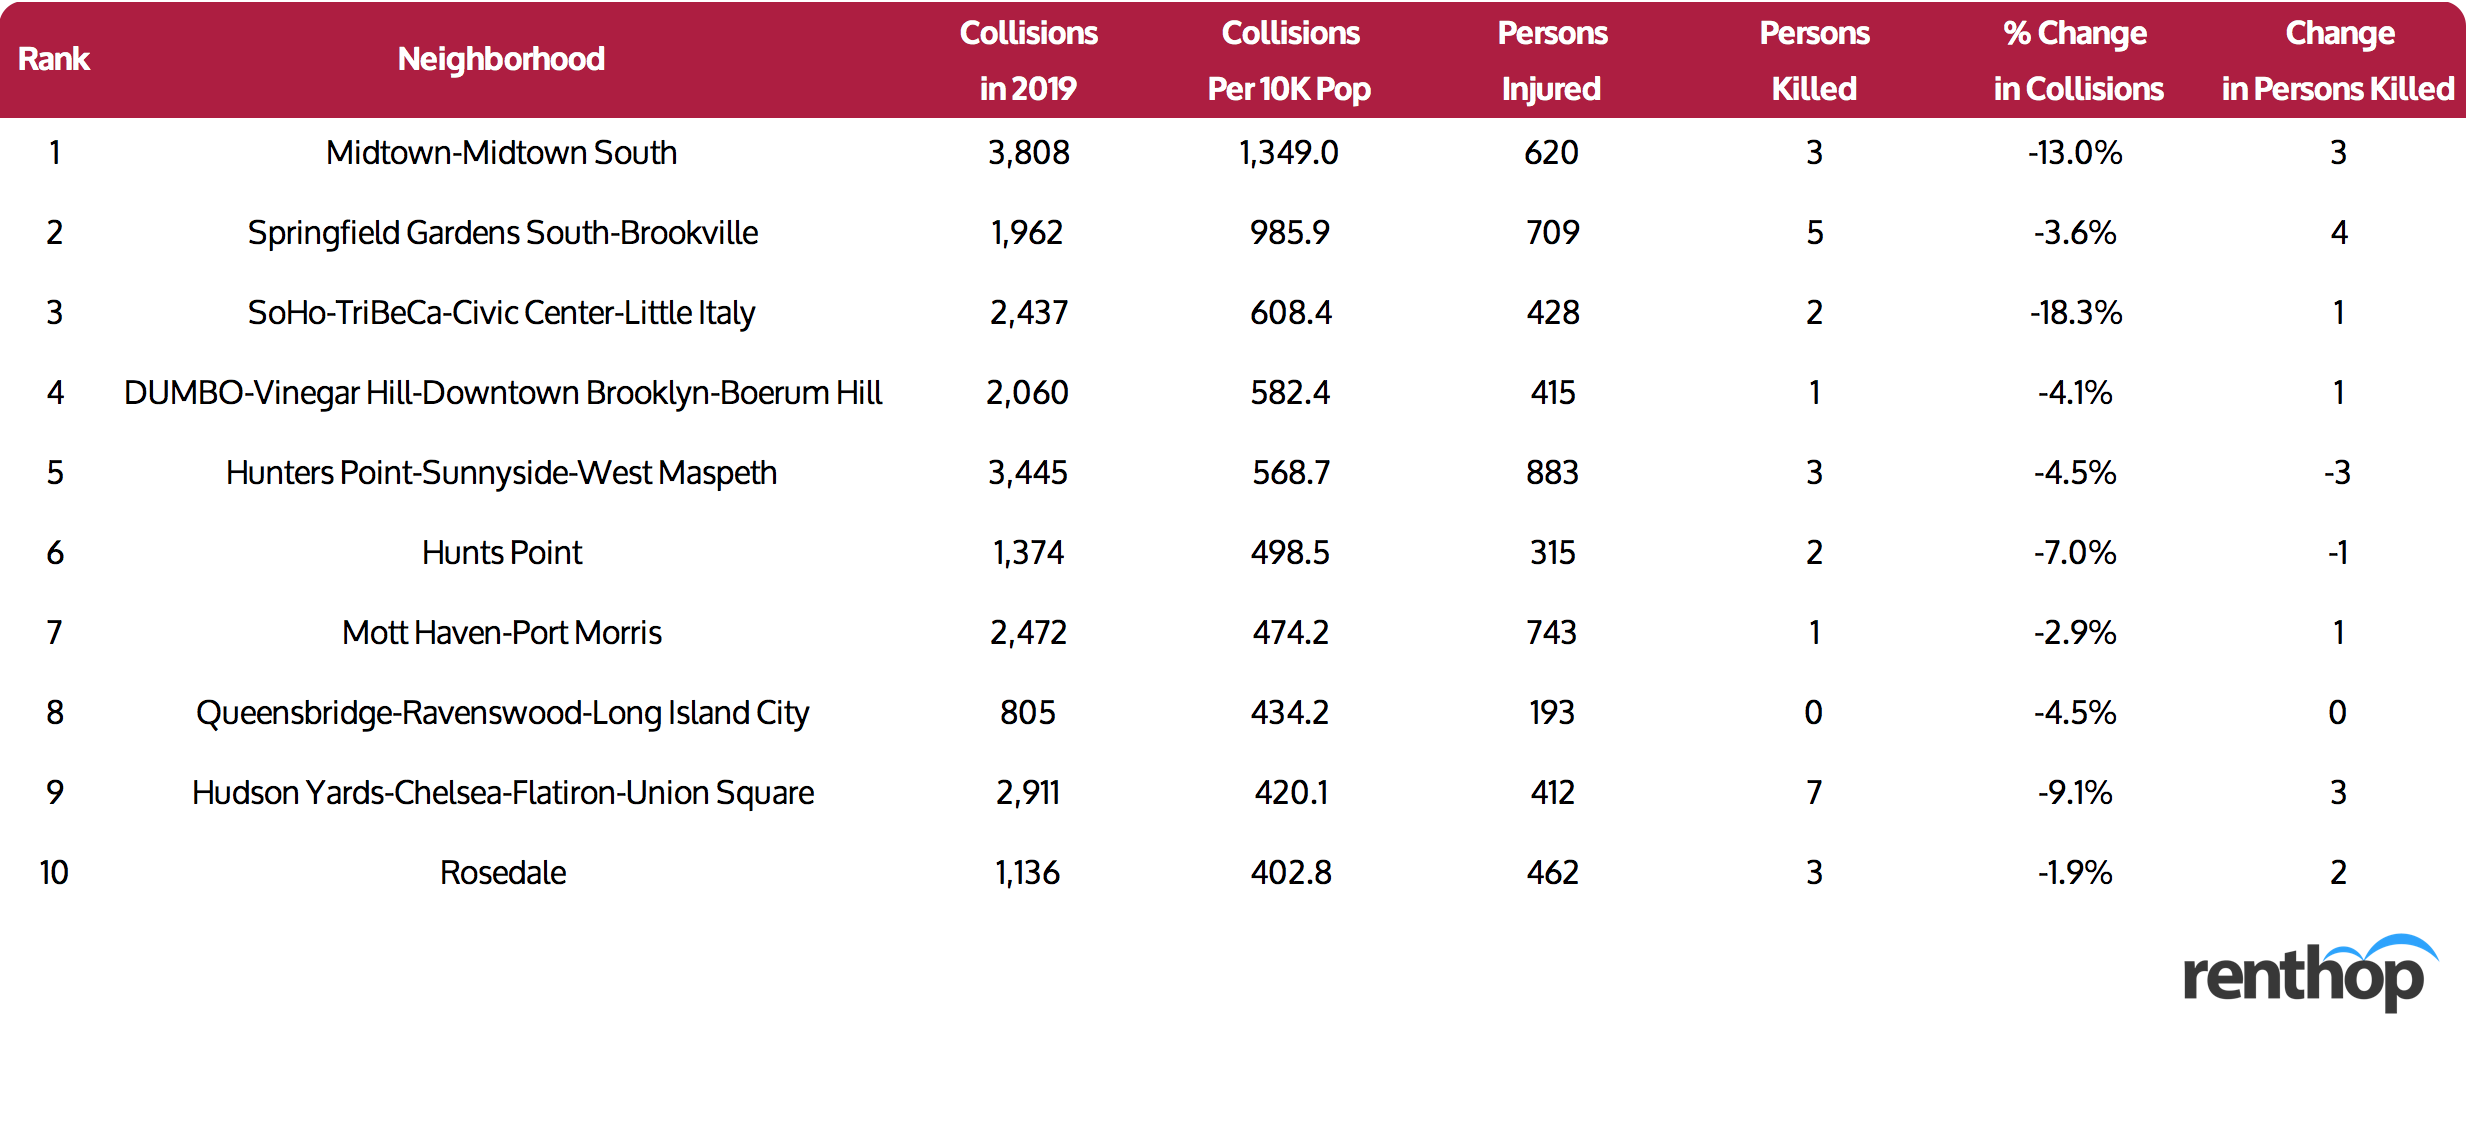
10 Neighborhoods with the Most Motor Vehicle Collisions
Midtown-Midtown East tops all neighborhoods as the area with the most collisions/10k population in 2019. The neighborhood, which plays an integral part of the NYC economic activities, saw 3,808 collisions in the past year, or 1,349/10k population, and while the number of collisions did go down by 13.0%, three people, unfortunately, were killed in the car crashes in Midtown-Midtown East.
Springfield Gardens South-Brookville, Queens, meanwhile, is catching up. In 2019, the neighborhood saw 985.9 collisions/10k population, only 3.6% down from 2018. It is worth noting that, while the normalized number of collisions is still lower than Midtown-Midtown East, Springfield Gardens South-Brookville had more persons injured in motor vehicle crashes in 2019, making it somewhat more dangerous than the busy city center.
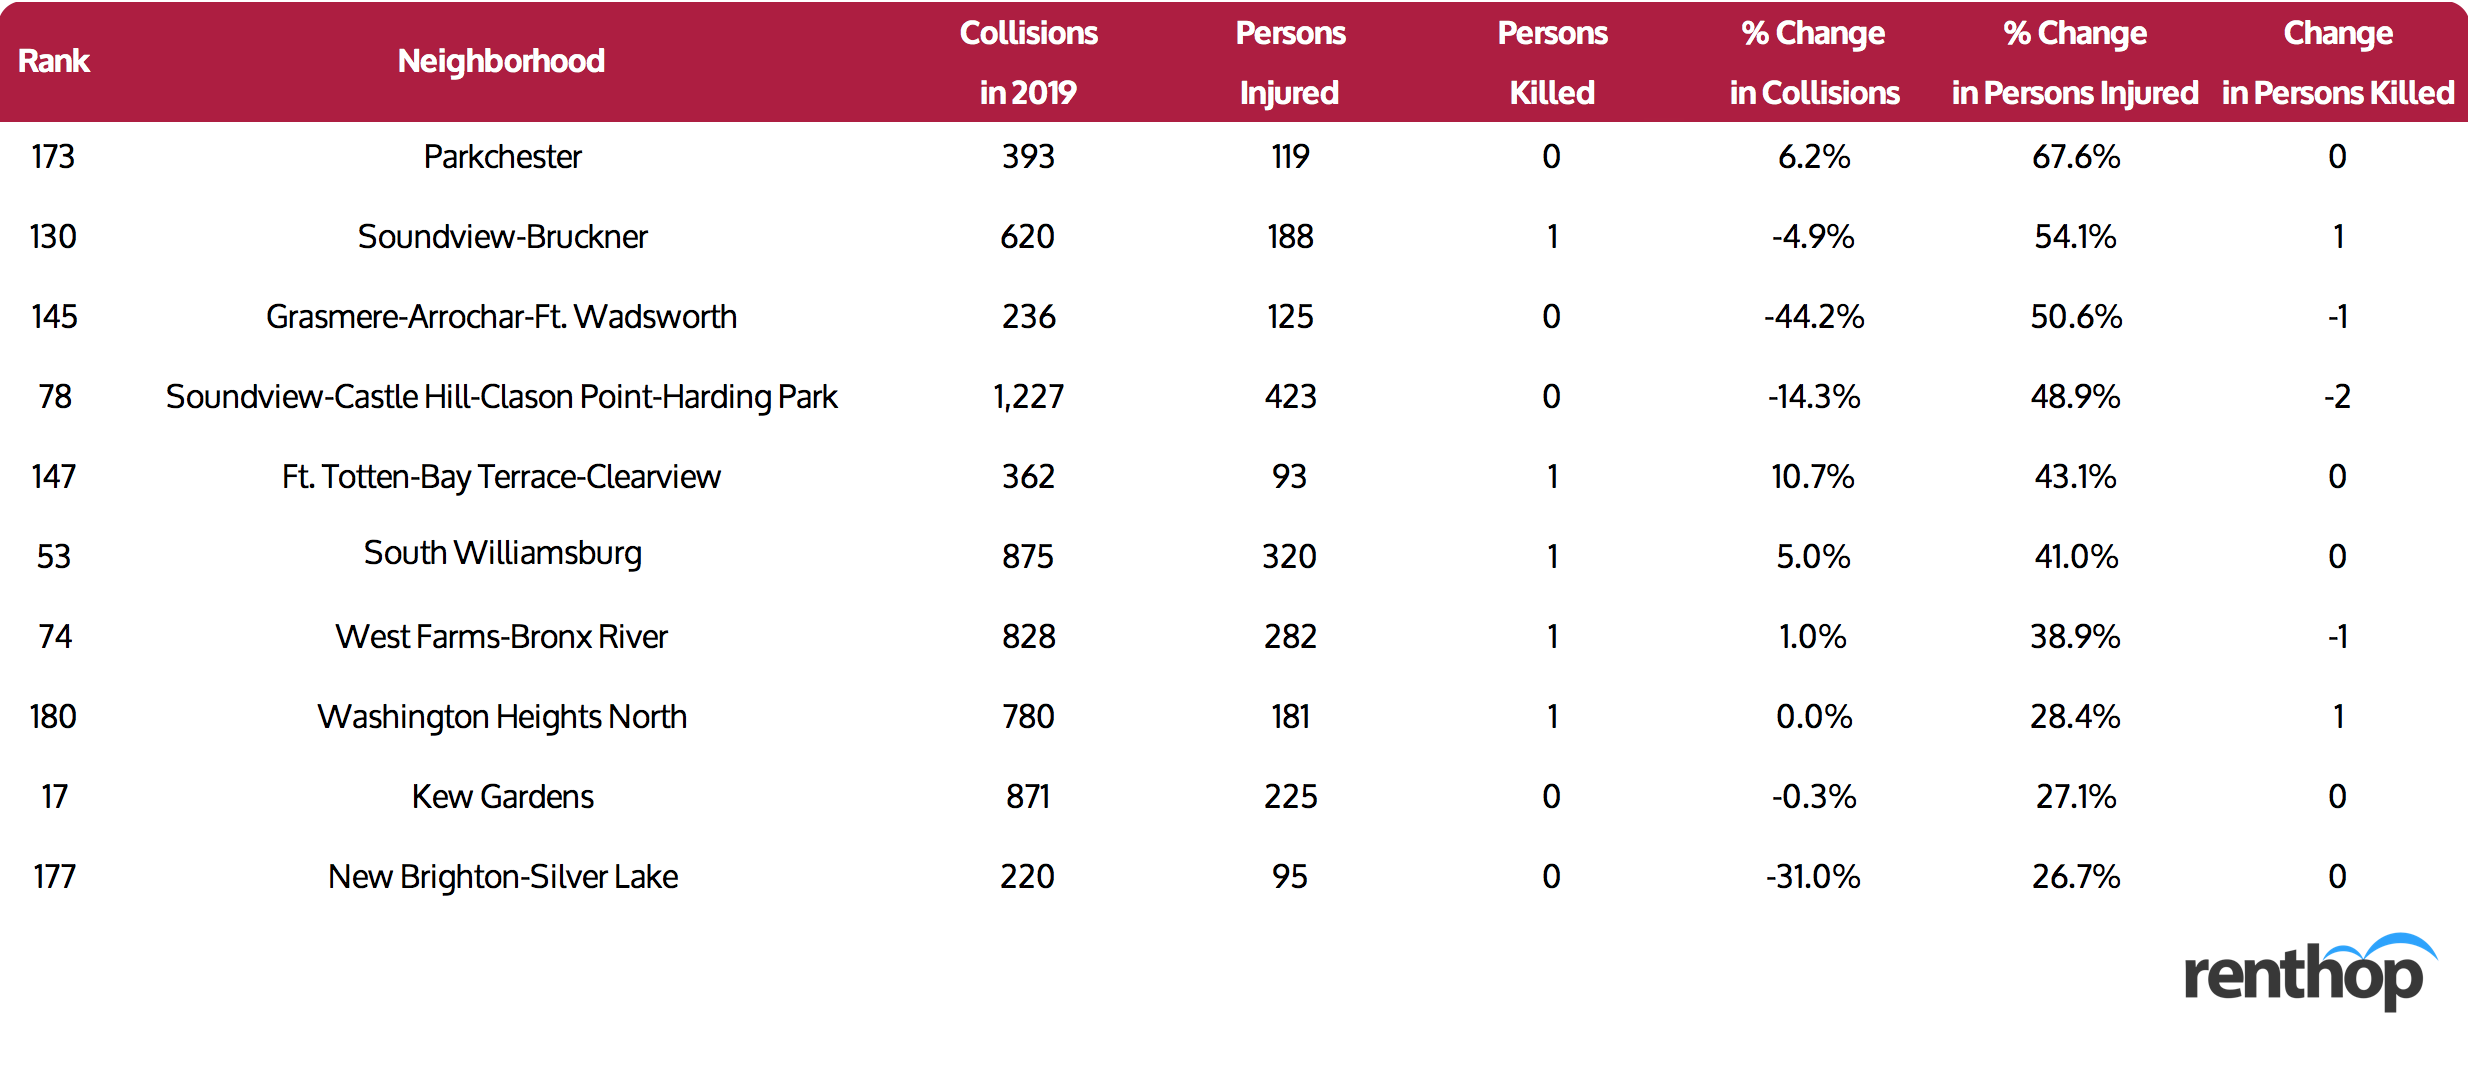
10 Neighborhoods with the Highest Increase in Persons Injured
Next, we move our focus onto persons injured in motor vehicle collisions by neighborhood and year-over-year changes among the numbers. While Parkchester only ranks 173 based on the number of collisions/10k population, the neighborhood saw a shocking 67.6% increase in persons injured, rising from 71 to 119 in 2019. Note that of the 10 neighborhoods with the highest increase in persons injured, four of the neighborhoods are located in the Bronx. Meanwhile, while the number of collisions remained steady in Washington Heights North, the number of persons injured went up 28.4% from 141 in 2018 to 181 in 2019.
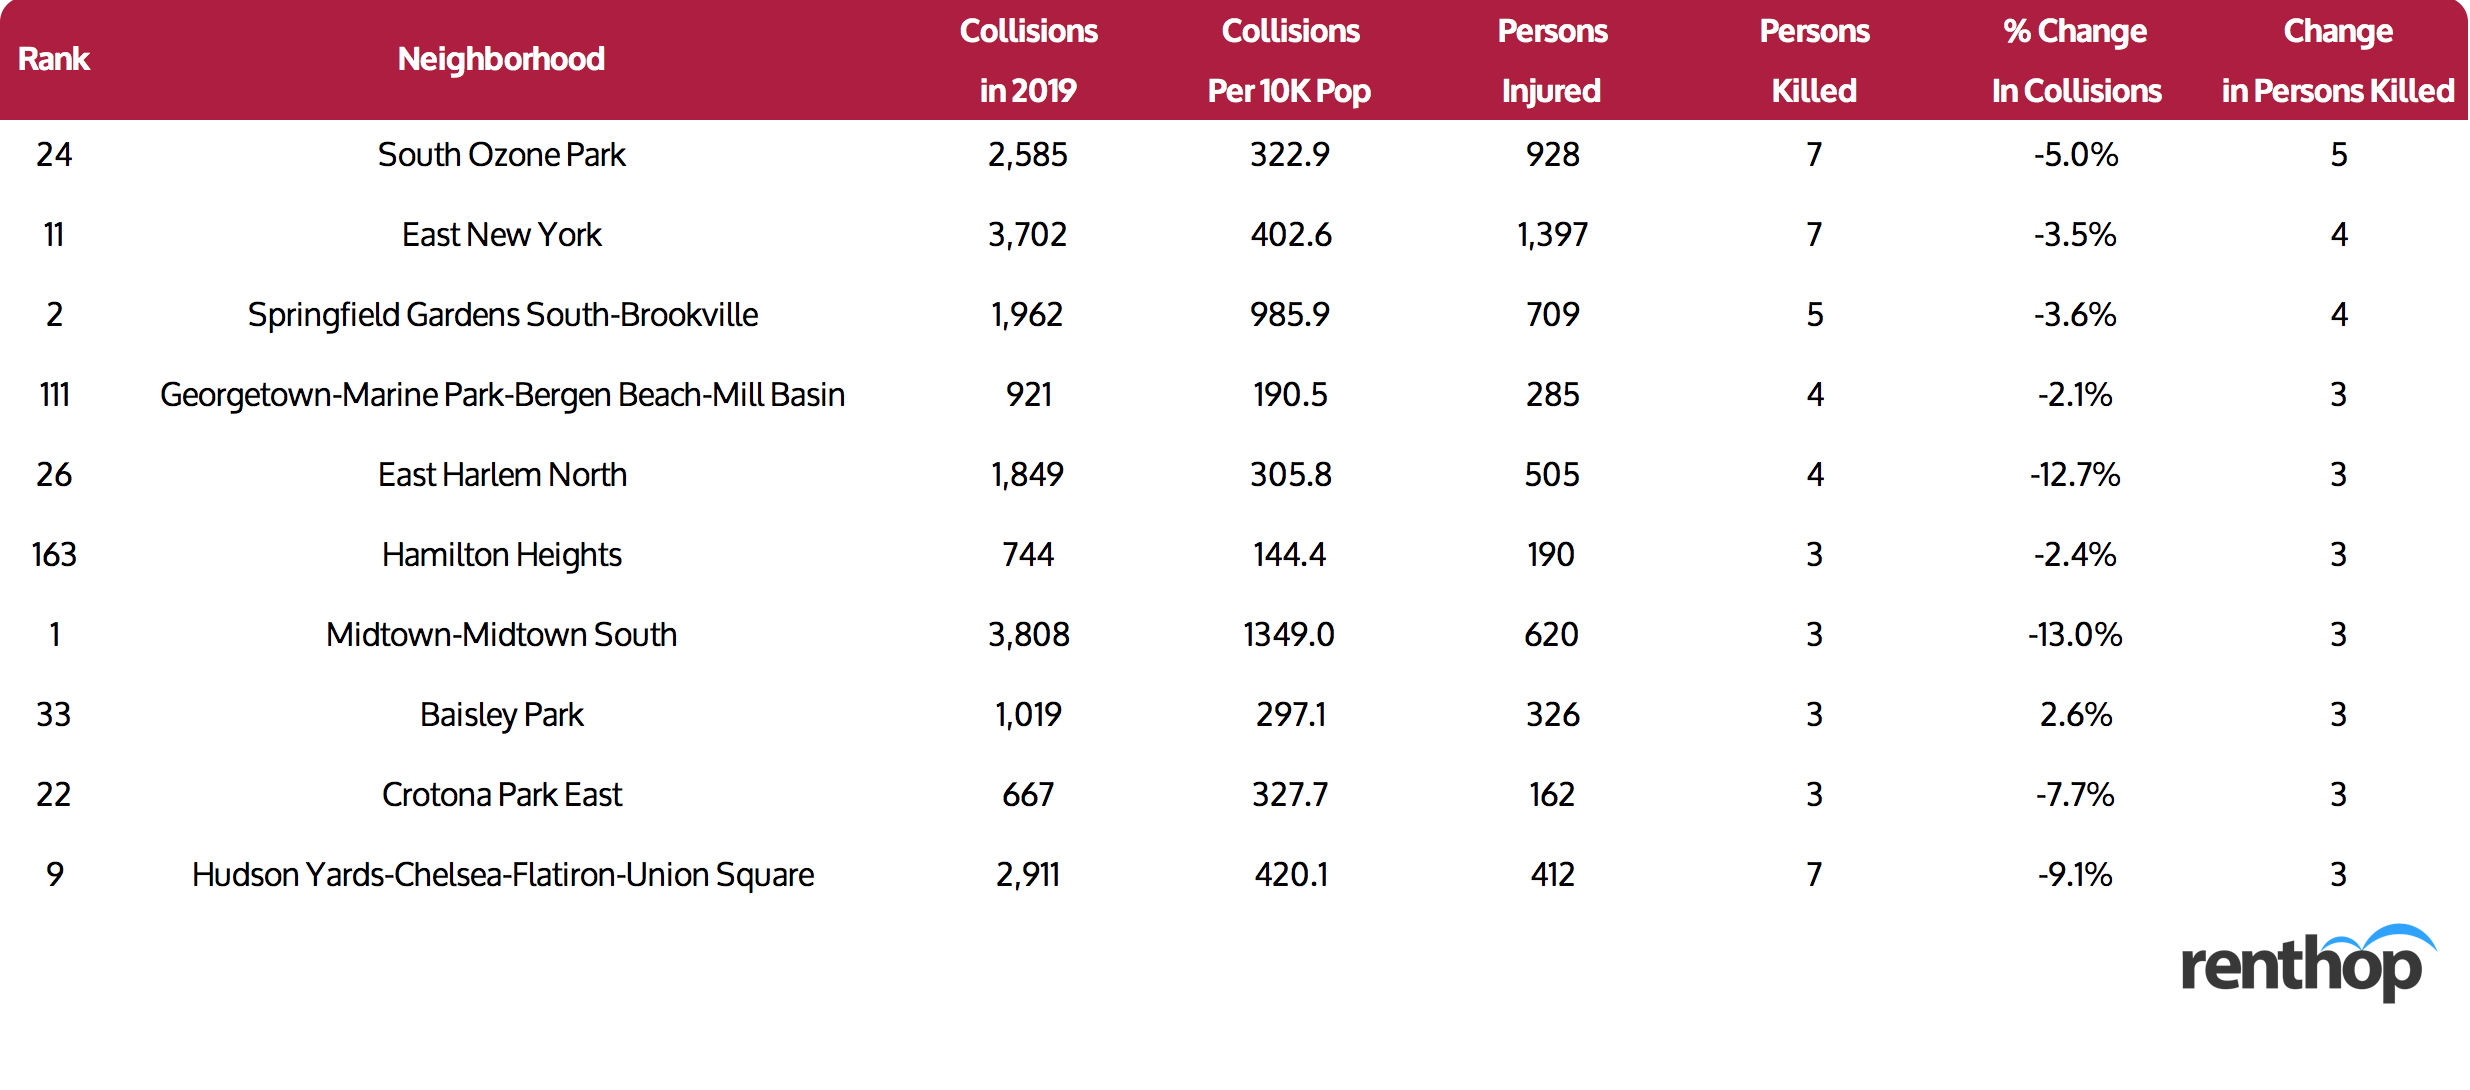
10 Neighborhoods with the Highest Increase in Persons Killed
As for traffic fatalities, South Ozone Park tops all other neighborhoods with a total of 7 deaths in 2019, a 250% jump from 2018. In East New York, Brooklyn, the number of persons killed rose from three to seven with well over 1,300 people injured in motor vehicle crashes the past year. Hudson Yards-Chelsea-Flatiron-Union Square, which includes some of the most popular and robust neighborhoods in New York City, was not spared. The area saw 2,911 motor vehicle collisions, through which seven people were killed, compared to four people in 2018, and this translates to a 75% increase.
Are there Any Patterns?
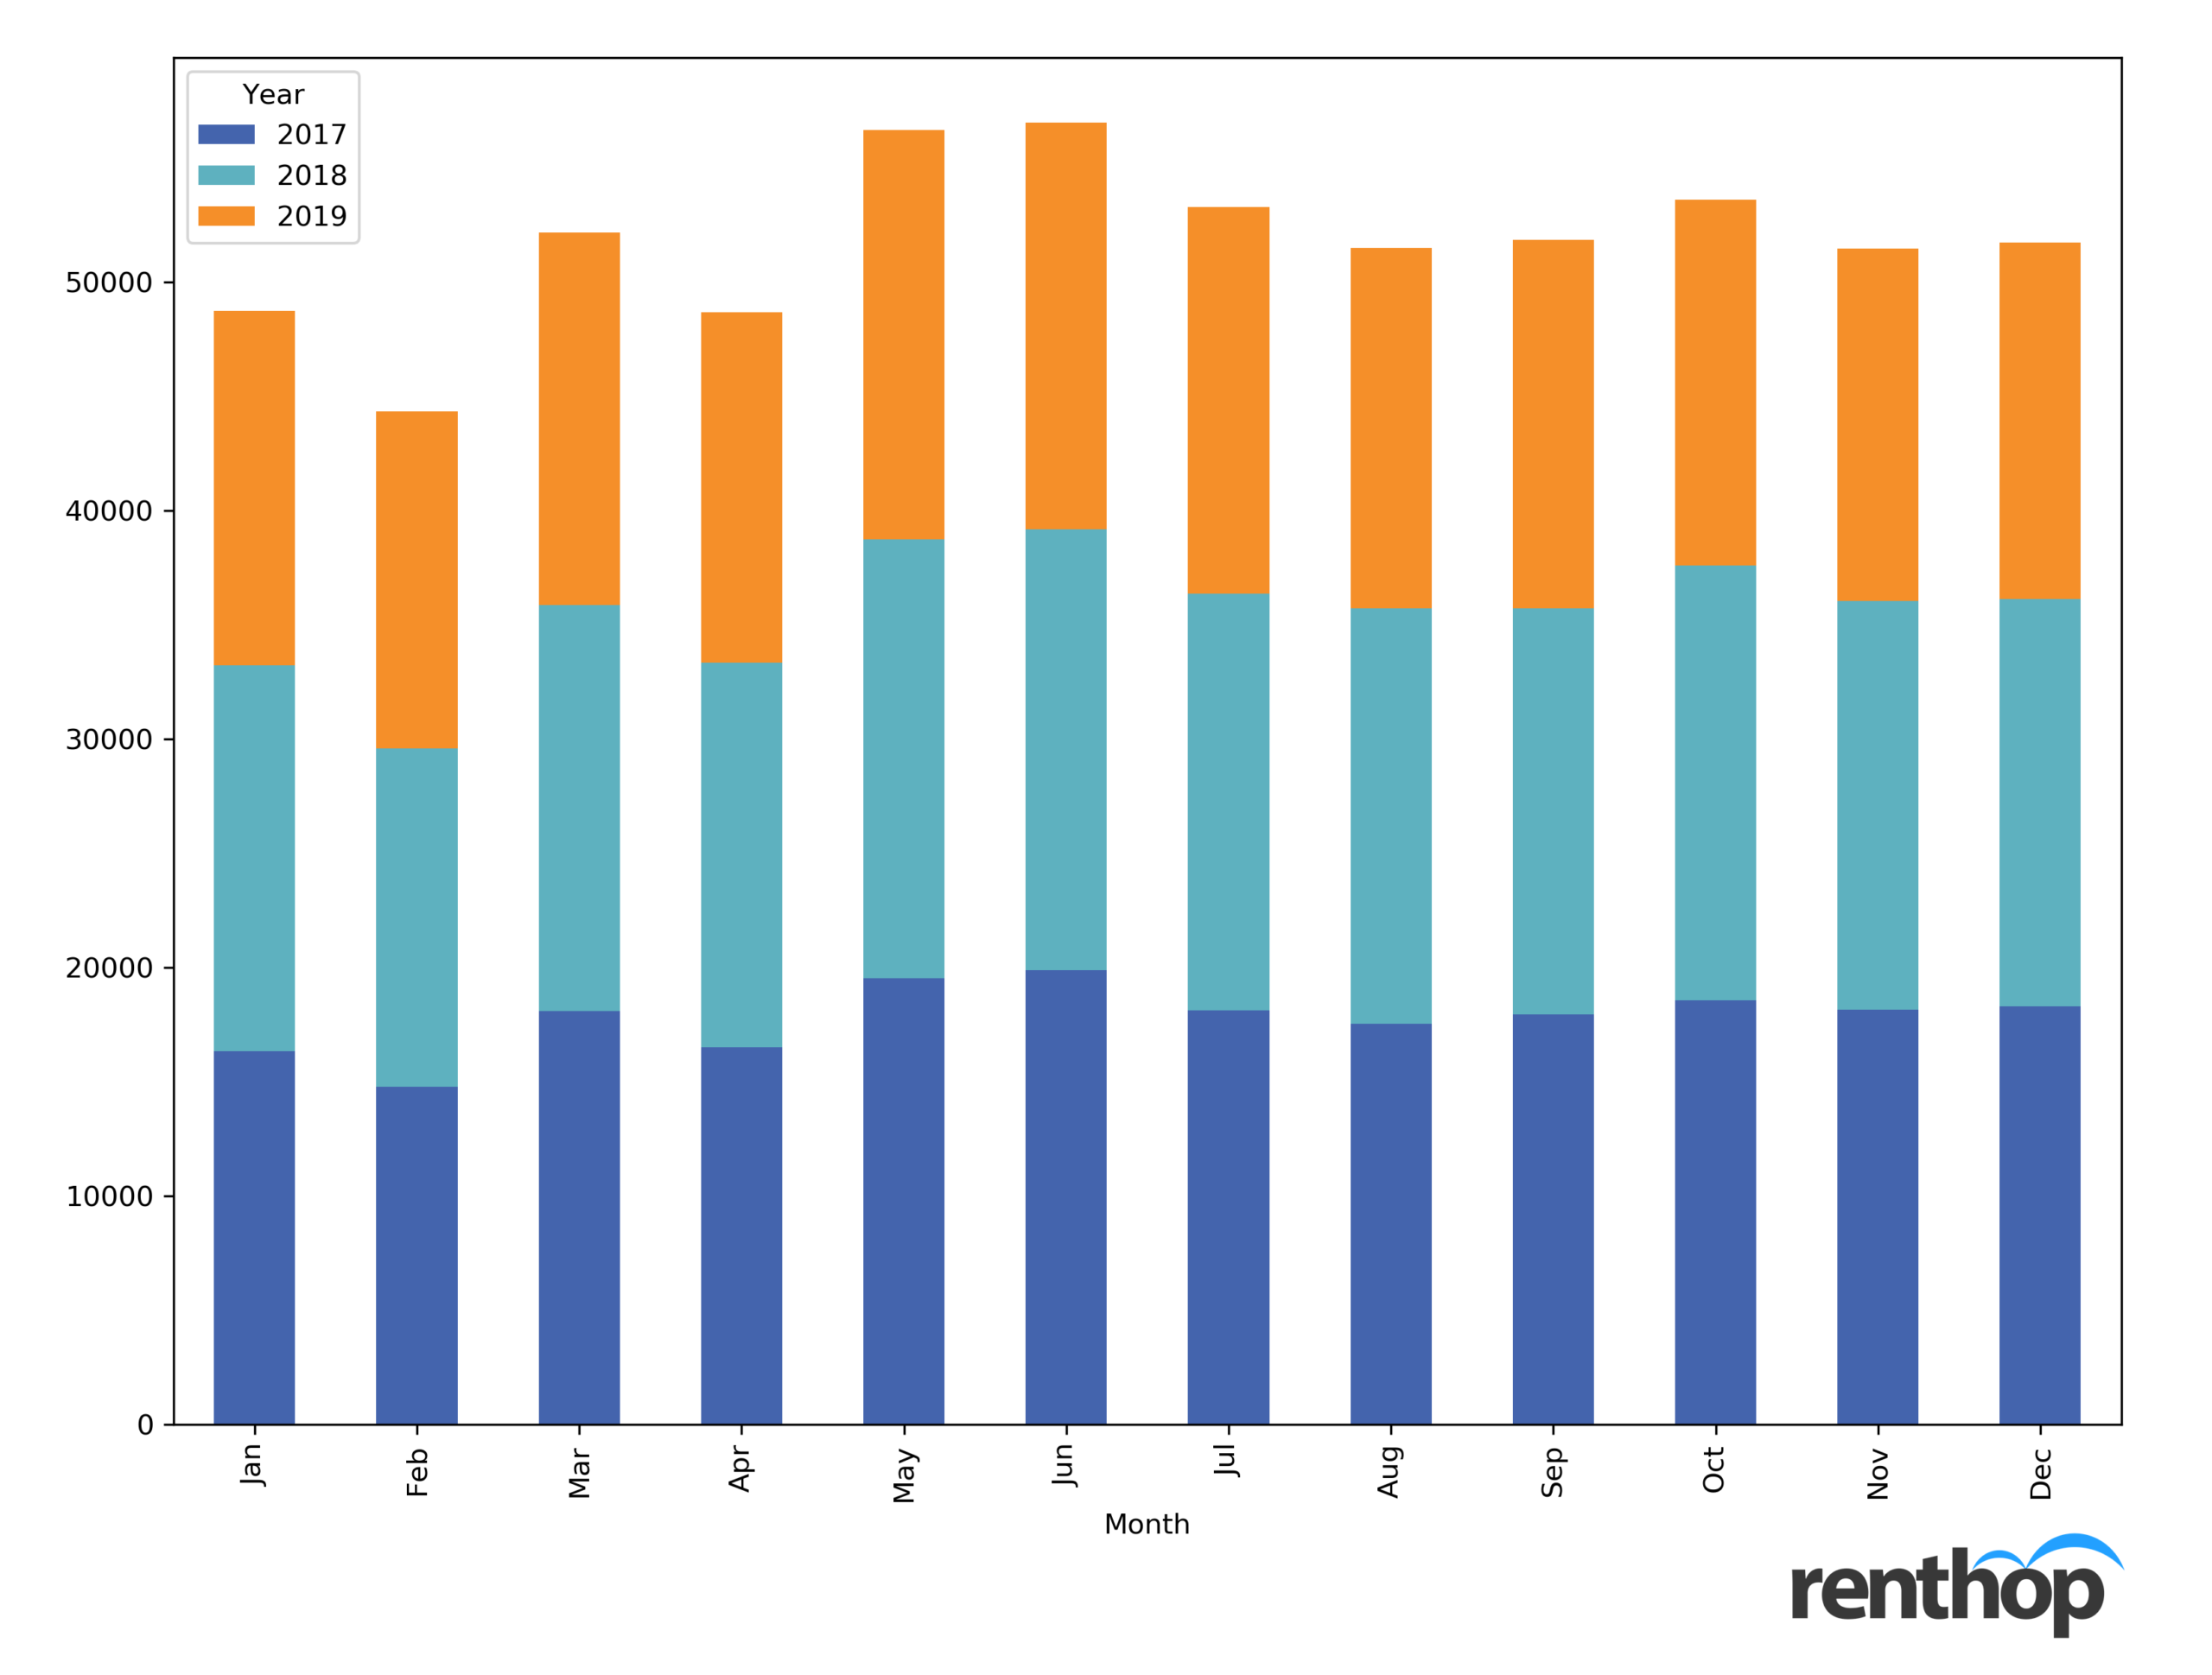
When Do Traffic Collisions Occur?
In addition to analyzing the locations of the traffic collisions and deaths, we also looked into when they occur. Figure 1 below shows the number of collisions from 2017 to 2019 broken down by months. While there’s no obvious seasonality in terms of when collisions occurred more often, we did notice more motor vehicle collisions between June and July. We also found that more collisions occurred in the afternoon (12 PM – 5 PM) in the year 2019 (see Figure 2) So, if you enjoy outdoor walking during summertime, be sure to avoid dangerous intersections, and don’t forget your helmet if you are a biker!
Are the Numbers of Collisions Related to Rent?
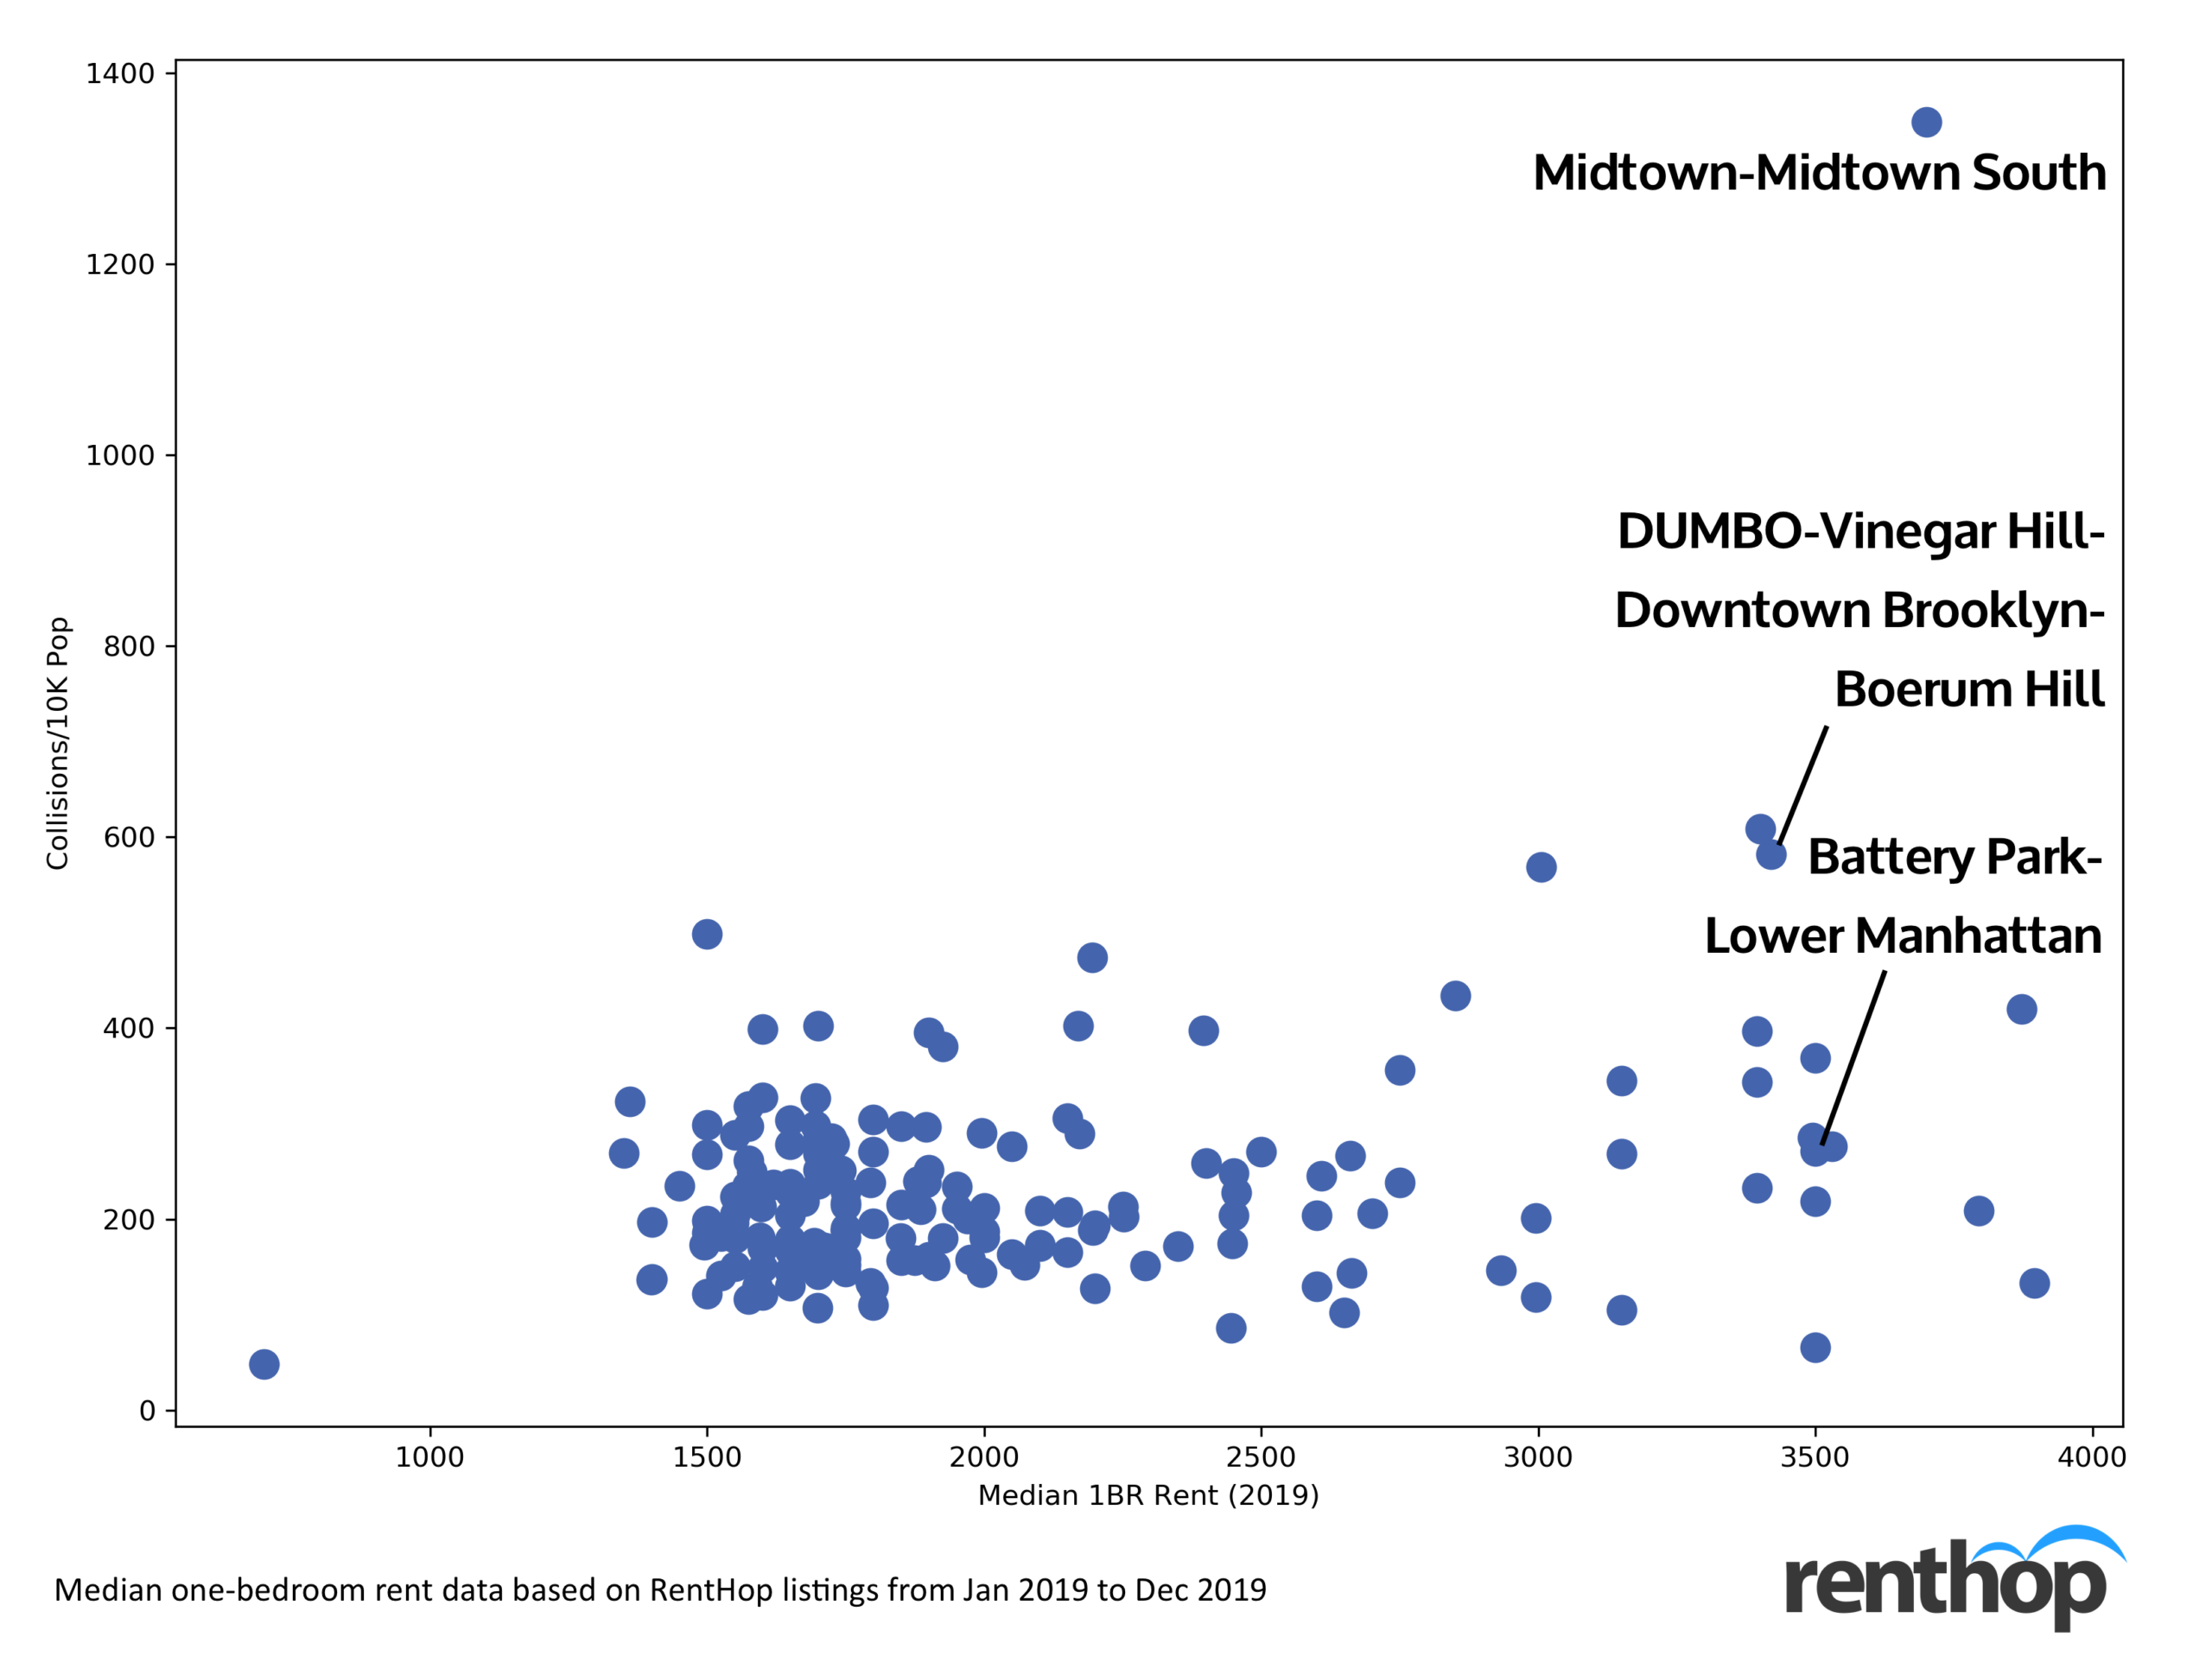
We also looked into the correlation between median one-bedroom rent and the number of collisions/10k population and found a slight positive correlation (r-squared = 0.11). It seems that in the City of New York, the city center and parts of Brooklyn are more crowded due to economic activities and therefore have more collisions. Apartments in these neighborhoods, thanks to the prime location, tend to enjoy higher rental rates, but this does not explain all NYC neighborhoods.
How We Did It
To better understand traffic safety in New York City, we at Renthop analyzed motor vehicle collisions data made public by the NYC Open Data Portal. We first geocoded each record using the Neighborhood Tabulation Area shapefile (NTAs) and then normalized the data using the NTA population count so we could fairly rank each neighborhood.
Why We Did It
In many ways, living in New York City is a blessing, and it’s not just because all the Broadway shows and how pet-friendly everyone is even though we can be grumpy towards each other. The City offers great mobility and gives renters as well as homeowners the ability to live in their dream homes and commute to the city center for work without being worried about getting stuck in traffic for hours (yes, Bay Area). But the busy lifestyle and robust economy in New York also have their externalities, and one of them is traffic safety. In some cases, drivers settle the problems without anyone getting hurt; in other cases, pedestrians and cyclists are the ones bearing the brunt.
By adopting a data-driven approach to collisions and traffic fatalities, we hope to not only help renters and homebuyers identify potential safety issues they might face in their neighborhood but also generate awareness on traffic deaths. After all, each data point we included in this study represents one life, and that could be our coworkers, friends, or family.


