How COVID-19 is Changing Renter Neighborhood Preferences in NYC
The COVID-19 pandemic has impacted NYC more than any place in the country. Given the unprecedented health, economic, and social disruptions inflicted upon the city, it should come as no surprise that NYC apartment hunters are changing their preferences as to where to live. As one of the city’s largest apartment rental platforms, RentHop possesses a massive data set of rental leads giving us a unique insight into where prospective tenants are looking to rent in the current environment. In this quarterly report, we’ll analyze the trends in each borough, highlighting the neighborhoods seeing the greatest increases and decreases in leads year-over-year.
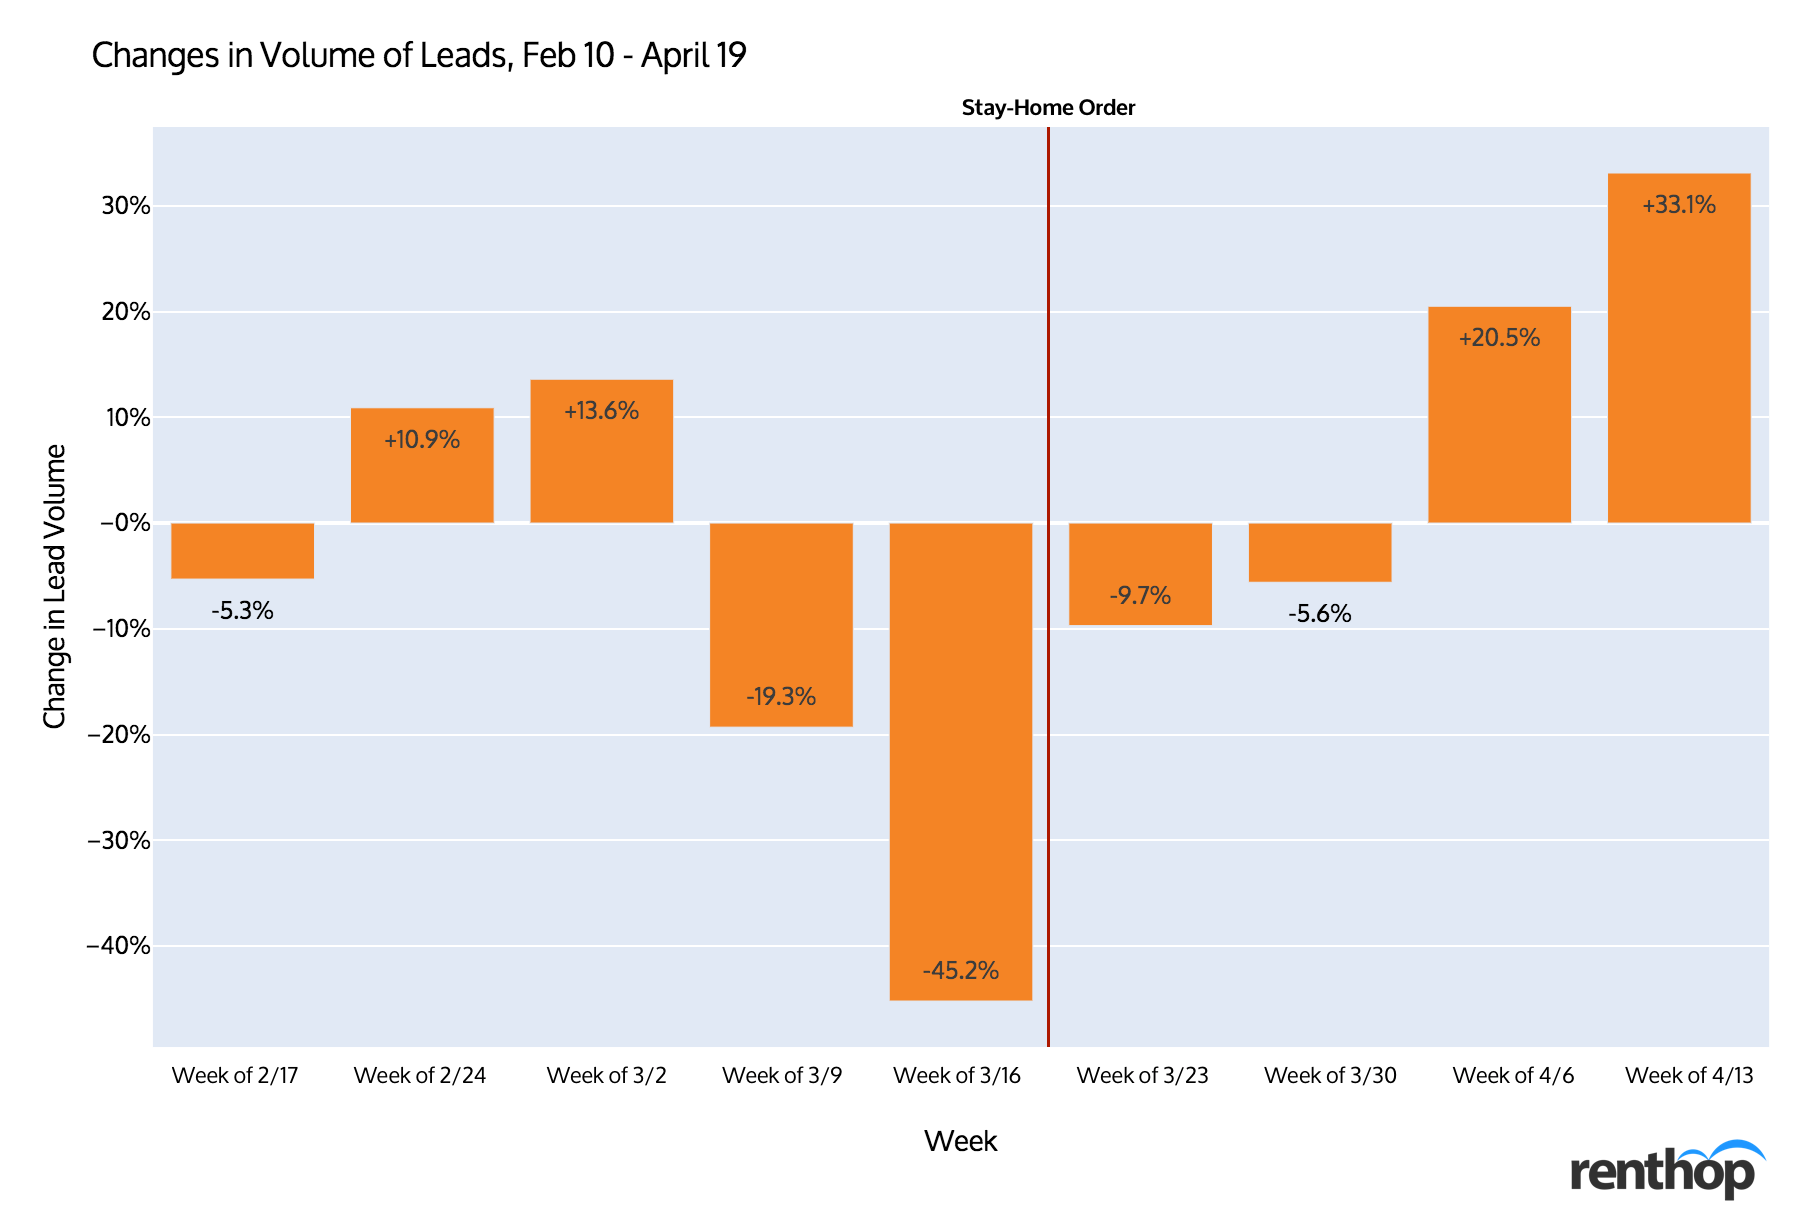
Overall Lead Traffic Decline and Resurgence Since COVID-19
On March 20, Governor Cuomo ordered all non-essential businesses to close, and for residents to stay home as much as possible in an effort to stop the spread of the coronavirus. Not surprisingly, from March 23 through April 5 there was a dramatic decrease in average daily renter leads sent on RentHop.
By the numbers, the period of March 13 through March 22 saw a 45% drop in weekly lead count compared to the weekly leads sent by renters from February 10 through March 15. In other words, renters stopped looking for apartments in unprecedented numbers. This downward trend continued through the rest of March and into April.
However, this trend rapidly reversed by mid-April. The week of April 13 through April 19 saw a whopping 56% increase in weekly leads over the period March 23 through April 5. And this upward trend appears to be accelerating as a growing number of renters are more eager than ever to move out of the apartments they’ve been spending so much time within during the lockdown.
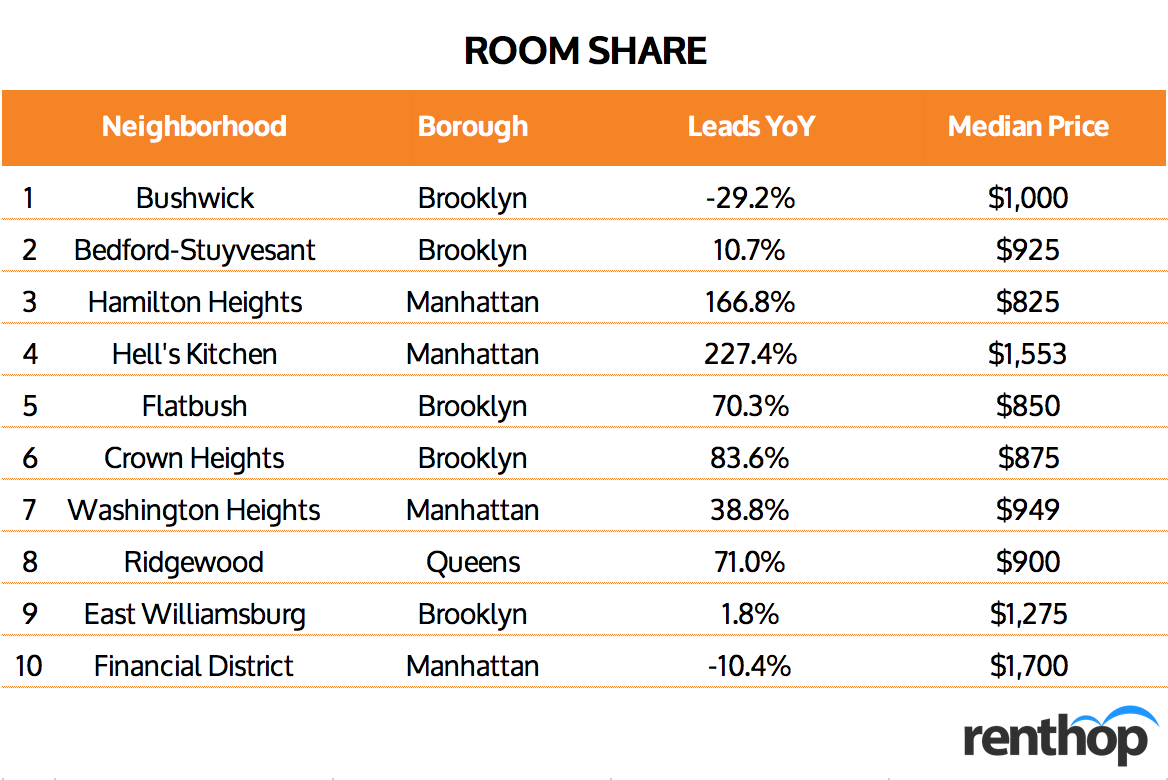
Increased Demand for Roommates
As the economic crunch caused by the pandemic is felt by New Yorkers, there appears to be an upward trend toward renters looking to move into a roommate situation rather than lease their own apartment.
Looking at the top 10 neighborhoods measured by roommate leads in NYC, eight out of the 10 neighborhoods saw significant year-over-year increases in renters inquiring about room shares. For example, Hell’s Kitchen saw a 227.4% increase in roommate leads, Hamilton Heights saw a 166.8% jump, and in Crown Heights, the number of room share inquiries went up by 83.6%.
Most Popular NYC Neighborhoods by Renter Inquiries
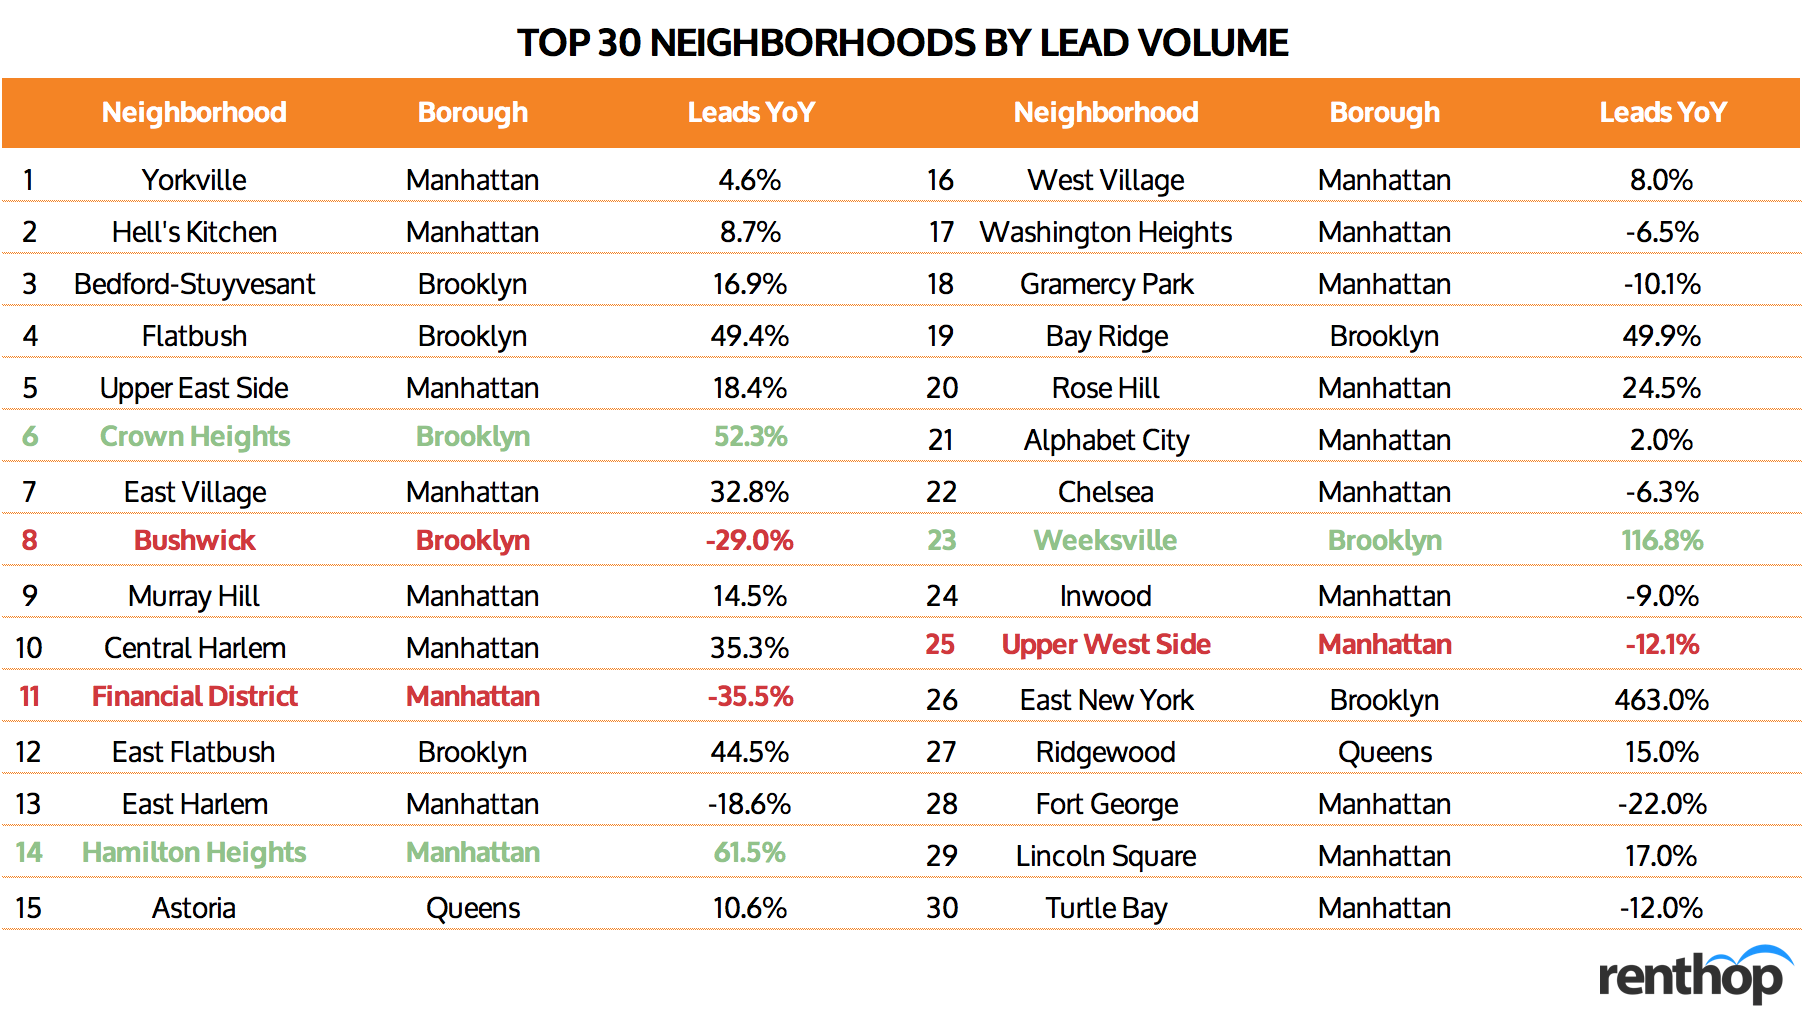
Top Growing Neighborhoods
With respect to renters seeking full apartments, certain popular neighborhoods have seen an outsized increase in renter leads year-over-year from the first quarter of 2019 to the first quarter of 2020. Looking at the most inquired about neighborhoods, the neighborhoods with the highest growth appear concentrated in Brooklyn and Manhattan, with Weeksvillle seeing a 116.8% increase in leads, Crown Heights a 52.3% increase, and Bay Ridge a 49.9% increase. Flatbush also saw a 49.4% jump in leads in the first quarter of 2020 compared to the same period in 2019. In Manhattan, Hamilton Heights saw a 61.5% increase and Central Harlem a 35.3% increase. Meanwhile, lead volume in the East Village grew 32.8% year-over-year.
Top Declining Neighborhoods
At the same time, many popular neighborhoods in the city have seen a substantial decrease in renter leads year-over-year in the first quarter of 2020. The majority of these large declining neighborhoods are concentrated in Manhattan, with the Financial District seeing a 35.5% decrease,East Harlem a 18.6% decrease, and the Upper West Side a 12.1% decrease. Lead also dipped 10.1% in Gramercy Park. Meanwhile, Bushwick, the hip and artsy neighborhood in Brooklyn, saw a 29% reduction in lead volume year-over-year.
Top 10 Neighborhoods By Borough
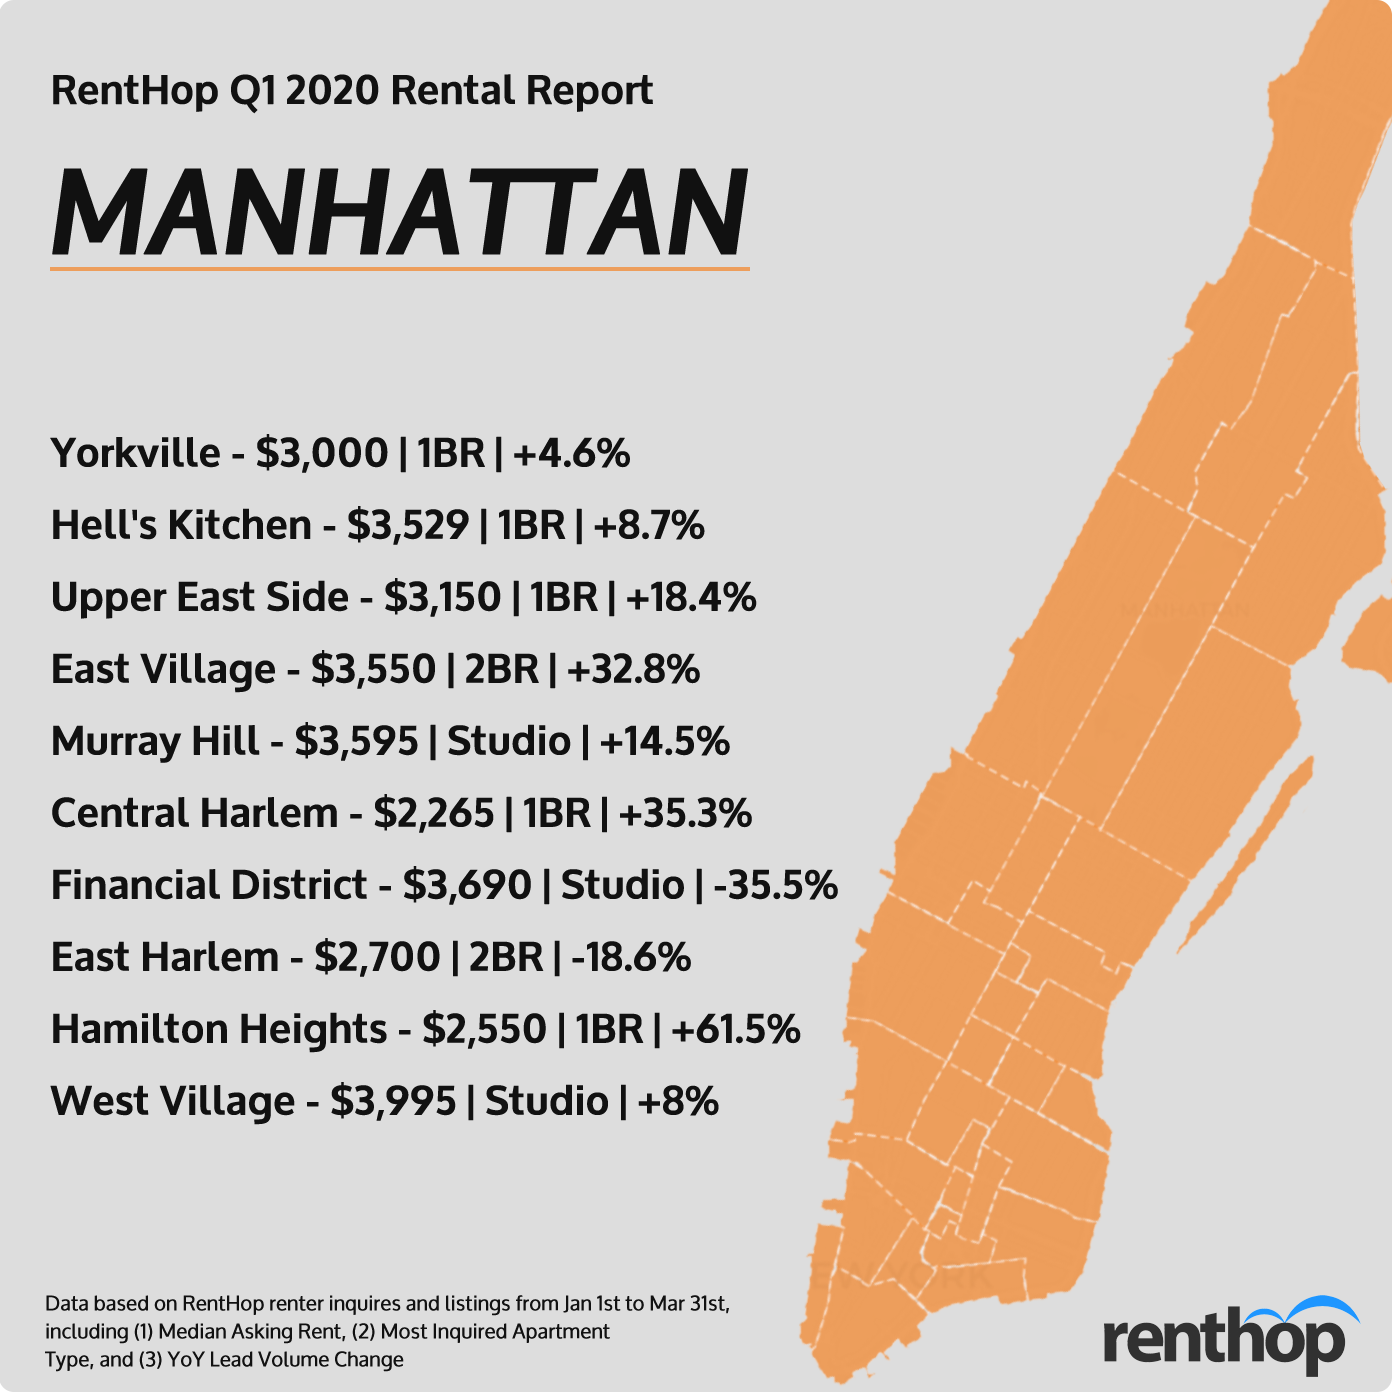
Of these popular neighborhoods in Manhattan, the most notable increases in year-over-year leads were seen in Hamilton Heights (+61.5%), Central Harlem (+35.3%), the East Village (+32.8%), and the Upper East Side (+18.4%). The two declining neighborhoods were the Financial District (-35.5%) and East Harlem (-18.6%).
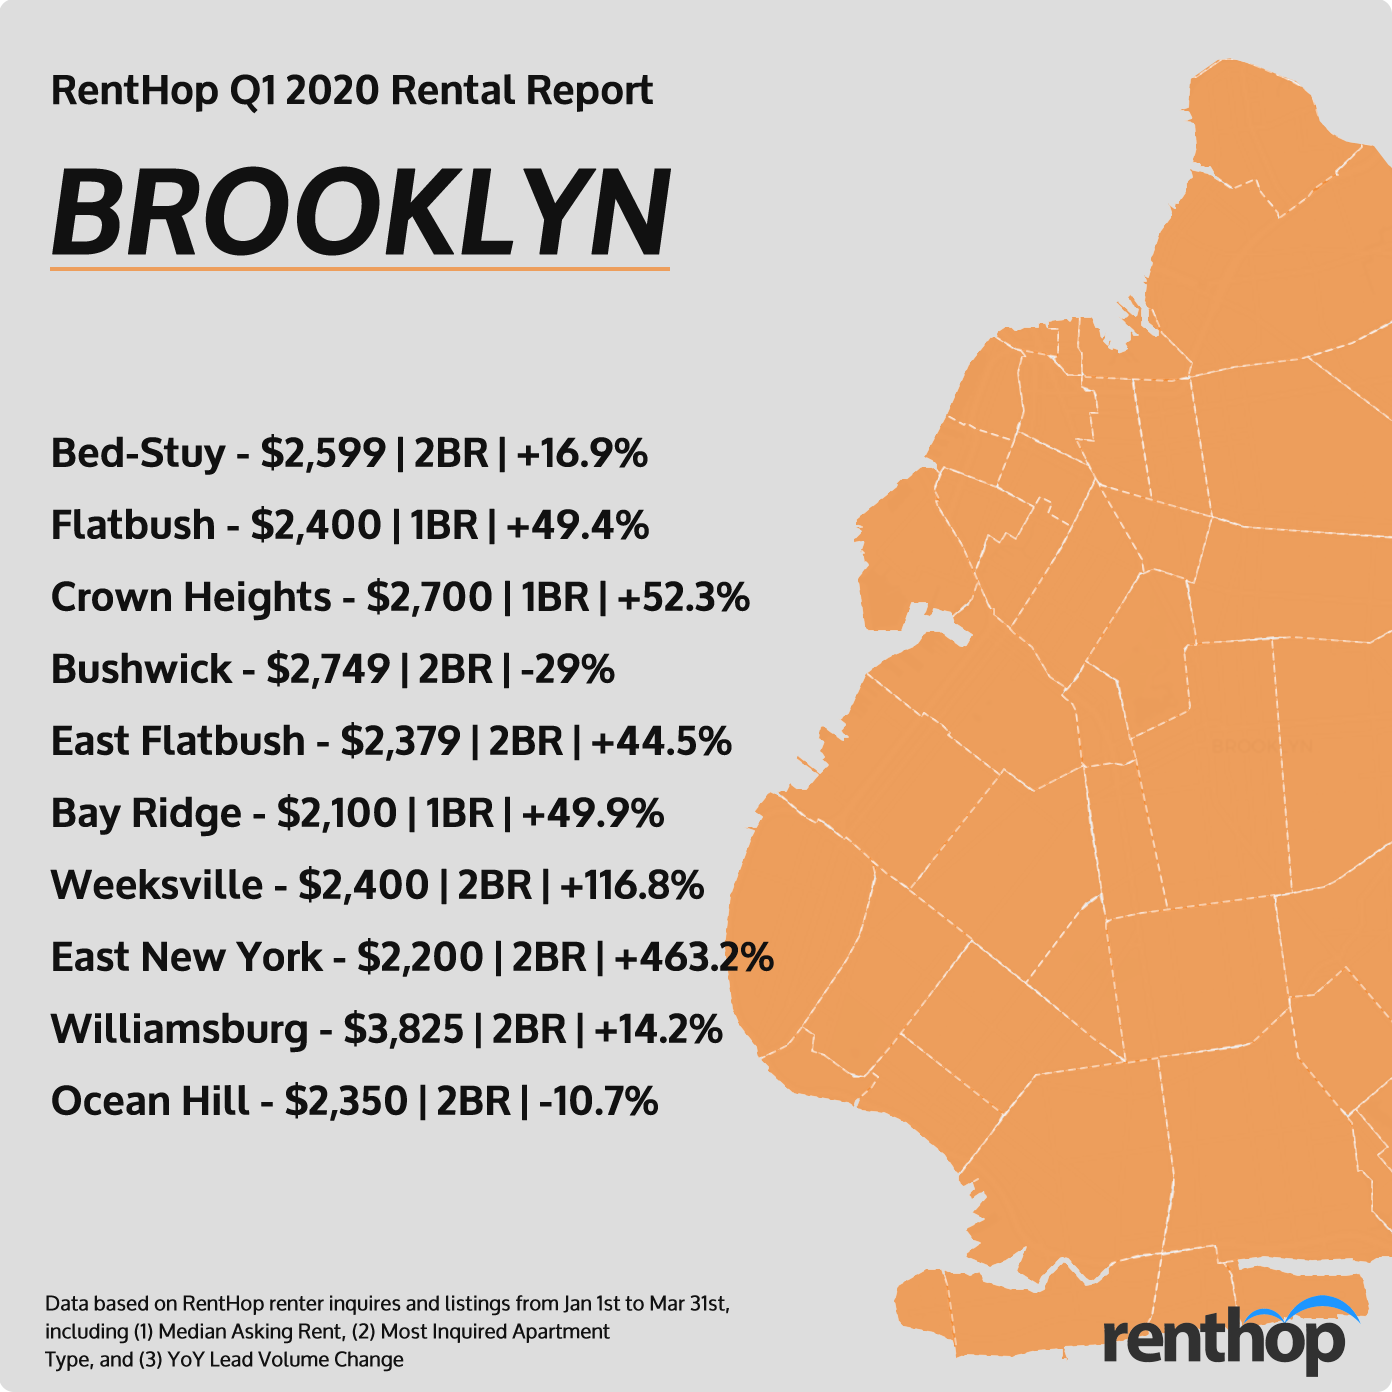
8 out of 10 of the most popular neighborhoods in Brooklyn saw an increase in year-over-year lead traffic, the most notable increases in leads were seen in East New York (+463.2%), Weeksville (+116.8%), Crown Heights (+52.3%), Bay Ridge (+49.9%) and Flatbush (+49.4%). The lone declining neighborhoods were Bushwick (-29%) and Ocean Hill (-10.7%).
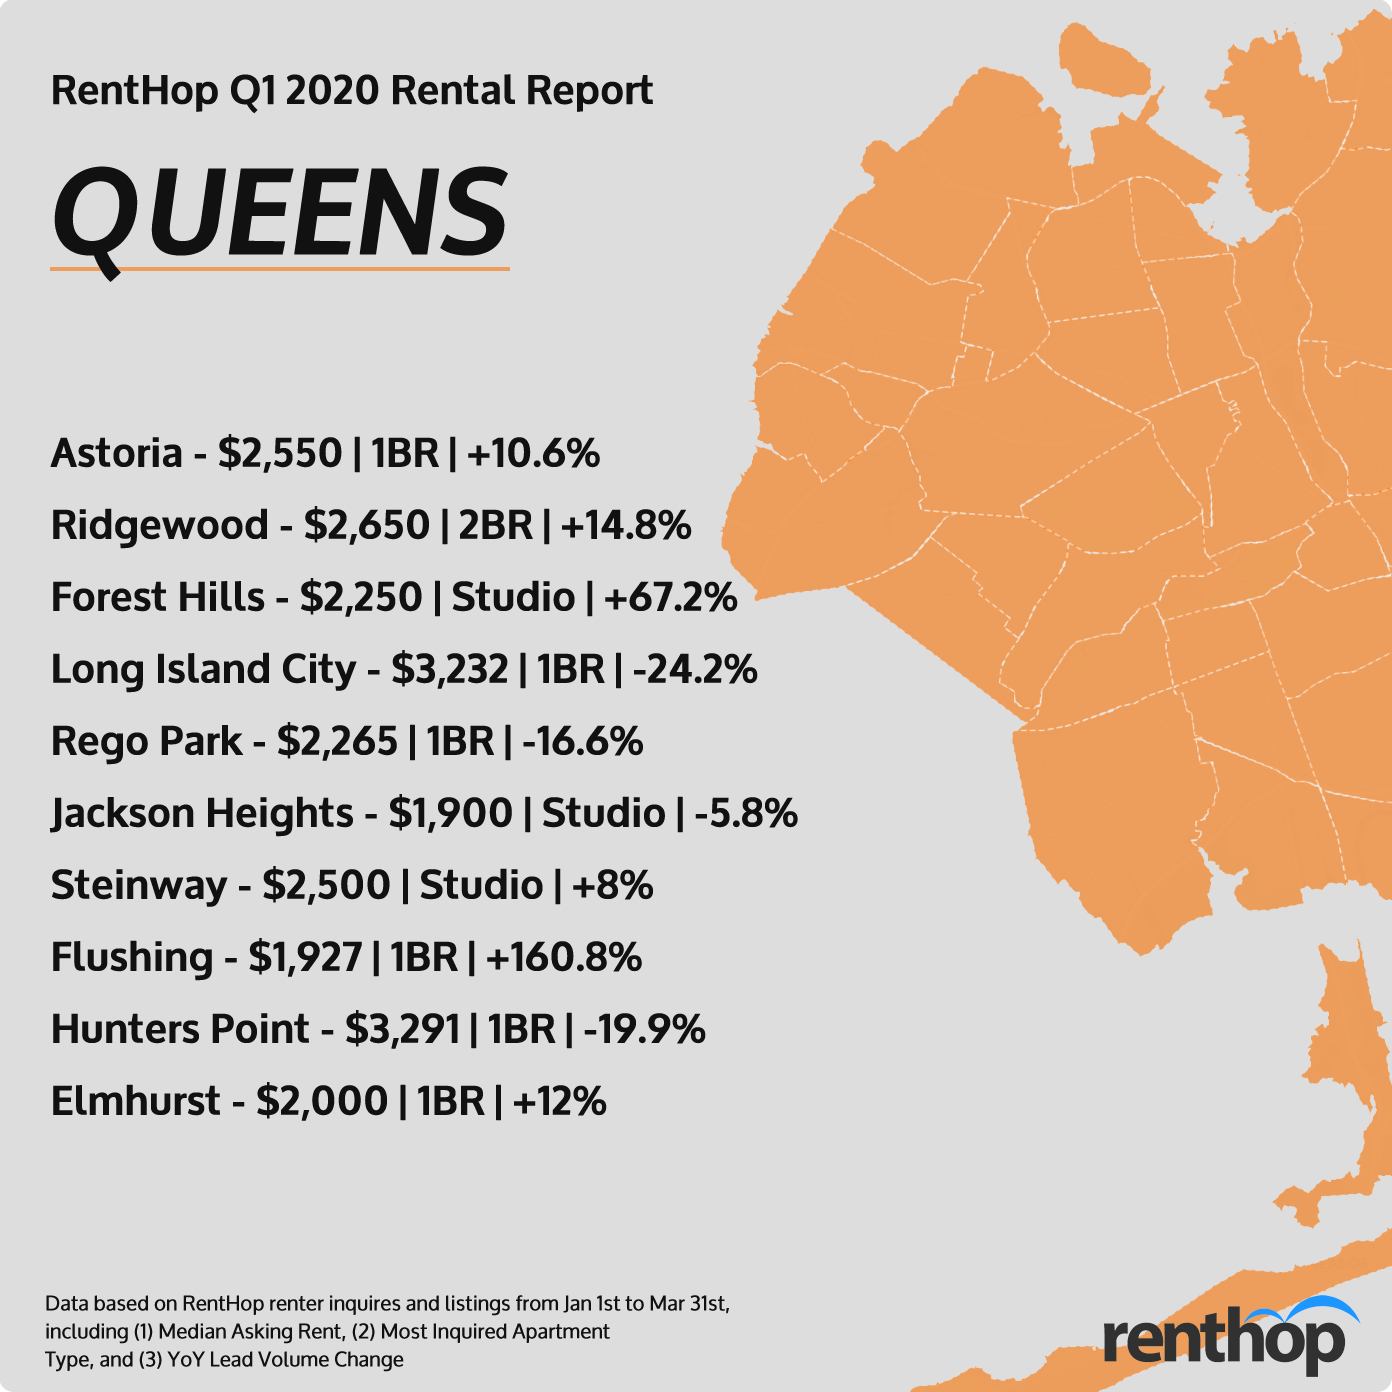
Most of the neighborhoods in Queens saw relatively little change year-over-year compared to Brooklyn in Queens, with the exceptions of Flushing (+160.8%), Forest Hills (+67.2%), Long Island City (-24.2%), and Hunters Point (-19.9%).
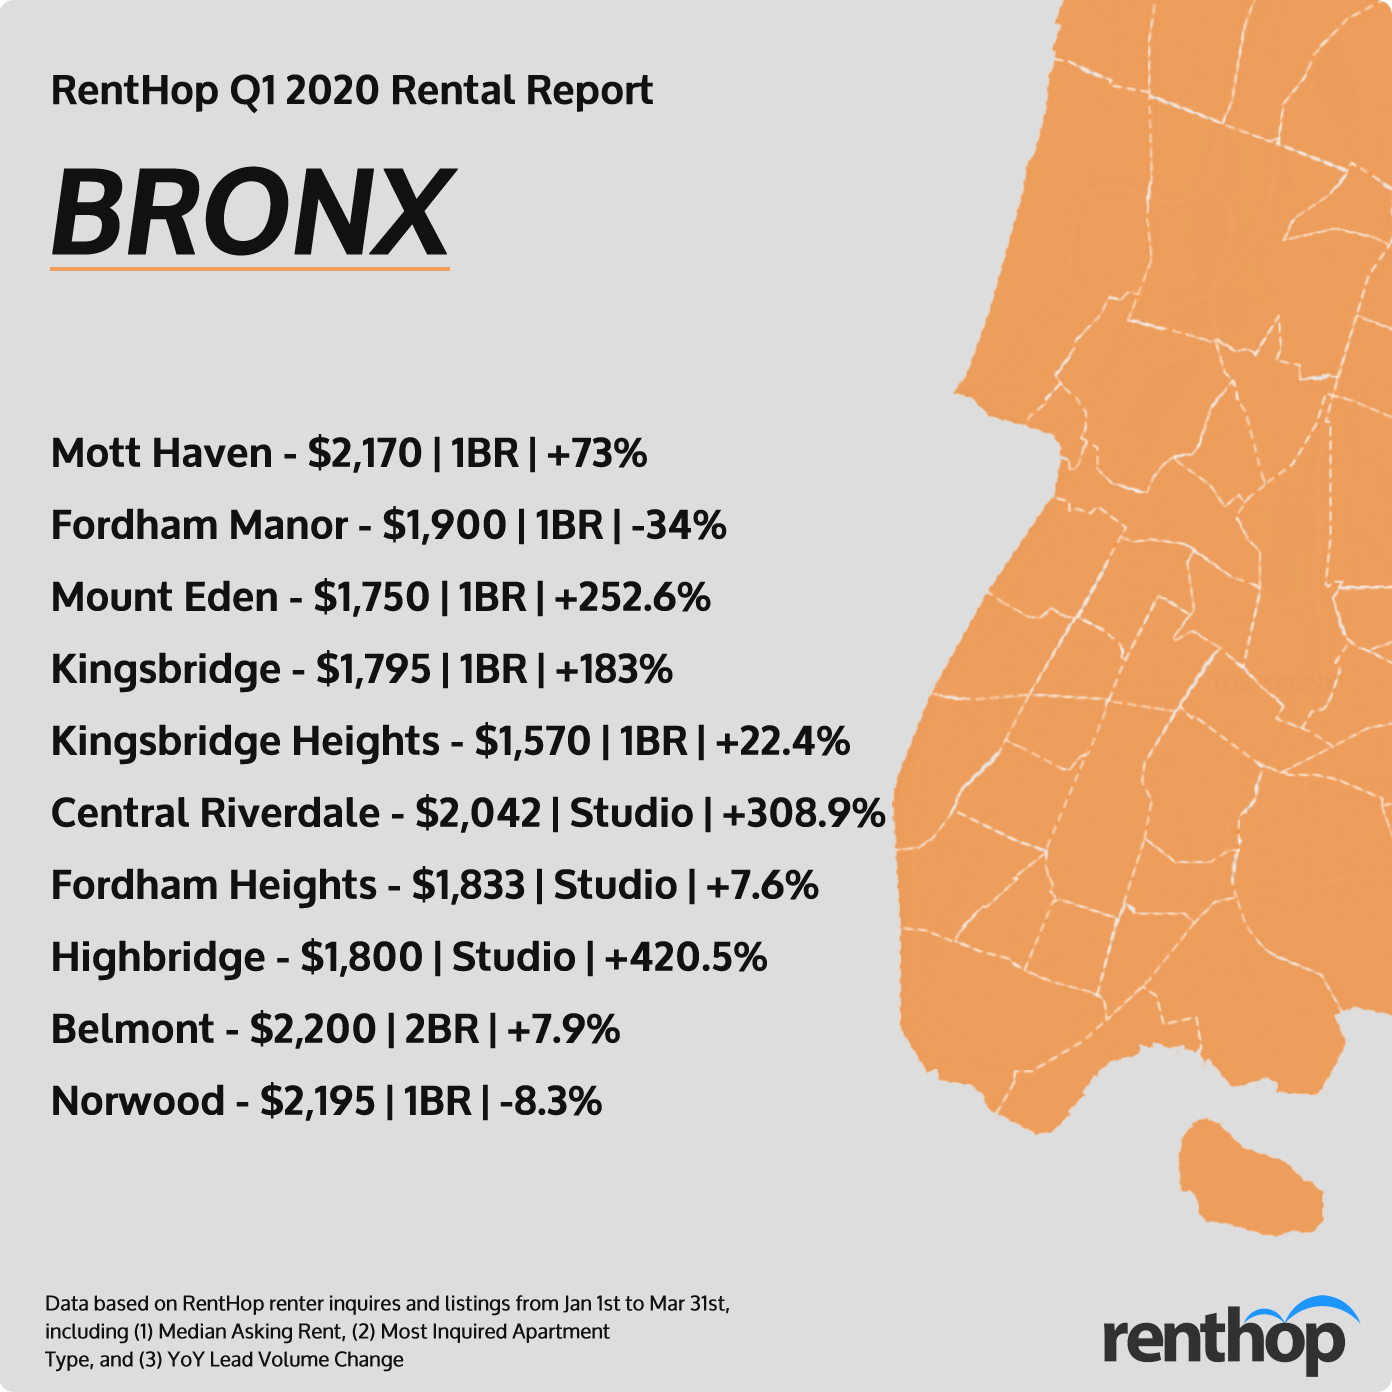
Relative to the other boroughs, the Bronx saw a massive growth spurt in leads year-over-year, topped by Highbridge (+420.5%), Central Riverdale (+308.9%), Mount Eden (+252.6%), Kingsbridge (+183%), and Mott Haven (+73%).
Methodology
Released on a quarterly basis, the RentHop Rental Report analyzes the NYC rental market using the platform’s traffic and lead generation data. The lead volume, most inquired apartment type, and year-over-year changes are determined based on the inquiries sent by renters visiting the RentHop site. The median asking rent is calculated using all listings created in the previous quarter across all apartment types. Please email press@renthop.com for a detailed report covering all NYC neighborhoods. Note that unlike other RentHop studies that analyze and summarize data using the Neighborhood Tabulation Areas, the RentHop Rental Report adopts a more granular neighborhood shapefile for the analysis, which is consistent with the listing search criteria on the consumer side.


