Have you ever come across a group of rats carrying bits and pieces of leftover food while scurrying across the empty pavement on your way home? As New Yorkers, most of us have had a fair share of unexpected run-ins and incidents with rats. It is widely known that rats are rampant in the city and they live among us, taking refuge and shelter on the streets, and even sometimes in our homes. Rats thrive in the city due to an abundance of leftover waste food piling up along the streets outside food establishments and buildings.
An estimate of about 250,000 to millions of rats lived in the city in 2017. To put these numbers into perspective, New York City’s rats is equal to approximately 20% of the human population. The high number of rat populations in NYC poses a threat to humans. For being notorious for carrying diseases, these NYC rats certainly are a public nuisance. Over the years from 2014 to 2017, we saw an incremental increase in rodent complaints. Last year, we saw a total of 19,152 rodent complaints. That’s an increase of about 10% from 2016. In the first quarter of 2018, there were already 4,831 complaints made to the city about rodent sightings. Fret not, here at RentHop, we’ve collected a subset of data from 2014 to 2017 of rodent complaints made to NYC’s 311. We wanted to investigate the behaviors of rats based on the locations of rat sightings and tell you which neighborhoods have the most rodent complaints and which is the season when rodent complaints start ramping up in NYC.
Here are the key findings from the study:
- When comparing the number of complaints between all boroughs in 2017, Brooklyn tops the list with 7,253 complaints. When comparing the number complaints per square mile, Manhattan emerges at the top with 197.50 complaints per square mile (fig. 1)
- Bedford-Stuyvesant, Brooklyn; Harlem, Manhattan; and Upper West Side, Manhattan are the top 3 complaint neighborhoods (fig. 2)
- Surrounding neighborhoods around Bedford-Stuyvesant (including Bushwick, Williamsburg, Crown Heights) and Harlem (including Washington Heights) also reflect high numbers of rodent complaints (fig. 2)
- While there is no association between 1-bedroom median rents and complaints about rat sightings, complaints are generally less common where median rents are higher (fig. 4)
- Brooklyn leads as the borough with the most number of unique rodent complaint counts based on top rodent complaint addresses, with 1800 Popham Avenue, 407 Lincoln Place, and 95 Eastern Parkway having the highest unique rodent complaint counts most likely due to proximity to Prospect Park (fig. 5)
- From 2014 to 2017, 2017 sets the record for the highest number of rodent complaints overall and rodent complaints have seen significant increases each year (fig. 6)
- From 2014 to 2017, rodent complaints spike in summer and dip during winter (fig. 6)
New York City Rodent Complaints by Neighborhoods, 2017
To begin, we looked at the rodent complaints data for each of the boroughs in New York City. Below you can see the total number of complaints in each borough in 2017. Rodent complaints consist of primarily rat sightings.
Among these boroughs, Brooklyn has the greatest number of total rodent complaints, followed by Manhattan and then the Bronx. However, this comparison does not consider the land size of each borough. By calculating the number of rodent complaints per square mile, the story changes.
Figure 1
Comparing 311 Rodent Complaints in 2017 by Borough
Rodent complaints in 2017 by borough sorted in descending order according to complaints per square mile.
While Brooklyn has the greatest number of rodent complaints among the boroughs, Manhattan actually leads the number of rodent complaints per square mile among all 5 boroughs in New York City. As for Queens, the largest borough in New York City, the number of complaints per square mile is actually low for its land size. Among smaller boroughs such as the Bronx and Staten Island, with the Bronx being slightly larger, we see that the Bronx has more complaints per square mile.
Now that we have a better sense of the number of rat complaints among these boroughs, we can explore how the rodent complaints vary by neighborhoods. We’ve looked at the most recent data from 2017 and created an interactive map to visualize the trends by first geocoding the exact longitudes and latitudes of the incidents to their respective neighborhoods.
The Concentration of Rodent Complaints in NYC
Figure 2
NYC Rodent Complaints 2017 Interactive Visualization by Neighborhoods (With Median Rents)
Full Data for the number of rodent complaints in 2017 is sourced from the NYC OpenData site. Exact latitude-longitude coordinates at each incident location were geocoded to corresponding neighborhoods.
Median Rents are calculated using RentHop Data for the past 12 months.This year’s data includes complaints made from January 1, 2017 – December 31, 2017.
Hover over the map for more information on each neighborhood.
Figure 3
Comparison of NYC Rodent Complaints 2017 by Median Rents, Neighborhoods and Boroughs
Taking a look at the above map and table, we noticed Bedford Stuyvesant (1,265 complaints), Harlem (865 complaints), and Upper West Side (731 complaints) all appear in the darkest orange, which represents the neighborhoods with the most complaints in 2017. There appears to be no association between these neighborhoods since median rents range from about $2,000 to $2,950, which is neither very high nor very low. From the map, we also observed that other neighborhoods in the vicinity also had high numbers of rodent complaints, for instance, Bushwick (612 complaints), Williamsburg (509 complaints), Crown Heights (596 complaints) near Bedford Stuyvesant, and Washington Heights (420 complaints) near Harlem. Median rents in these neighborhoods with the highest number of complaints seem to be within the same range. Is it possible that neighborhoods which see a lower number of rodent complaints are those with higher median rents and vice versa?
Association of Rodent Complaints vs 1-Bedroom Median Rents
Figure 4
Rodent Complaints vs Median Rents
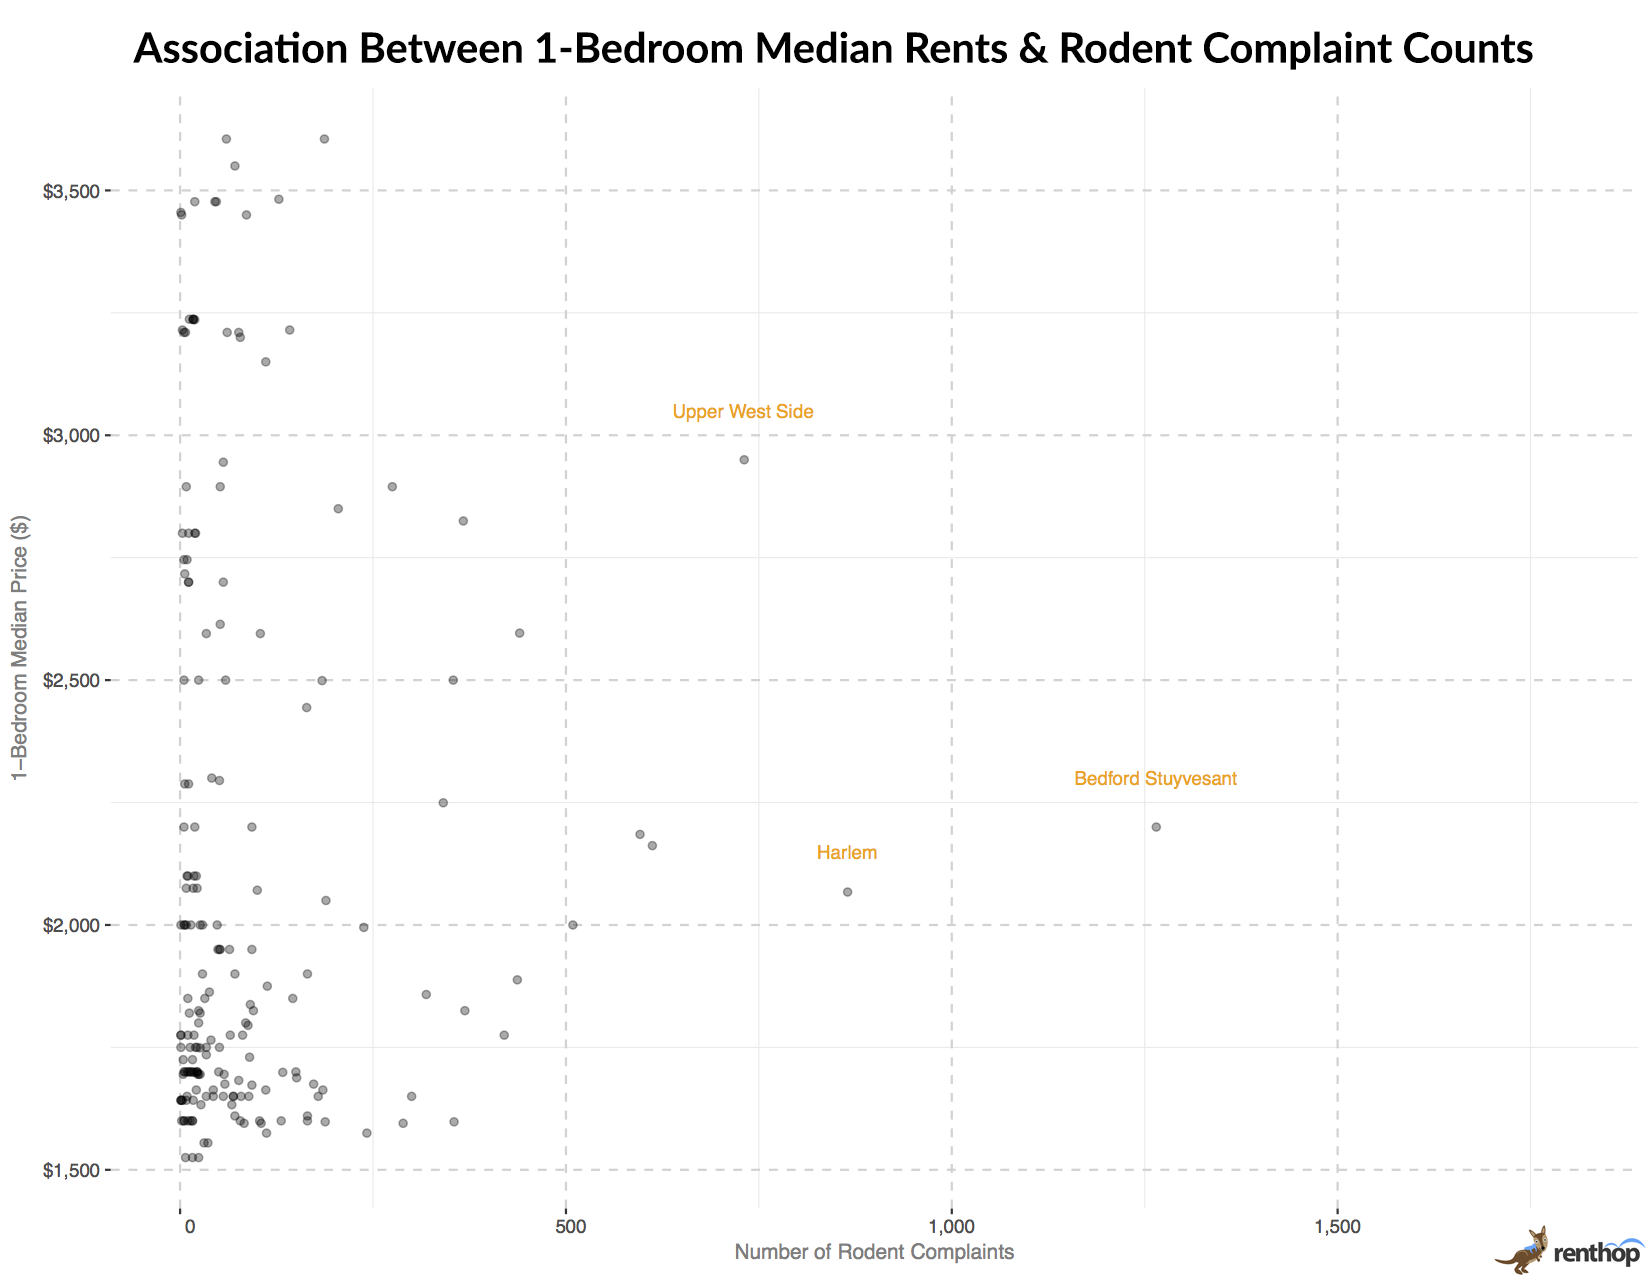
The graph shows the relationship between 1-bedroom median rents and rodent complaints by neighborhood. Between 1-bedroom median rents and the number of rodent complaints, we find that there are no associations.
Complaint data for January 1, 2017 – December 31st, 2017. Median rents data is for all of 2017 via RentHop’s listing database.
When looking at the plot of rodent complaints versus median rents, with median rents as the independent variable, we can see clustering of high numbers of complaints where rents are falling somewhere in between the extremities of very high or very low rents. As labeled on the plot in orange, Bedford Stuyvesant, Upper West Side, and Harlem stood out the most in terms of the number of rodent complaints among other neighborhoods. Complaints are less common where rents are higher. We don’t see any neighborhoods with high rents and high complaints.
Where Are the Exact Locations of the Most Complained Buildings?
Figure 5
NYC Rodent Complaints Top Addresses, 2017
Since rodent complaints from the same address within the same day may point to the same rodent incident in that location, it makes sense to group and look at unique complaints according to repeated calls from their respective addresses. The table above lists the most complained about addresses in 2017, sorted by unique complaint counts, accompanied by raw complaint counts. Within the top 10 most complained addresses, we find that Brooklyn held the most number of spots with 6 addresses, followed by Manhattan with 2 addresses, and Queens and the Bronx with 1 address each. From the table, we also see that the most notorious number of rodent complaints came from 1800 Popham Avenue (29 unique complaints), Morris Heights, the Bronx, followed by 407 Lincoln Place (16 unique complaints), Prospect Heights, Brooklyn and then 43 Sheffield Place (15 unique complaints), Cypress Hills, Brooklyn. As a long-standing problem over the years (2014 to 2017), 95 Eastern Parkway, Prospect Heights, Brooklyn, in particular, tops the list with the most number of raw rodent complaint counts overall of 192 complaints.
The number of rodent complaints in Brooklyn is quite troubling. Could it be that there are more trash and leftovers left out on the streets by establishments or buildings in the area, or is it the vicinity of the parks which have allowed rats to thrive? To find out, we looked at the exact locations of these addresses.
We find that most of these locations are either located within walking distances to parks or are situated in the midst of various establishments and shops. For instance, 407 Lincoln Place is situated about 400 ft away from Prospect Park and is surrounded by many other shops around the building. 95 Eastern Parkway, notorious for its huge influx of complaints, is also situated about 200 ft away from Prospect Park. It might be possible that the rats thrive and appear frequently in these locations due to close vicinity to the park, which allows them to burrow for shelters.
Do More Rats Appear During a Particular Season in NYC?
Now that we know where exactly rodent complaints are mostly concentrated, we find ourselves questioning if rodent complaint counts change accordingly with the seasons in NYC. Perhaps rodent complaints reflect the activity level of rats during different seasons? Are there more rat sightings during summer because rats are more active during summer and fewer rat sightings during winter? With those questions in mind, we looked at the rodent complaints data over the years from 2014 to 2017 and compared them by seasons and years.
Figure 6
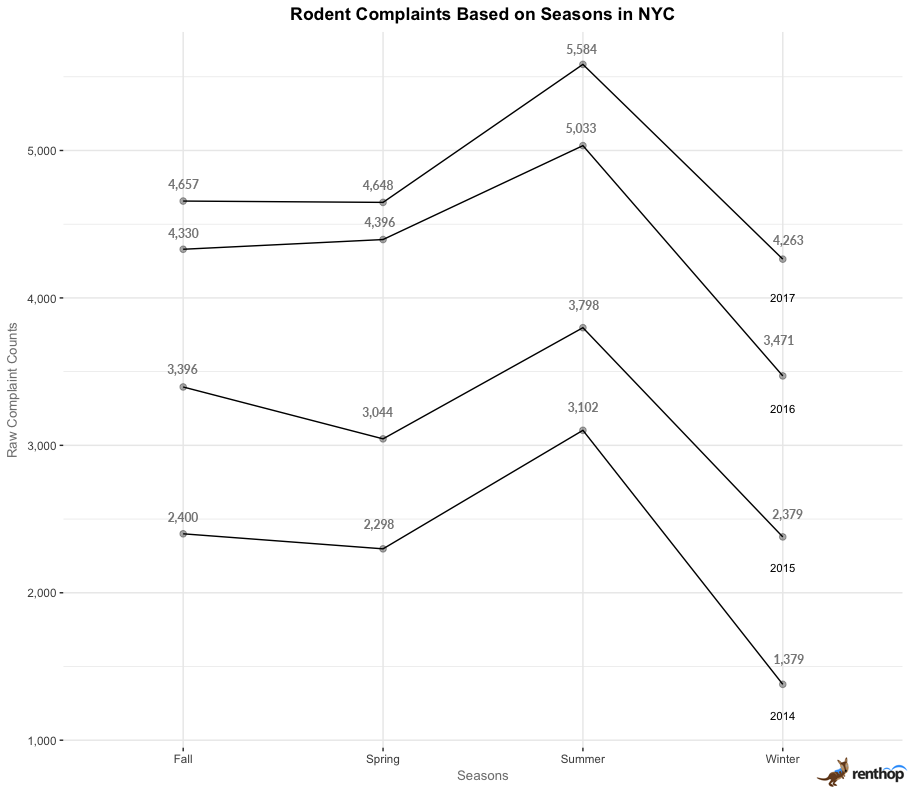
Seasons are defined as Fall (September to November), Winter (December, January, February), Spring (March, April, May), Summer (June, July, August), Winter (December, January, February) according to the Weather Facts NYC.
From the chart, we see:
- The highest number of complaints overall in 2017
- Rodent complaints peaked during summer from 2014 to 2017
- Rodent complaints are the lowest during winter from 2014 to 2017
Why do rodent complaints peak at summer and then drop to their lowest in winter? It might be highly possible that rat populations spike in summer as new rat pups are weaned in spring and in late summer or early fall. Rats are known for being more aggressive in finding food and preparing themselves for winter during the summer season through the means of stockpiling and nesting. We’re not surprised now that the Pizza Rat is back for another slice of pizza and appearance at this time of the year following its first viral appearance carrying a slice of pizza down a staircase at East Village’s 1st Avenue station on the L line in 2015.
What can I do to curb or avoid rodent infestations?
If you frequently find yourself seeing these furry creatures scurrying around your building or neighborhood, you should first call 311 or visit the online portal for creating complaints, which allows you to make complaints, anonymously if you wish. An inspector from the NYC HPD will come to check the building for violations, usually within a few days.
To further prevent these pests from populating in your area, remember to always securely tie and discard your garbage properly into a can with a lid. Rats love to thrive in places with food and leftovers. You wouldn’t want them to get access to such things so easily. In addition, you could also get rid of your garbage close to the garbage pickup truck’s arrival time at your building. This will significantly reduce the number of garbage bags left outside your building and it will also leave more space for any additional garbage the following day.
Regardless, be consistent. While these tips may seem easy to follow, but to practice them consistently requires consistent effort and commitment.
If you’re in the market for a new apartment or were just influenced to move because of this study, be sure to check out our extensive selection of New York City apartments for rent.
Resources Used
“No one knows exactly how many rats live in New York City — here’s why it’s so complicated
“, Business Insider, http://www.businessinsider.com/new-york-city-rat-population-is-hard-to-measure-2017-8
A subset of “311 Service Requests from 2010-Present”, NYC Open Data, https://data.cityofnewyork.us/Social-Services/rodent_complaints/tim7-qyp8/data


