With total evictions in 2018 clocking in at around 21,000, it would be unfair to characterize evictions in NYC as a problem affecting a large portion of the population. That said, the Data Science team at RentHop looked into some of the more interesting data around evictions in an attempt to better understand the landscape of evictions and to better inform renters about the mysterious process.
We looked into the evictions in the 2019 year-to-date, and compared them to the same period last year in 2018.
Key Findings:
- In 2019, evictions have fallen in every single borough in NYC, with an overall drop of 9.6%.
- The largest drop in evictions is in the Bronx – from 1,558 in 2018 to 1,225 in 2019 year-to-date (a 21.4% drop).
- For the most part, evictions tend to be concentrated in the same neighborhoods year over year with Claremont-Bathgate in the Bronx having the highest number of evictions in 2019.
- There appears to be little to no correlation between 1-bedroom median rents and the number of evictions in a given neighborhood.
- In other words, it doesn’t appear as if more affordable neighborhoods have higher number of evictions.
- The Manhattan addresses with the most evictions in 2019 are 555 Tenth Avenue and 605 West 42nd Street – both fairly new buildings.
Eviction Map:
The below map shows 2018 and 2019 evictions* side-by-side, color coated based on the number of evictions present in a given neighborhood. As one can see, the reddest sections (with the most evictions) are concentrated mostly in the Bronx and in Brooklyn, whereas evictions in Manhattan and Queens tend to be less frequent.
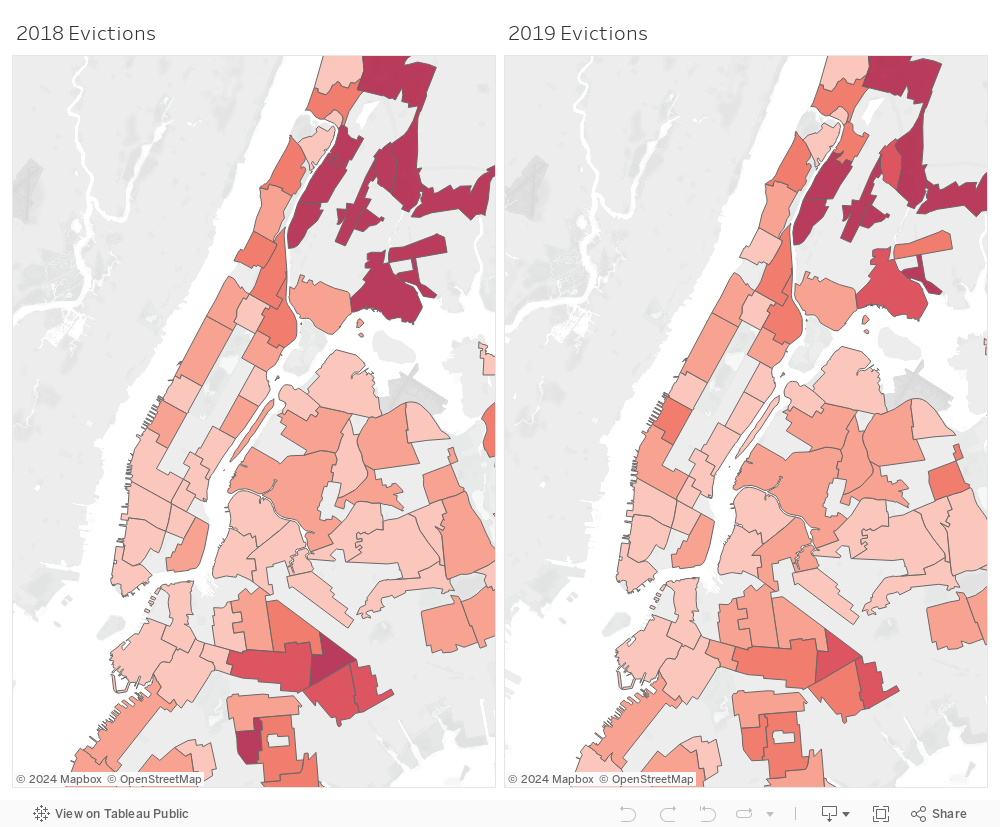
*Note that the above data was taken from NYC Open Data for evictions in the 2018-2019 year from Jan 1st to March 11th. Median rent data is taken from RentHop’s proprietary databases. Instances where there is no coloring for evictions means that we had insufficient data on evictions and/or median rental prices.
Boroughs – Year over Year
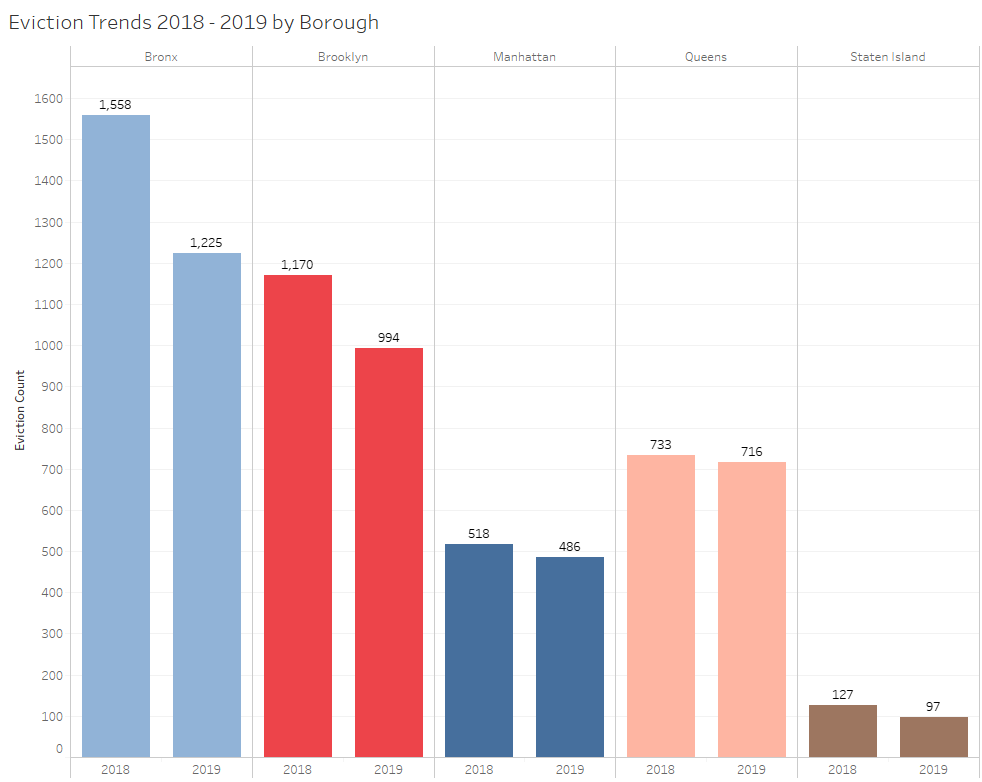
The above table shows the drop in evictions by borough, year over year. We took the year-to-date data for 2019 and looked at the comparable period for 2018. Granted, 2019 is only just beginning, but the data shows a clear downward trend.
- In the Bronx, evictions for the period fell from 1,588 to 1,225, a 21.4% decrease.
- Brooklyn evictions decreased from 1,170 to 994, a 15% decrease.
- In Manhattan, there was a smaller decrease but a decrease nonetheless – from 518 to 486; a 6.2% decrease.
- Queens had the smallest decrease – from 733 to 716, a 2.3% decrease.
- Lastly, Staten Island went from 127 to 97, a 23.6% decrease.
Rent vs. Evictions
As part of our data analysis, the Data Science team at RentHop was curious to see whether we could find any correlation between median rent prices and the number of evictions in a given neighborhood. This was especially important to us given the economic incentives for the marshals that serve these evictions, who earn what’s called a poundage fee — a percentage of whatever they collect.
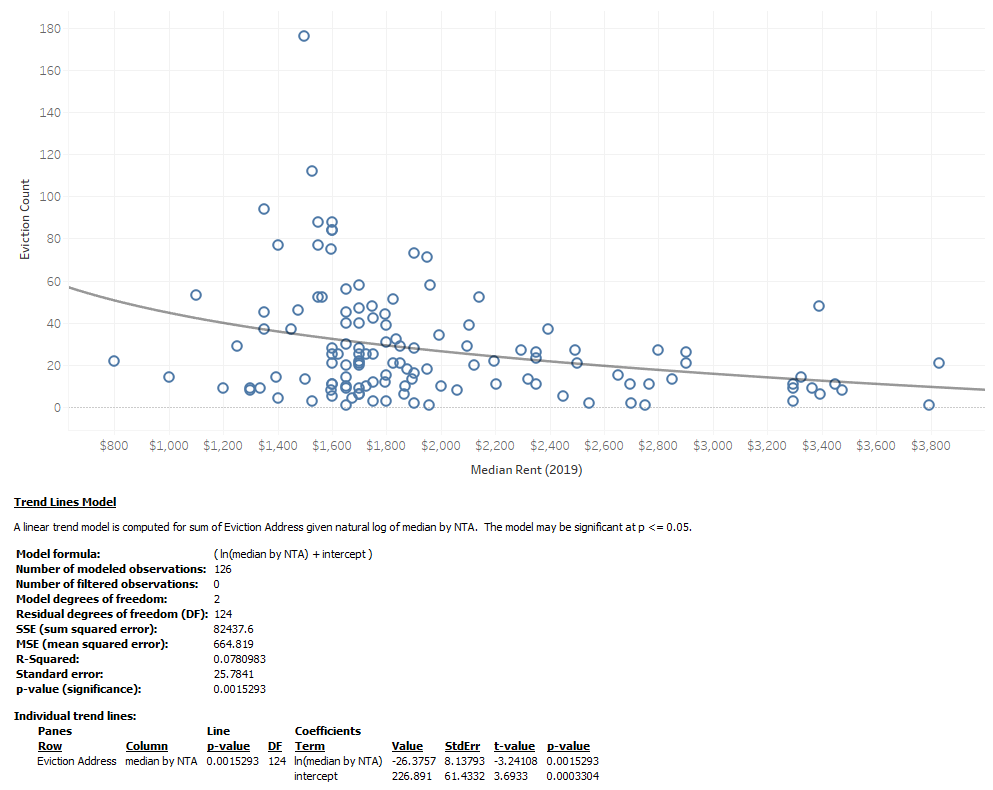
However, we did not find any convincing correlation between median rents and evictions, only finding an R squared of .078, which suggests that the economic incentives of poundage fees don’t necessarily push marshals to solely evict people in either high-rent or low-rent places.
Full Data
See below the full table of all the addresses evicted and the marshals who evicted them – you can type in your zip code and see all the relevant evictions from 2018 and 2019. Note that the table is unique based on docket number, (the number assigned by the city marshal during case intake) so there may be multiple entries for the same address for a given eviction date.


