The Northeast is no stranger to the cold, and New Yorkers know how to stay warm in the winter months. However, bundling up inside isn’t always an option for those who live in areas with poor heating. Each year, renters across the city fall victim to inadequate heat and hot water in their apartments.
Despite the NYC Heat Law, many landlords do not comply with heating regulations, resulting in many tenants reporting their buildings to 311. Each winter, RentHop analyzes the frequency of these calls throughout buildings, neighborhoods, and boroughs, finding that certain areas receive more heat complaints than others. Areas like Pelham Parkway (Bronx), Flatbush (Brooklyn), and Little Italy (Manhattan) continue to receive a high volume of heat complaints. The following describes where renters are more likely to be left out in the cold.
Key findings from this year’s report:
- In total, 118,589 heat and hot water complaints were filed to 311 residents across New York City from October 1, 2022, to January 10, 2023.
- After grouping complaints by day and address, we found 117,315 unique complaints, 24.7% more compared to the same period last year.
- All five boroughs in NYC received more heat complaints than last year.
- Some of the worst heat violation offenders include 957 Woodycrest Avenue (653 complaints / 96 unique) and 932 Adee Avenue (639 complaints / 50 unique) in the Bronx, and 9101 Church Avenue in Brooklyn (520 complaints / 61 unique). [Data Table]
Heat Complaints by Borough
The Bronx
- The Bronx remains the coldest borough, receiving 42,050 unique heat complaints throughout 2022.
- Pelham Parkway is the coldest neighborhood in the city, with 1,293 unique complaints, or 2,050.1 complaints/10k renter-occupied units. Complaints increased by 10.7% from last year.
- 85%, or 17, of the 20 coldest NYC neighborhoods reside in the Bronx.
Brooklyn
- Brooklyn received 32,733 unique heat complaints, increasing by 21.65% from last year.
- Flatbush became the coldest neighborhood in Brooklyn, with 5,594 unique complaints and 1159.2 complaints/10k renter-occupied units.
Manhattan
- Heat complaints are up 19.78% from last year, with residents filing 25,879 unique heat complaints.
- In the coldest neighborhood, Little Italy, heat and hot water complaints are up 117.66% from last year.
Queens
- Queens received 16,509 unique heat complaints this year, up from 13,384 last year.
- Woodhaven is the coldest neighborhood in the borough, where complaints are up 278.26%.
Staten Island
- Renters in Staten Island have filed 1,424 unique complaints this year, increasing 29.57% from last year.
- The neighborhood with the most complaints, St. George, has 157 unique heat complaints this year.
When Does the Heat Season Start?
Landlords in New York City must provide heat for all of their tenants from October 1st through May 31st. This period is referred to as the “Heat Season.” Heating requirements include:
- Between 6:00 AM and 10:00 PM, if the outside temperature falls below 55 degrees, the inside temperature is required to be at least 68 degrees F
- Between 10:00 PM and 6:00 AM, if the inside temperature is required to be at least 62 degrees F, no outside temperature requirement
Many buildings in the city do not provide adequate heat for their residents, with some addresses receiving significant numbers of complaints throughout the Heat Season. Buildings like 957 Woddycrest Avenue and 932 Adee Avenue in the Bronx received hundreds of complaints this year.
Surely, when tenants are suffering, they make dozens of complaints each day to 311. Therefore, to accurately measure the number of days a building goes without heat, RentHop grouped the heat/hot water complaints by address and created date. Complaints filed on the same day regarding the same building are considered one unique complaint. From Oct 1, 2022, the start of this Heat Season, to Jan 10, 2022, the city received 117,315 unique heat complaints, 24.7% higher than the total unique count of 94,033 in the same period last year.
Mapping the 311 Heat Complaints by NYC Neighborhood
To fairly rank the neighborhoods, we further normalize the data by dividing the number of heat complaints by the number of renter-occupied units in a neighborhood retrieved via the 2021 American Community Survey (homeowners can control their heat and are therefore excluded from this study).
The map below illustrates how “cold” each NYC neighborhood is. The darker the shade, the more heat complaints per 10,000 renter-occupied units a neighborhood has seen this winter. Click on the neighborhood to learn more.
Neighborhoods in the Bronx receive more heat complaints than the other boroughs. Out of the 20 coldest neighborhoods in New York City, 17, or 85%, are in the Bronx. Other areas of the city, like neighborhoods in Manhattan above Central Park and Central Brooklyn, receive frequent heat complaints as well.
Figure 1 demonstrates the number of normalized heat complaints per borough from October 1st to mid-January of 2017 through 2023. The Bronx consistently receives the highest number of heat complaints annually, accounting for 35.84% of total city-wide complaints this season. Manhattan has more heat complaints per 10,000 renter-occupied units than Brooklyn, where complaints have increased by 19.78%. Heat complaints have risen across every borough this year.
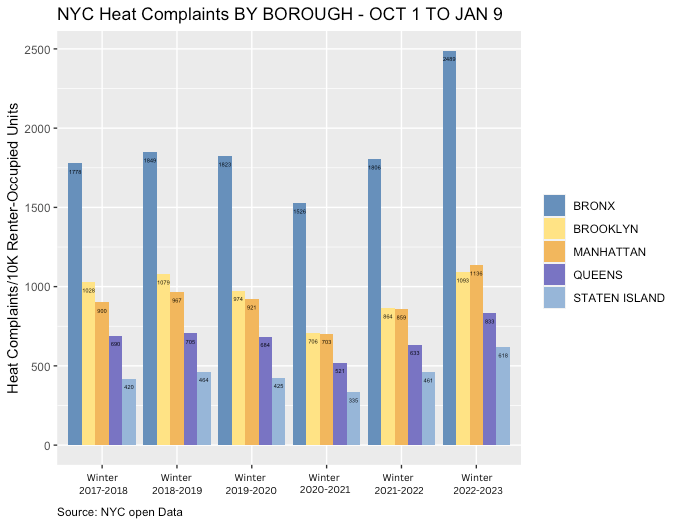
Figure 1
These are the Coldest Neighborhoods in NYC
Figure 2 showcases the top 20 neighborhoods with the largest amount of normalized heat complaints this season, from October 1st to January 9th, 2023. 17 of the 20 neighborhoods are located in The Bronx.
Pelham Parkway took over first place this year, replacing Fordham South. It received 10.70% more complaints than last year, with 2,050.1 complaints per 10k renter-occupied units. Overall, 18 out of the coldest 20 neighborhoods received more complaints this year than last year. Fordham Heights and Inwood are the only neighborhoods on the list to receive fewer complaints, decreasing by 15.22% and 0.3%, respectively.
Little Italy took over as Manhattan’s coldest neighborhood, receiving 117.7% more complaints than last year. It’s worth noting that most buildings receiving complaints in Little Italy are older and smaller, built in the early 1900s and hosting fewer than sixteen residential units. As of January 9, the neighborhood had received 1,401.5 complaints per 10k renter-occupied units this heating season.
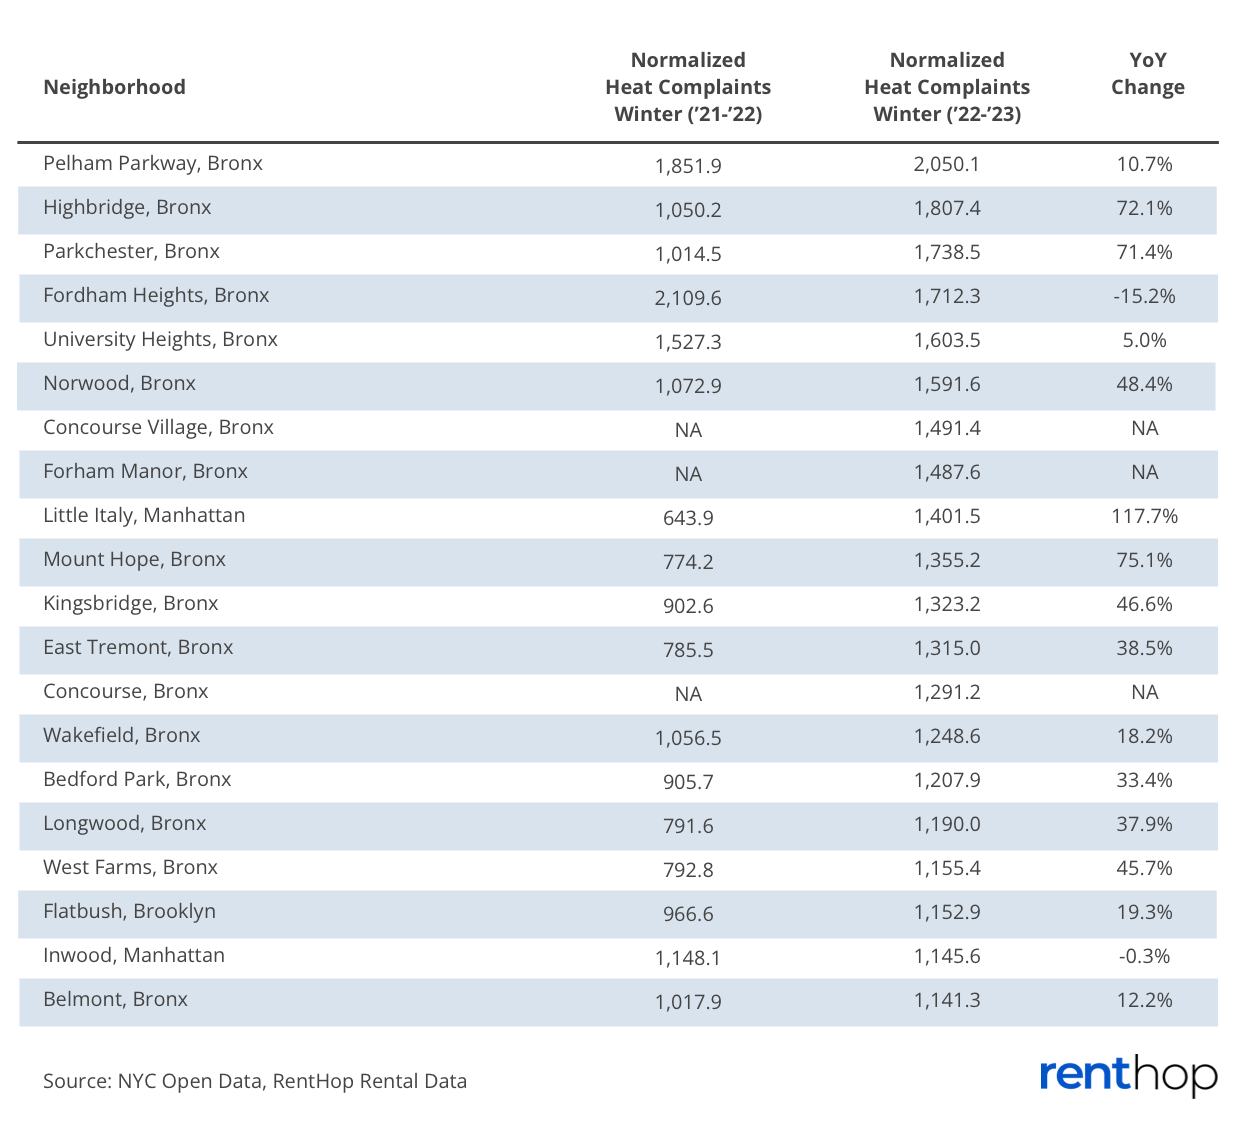
Figure 2
Winter Just Got Colder in these Neighborhoods
Figure 3 displays the neighborhoods with the greatest increase in heat complaints this year. Complaints in Holliswood, Queens, increased by 443.3% this year. Woodhaven experienced a significant increase as well, with complaints rising 278.5% to 863.2 complaints per 10k renter-occupied units.
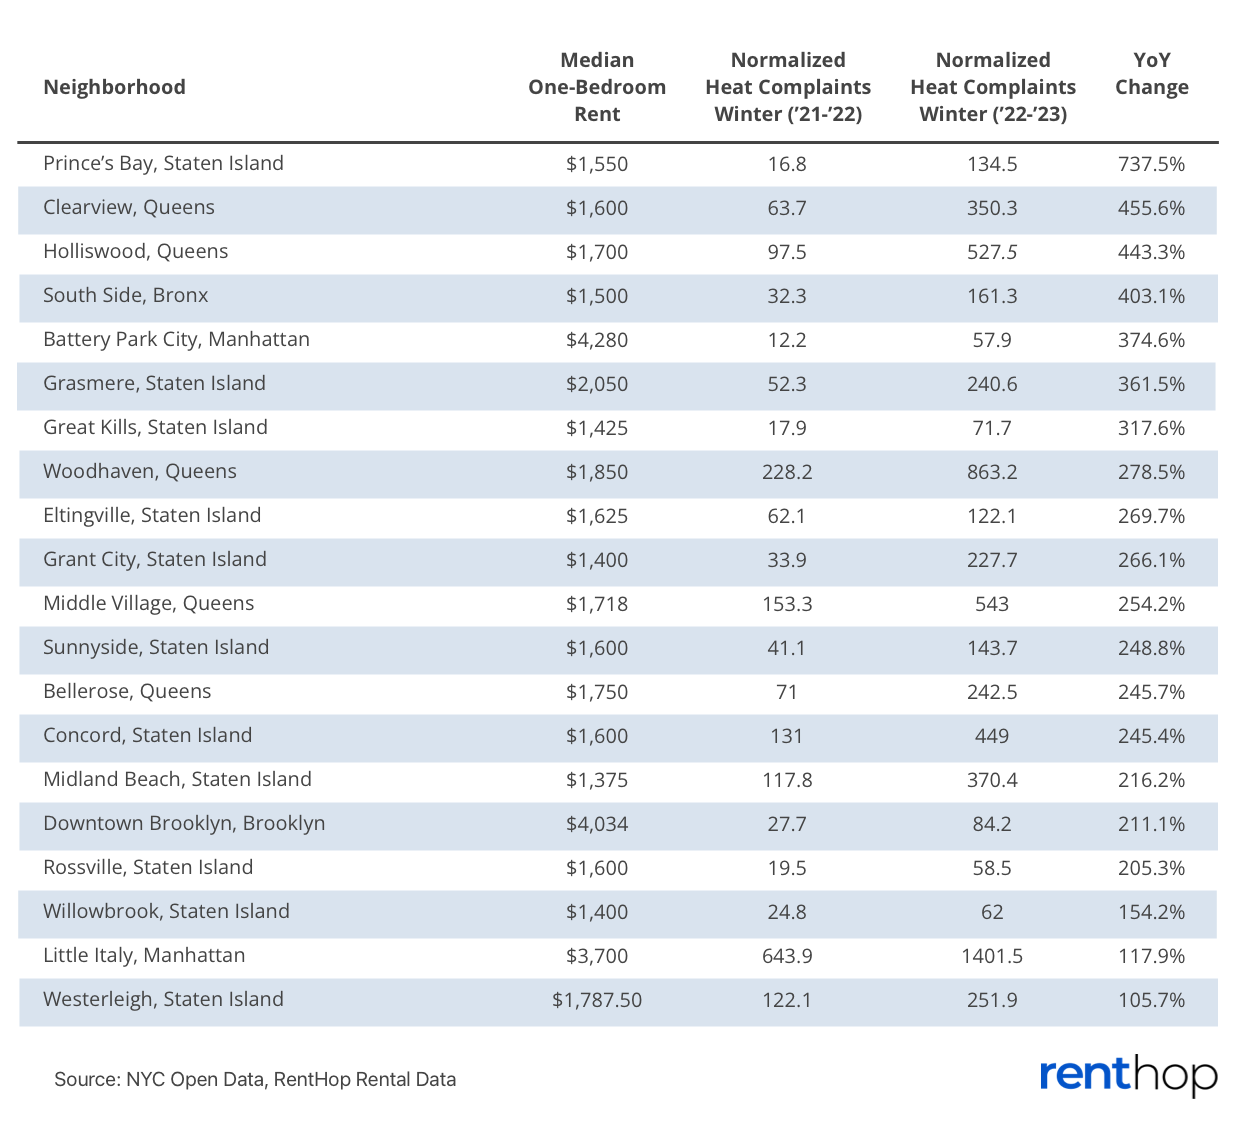
Figure 3
Buildings with Frequent Heat Complaints
While some neighborhoods receive more complaints than others, certain buildings have a high amount of complaints as well. The following table displays the 100 buildings across the city with the highest number of heat complaints this year. If you’re looking to sign a lease, make sure to check your building against this list to ensure you’ll stay warm in the winter. You can further explore the data by sorting the data by column or doing a quick search using the search bar.


