In a Show of Financial Health, Down Payments Increase as Sales Volumes and Prices Increase
Purchasing a home is one of the most memorable, rewarding, and anticipated moments in many peoples’ lives. As our world changes in many ways, the desire to own a home hasn’t subsided; home prices are rising and supply is falling. According to the Nation Association of Realtors, recently sold homes were on the market for just 3 weeks, a historical low. The typical buyer age was also 45, indicating a seller’s market that doesn’t favor Millennials and first-time home buyers.
Here in New York, housing supply is reaching lows as median sale prices reach highs, indicated by Douglas Elliman’s 3Q 2017 reports. Listing inventory (condos, co-ops, and 1-3 family homes) in Brooklyn has decreased 30.4%; there’s just 1,826 available units, versus 2,624 last year. Manhattan has shrunk 2.4% to 6,115 units, and Queens has increased 4.5% to 4,486 units. With this knowledge and data from the NYC ACRIS database, RentHop data scientists set out to see what effect this is having on NYC home buyers’ borrowing habits. Using the maps and graphs below we’ve illustrated these changes. We use the terms leverage percent and percent of home purchase mortgaged interchangeably, other times we refer to the inverse, the down payment, in a similar context.
Key Findings
- The median percent of a home purchase mortgaged was down (>1%) in 107 neighborhoods from 2010 to 3Q 2017, with 69 of those neighborhoods down at least 5%
- The median percent of a home purchase mortgaged was up (>1%) in 39 neighborhoods in the same period, with just 18 up more than 5%
- Less leveraging and larger down payments in the outer boroughs are a sign of greater financial health; Bronx down-payments grew from 7% to 16% while Queens grew from 20% to 25%
- A majority of the increased borrowing took place in Manhattan, although percent leveraged is still lower than other boroughs (down payments down from 36% to 31%)
- NYC as a whole has maintained a leverage rate of about 75% since 2010 (25% down payment), dropping slightly to 74% in 2017, far lower than the nationwide median of 90% (10% down payment)
- Three of the largest mortgages we found between 2010 and 3Q’ 2017 were for 432 Park Ave, including a $56 million mortgage for penthouse unit 96. The total sale price was $87,660,900 (63.9% leveraged), the top 6 are listed below
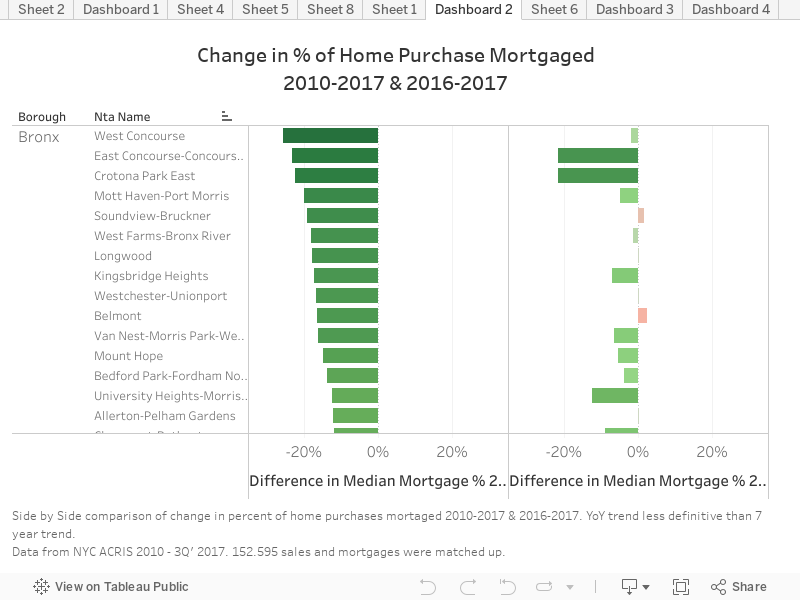
The first thing that one may notice in the above-left graphic is that just a handful of neighborhoods borrowed a larger percent for their home purchase than in 2010. This seems to indicate greater financial stability in homebuyers since the 2009 financial crisis. This is especially the case in West and East Concourse, Bronx; East New York and Crown Heights North, Brooklyn; and Queensbridge and Woodhaven, Queens. Manhattan actually saw borrowing increase, but upon closer inspection you’ll see purchases are still under 70% leveraged in most neighborhoods, making neighborhoods in Manhattan some of the least leveraged in NYC.
The above-right graphic shows year-over-year trends, which are more mixed. While there’s no definite trend in Queens, Brooklyn, and Manhattan; it’s clear that in the Bronx, people are borrowing less than they borrowed last year. The forthcoming graphs illustrate the trends over time more clearly.
How’d We Do It?
To compile the data for this report, records from NYC’s ACRIS database of sales were compiled and geocoded to find which neighborhood they were in. Sales records were then matched with mortgage records and commercial and bulk sales were filtered out. Just over 150,000 sales were mapped to corresponding mortgages. Due to recording delays of months or sometimes years; as of December 2017, it is likely that some records for 3Q’ 2017 may be missing (and 2Q’ 2017 for that matter). Data for Staten Island is not present as Richmond County maintains its own, separate registry for data like this.
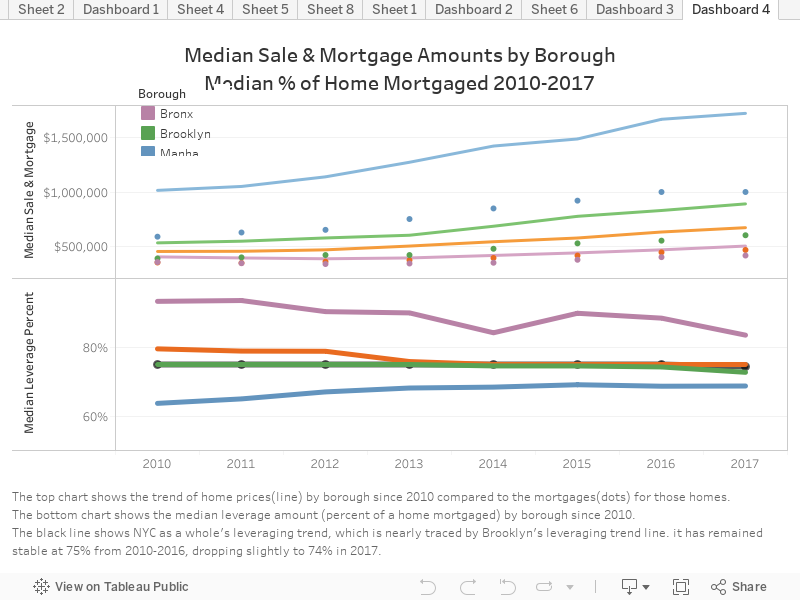
The line chart above shows, by borough, the trends of median sale prices, mortgage amounts, and leverage percent. Home prices are up across the board, and mortgages have risen accordingly. At the same time, down payments have risen, meaning leverage percent has gone down. One may conclude that lenders aren’t willing to lend as much, but data for Manhattan would contradict that. As sale prices have skyrocketed in Manhattan, leverage percent has risen, with all boroughs converging towards the NYC median leverage percent of 74%.
Manhattan – Some Very Large Mortgages
While digging through this data, I couldn’t help but check where the largest mortgages were issued. It came as no surprise that 3 of the top 5 were at 432 Park Ave, the tallest residential tower in the western hemisphere. Below are links to the original mortgage records.
- 432 Park Ave, #96 – $56,000,000 mortgage, $87,660,900 sale price – 63.9% leveraged
- 432 Park Ave, #83 – $30,500,000 mortgage, $65,163,600 sale price – 46.8% leveraged
- 157 West 57th St, #88 – $30,225,000 mortgage, $47,367,500 sale price – 63.8% leveraged
- 157 West 57th St, #86 – $30,200,000 mortgage, $47,367,000 sale price – 63.8% leveraged
- 432 Park Ave, #64A – $30,000,000 mortgage, $44,833,400 sale price – 66.9% leveraged
- 551 West 21st St, PH18 – $25,500,000 mortgage, $34,623,200 sale price – 73.7% leveraged
The Maps Below Show Geographically Where Home Prices are Rising and Borrowing is Decreasing
The map on the right indicates that home prices are up across the board, save for Marble Hill-Inwood and West Brighton. Most neighborhoods saw median home prices increase by 40% or more percent, as indicated by the lighter shades of blue covering most of the map on the right. Hamilton Heights in Upper Manhattan saw median sales prices rise the most, followed by Brooklyn Heights and West village. DUMBO, Stuyvesant Heights, Long Island City, and Manhattanville also rose sharply.
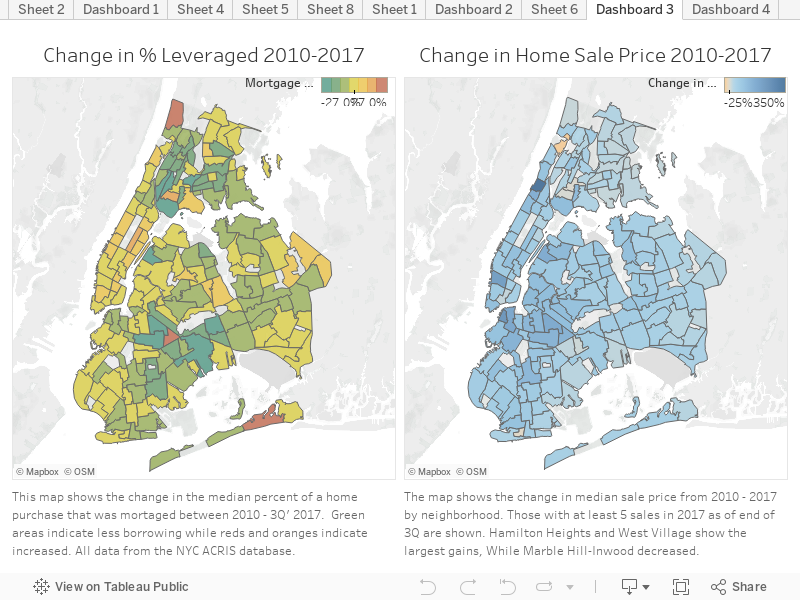
The map on the left shows how the distribution of borrowing has changed over the past 7 years. A majority of neighborhoods are shades of green, indicating lower borrowing and larger down payments. This is especially evident in Southeast Brooklyn and Queens; in neighborhoods like Crown Heights North, East New York and Woodhaven.
Looking North towards the Bronx, there are signs of positive change, as home buyers are leveraging significantly less to buy their homes. Median down payments in many Bronx neighborhoods were as low as 3-5% in 2010 but are now mostly between 15-25%.
Lower borrowing in the face of higher home prices may signal greater financial health for the NYC market, while also possible indicated that lenders are becoming more reluctant to lend. In a market where supply is having difficulty keeping up with demand, competition for great homes is fierce. This means making lightning-fast decisions is important. Having all the information at your fingertips is essential and with RealtyHop you can make a well-informed purchase.


