Rents Stabilizing in Manhattan as Rents Rise in Bronx, Queens
New York City is internationally known for its posh apartments and luxurious living. This, of course, comes at a price. For the 3rd Quarter of 2017 that price is $3,025 – asking rent for a median one-bedroom apartment anywhere in the city that is. This is up from $3,000 in the 2nd quarter, but rents vary greatly across boroughs and neighborhoods. Below you’ll find maps showing current prices and graphs displaying rent changes over the past two years. Further down you’ll find a table with all available neighborhood data.
Here are some key findings from our 3rd quarter market report:
- As a borough, Queens showed the largest rise in rent from 2Q to 3Q (6.5%)
- The Bronx had the largest Year-over-Year gains with a 10.7% hike across all neighborhoods, 84% of available neighborhoods saw rent go up at least 1%
- The top 9 most expensive neighborhoods were in Manhattan; number 10 was North Side-South Side (Colloquially Williamsburg) in Brooklyn
- Manhattan rents have largely stabilized, with 57% of neighborhoods showing little or no change from last quarter, and 57% showing at least a 1% drop from last year
- The biggest price drops are happening in the most expensive area (Soho, Gramercy Park) while the biggest gains are in the least expensive (Schuylerville, Ridgewood, Mott Haven)
Using our own data, RentHop has looked back at the data for the 3rd quarter as well as past years to see where rents are up, down, or stabilized. In NYC there are 195 NTAs, (Neighborhood Tabulation Areas) some of which are parks, airports or cemeteries. RentHop data scientists calculated median one-bedroom rent, Quarter-over-Quarter, and Year-over-Year change for 130 of them where sufficient data is available. This was done from a pool of 52,918 unique listings for 3rd Quarter 2017 with an average of 407 and median of 58 data points per neighborhood.
The Maps Below Show Median Rent as well as the Change Since Last Quarter
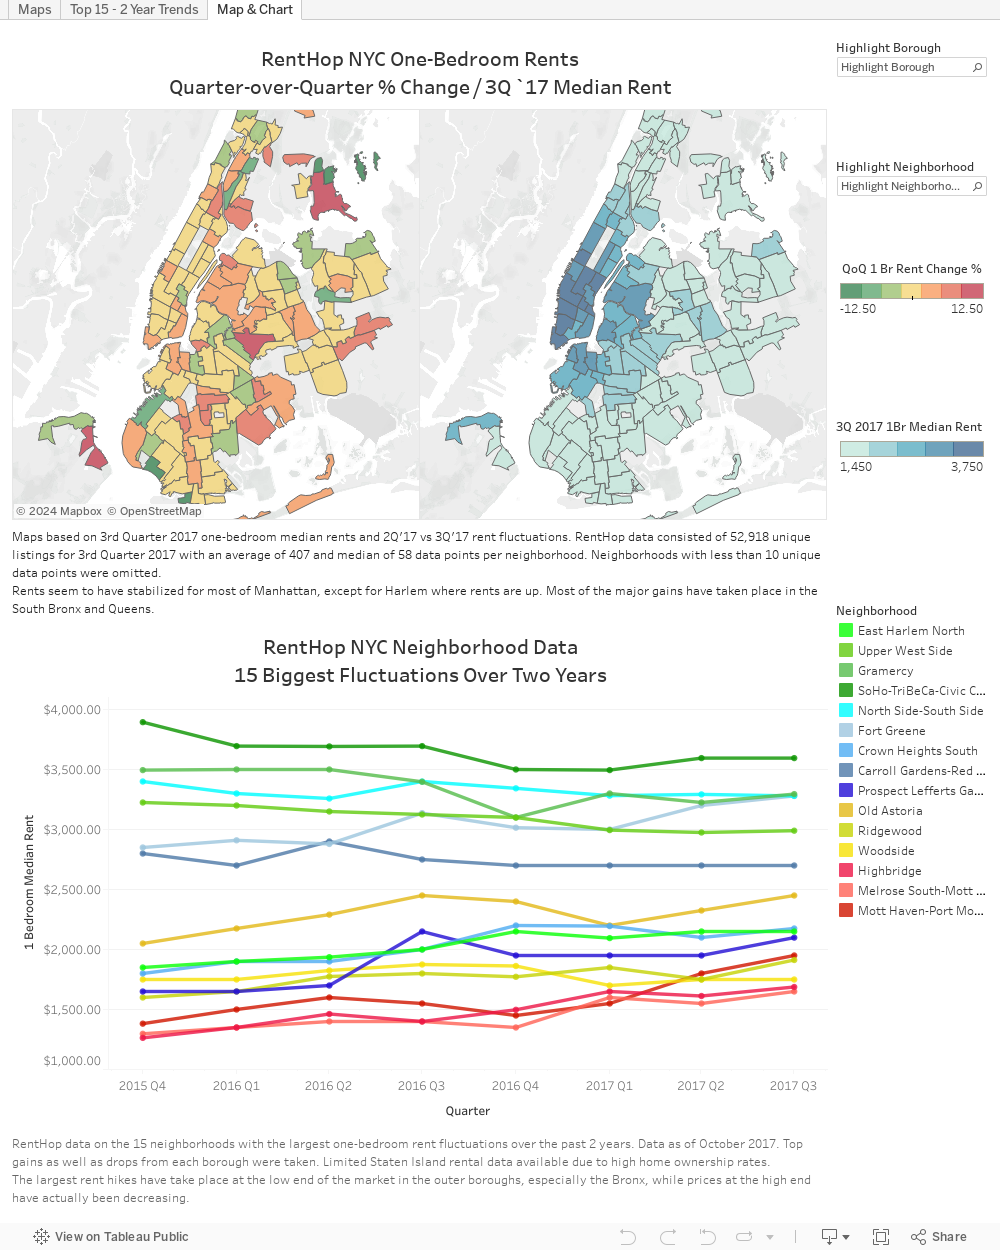
The maps above show Quarter-over-Quarter (2nd Quarter 2017 vs 3rd Quarter 2017) one-bedroom rent fluctuations by neighborhood tabulation area on the left, and 3rd Quarter median rents on the right. Dark red, as seen in Ridgewood and Schuylerville indicates larger price jumps. Dark green, like Sunset Park West, Bath Beach, and Queensboro Hill indicates price drops. Grayed out neighborhoods are where we didn’t have sufficient data, many of which are in Staten Island where higher rates of home ownership mean less rental units.
Looking at the map on the right, it’s quite clear that the most expensive New York neighborhoods are in Manhattan (the top 9 actually) but thankfully prices are stabilizing. Brooklyn neighborhoods like Fort Greene, North Side-South Side (Colloquial Williamsburg), and Dumbo are close behind Manhattan. Hunter’s Point and Long Island City of Queens are also catching up. Click a neighborhood to see the median rent or QoQ rent change.
The graph under the maps show neighborhoods that have fluctuated the most over the past two years.
To diversify the data I chose to highlight at least one neighborhood from each borough that made a drastic rise as well as a drop. Manhattan’s (shades of Green) biggest drop (down 7.6%) was SoHo: $3,894.50 to $3,595, while Queens’ (shades of yellow) biggest “drop” was Woodside, which actually remained the same over 2 years as everything else has risen. Bronx (Red) neighborhoods posted the most drastic gains, Mott Haven rose from $1,382 to $1,950 over the past two years. Brooklyn (Blues) were mixed, but Fort Greene grew the most at 15% ($2,850 to $3,279) over the past two years.
The table below has two tabs. One shows the median rents, Quarter-over-Quarter changes, and Year-over-Year changes for all neighborhoods. The other is a breakdown of what percentage of the neighborhoods in each borough saw rent increase or stay the same or drop. Keep in mind, these percentages are not how much the rent has changed, but how what percentage of neighborhoods posted rises, drops, or no change.
Most notable are Year-over-Year changes for Bronx and Queens, with rents rising 10.7% and 9.1%, respectively. 84% of observed Bronx neighborhoods saw rents rise more than 1% since last year. Manhattan showed the greatest number of neighborhoods with rents stabilizing or dropping, with more than half of neighborhoods showing no gains since last quarter, and 57% down from last year. The city as a whole saw one-bedroom rent up .8% since last year as well as last quarter. A greater number of neighborhoods showed little or no change since last quarter versus since last year, while the general trend is still towards higher rents for the entire city.


