We have all been there, enjoying a beautiful afternoon, maybe walking to meet some friends for dinner. Suddenly – SQUISH – uh-oh. In a split second, there is a rush of feelings: anger, sadness, embarrassment or maybe even nausea. You look down, yes, you just stepped in poop. It smells, like really smells, not to mention the awkwardness when you actually step on it.
There are over 84,000 registered dogs in New York City, and the Department of Health estimates it is just 20% of the total dog population. It is not surprising, then, for New Yorkers to be stepping on poop every once in a while. In the study, Doo-Doo, the New Urban Crisis, published by our sister site RealtyHop last year, we concluded that the “shituation” in NYC, unlike in San Francisco, was generally improving, with the Bronx being the sh*ttiest borough. A year has since passed. What changed?
Some of Our Key Findings this Year Include:
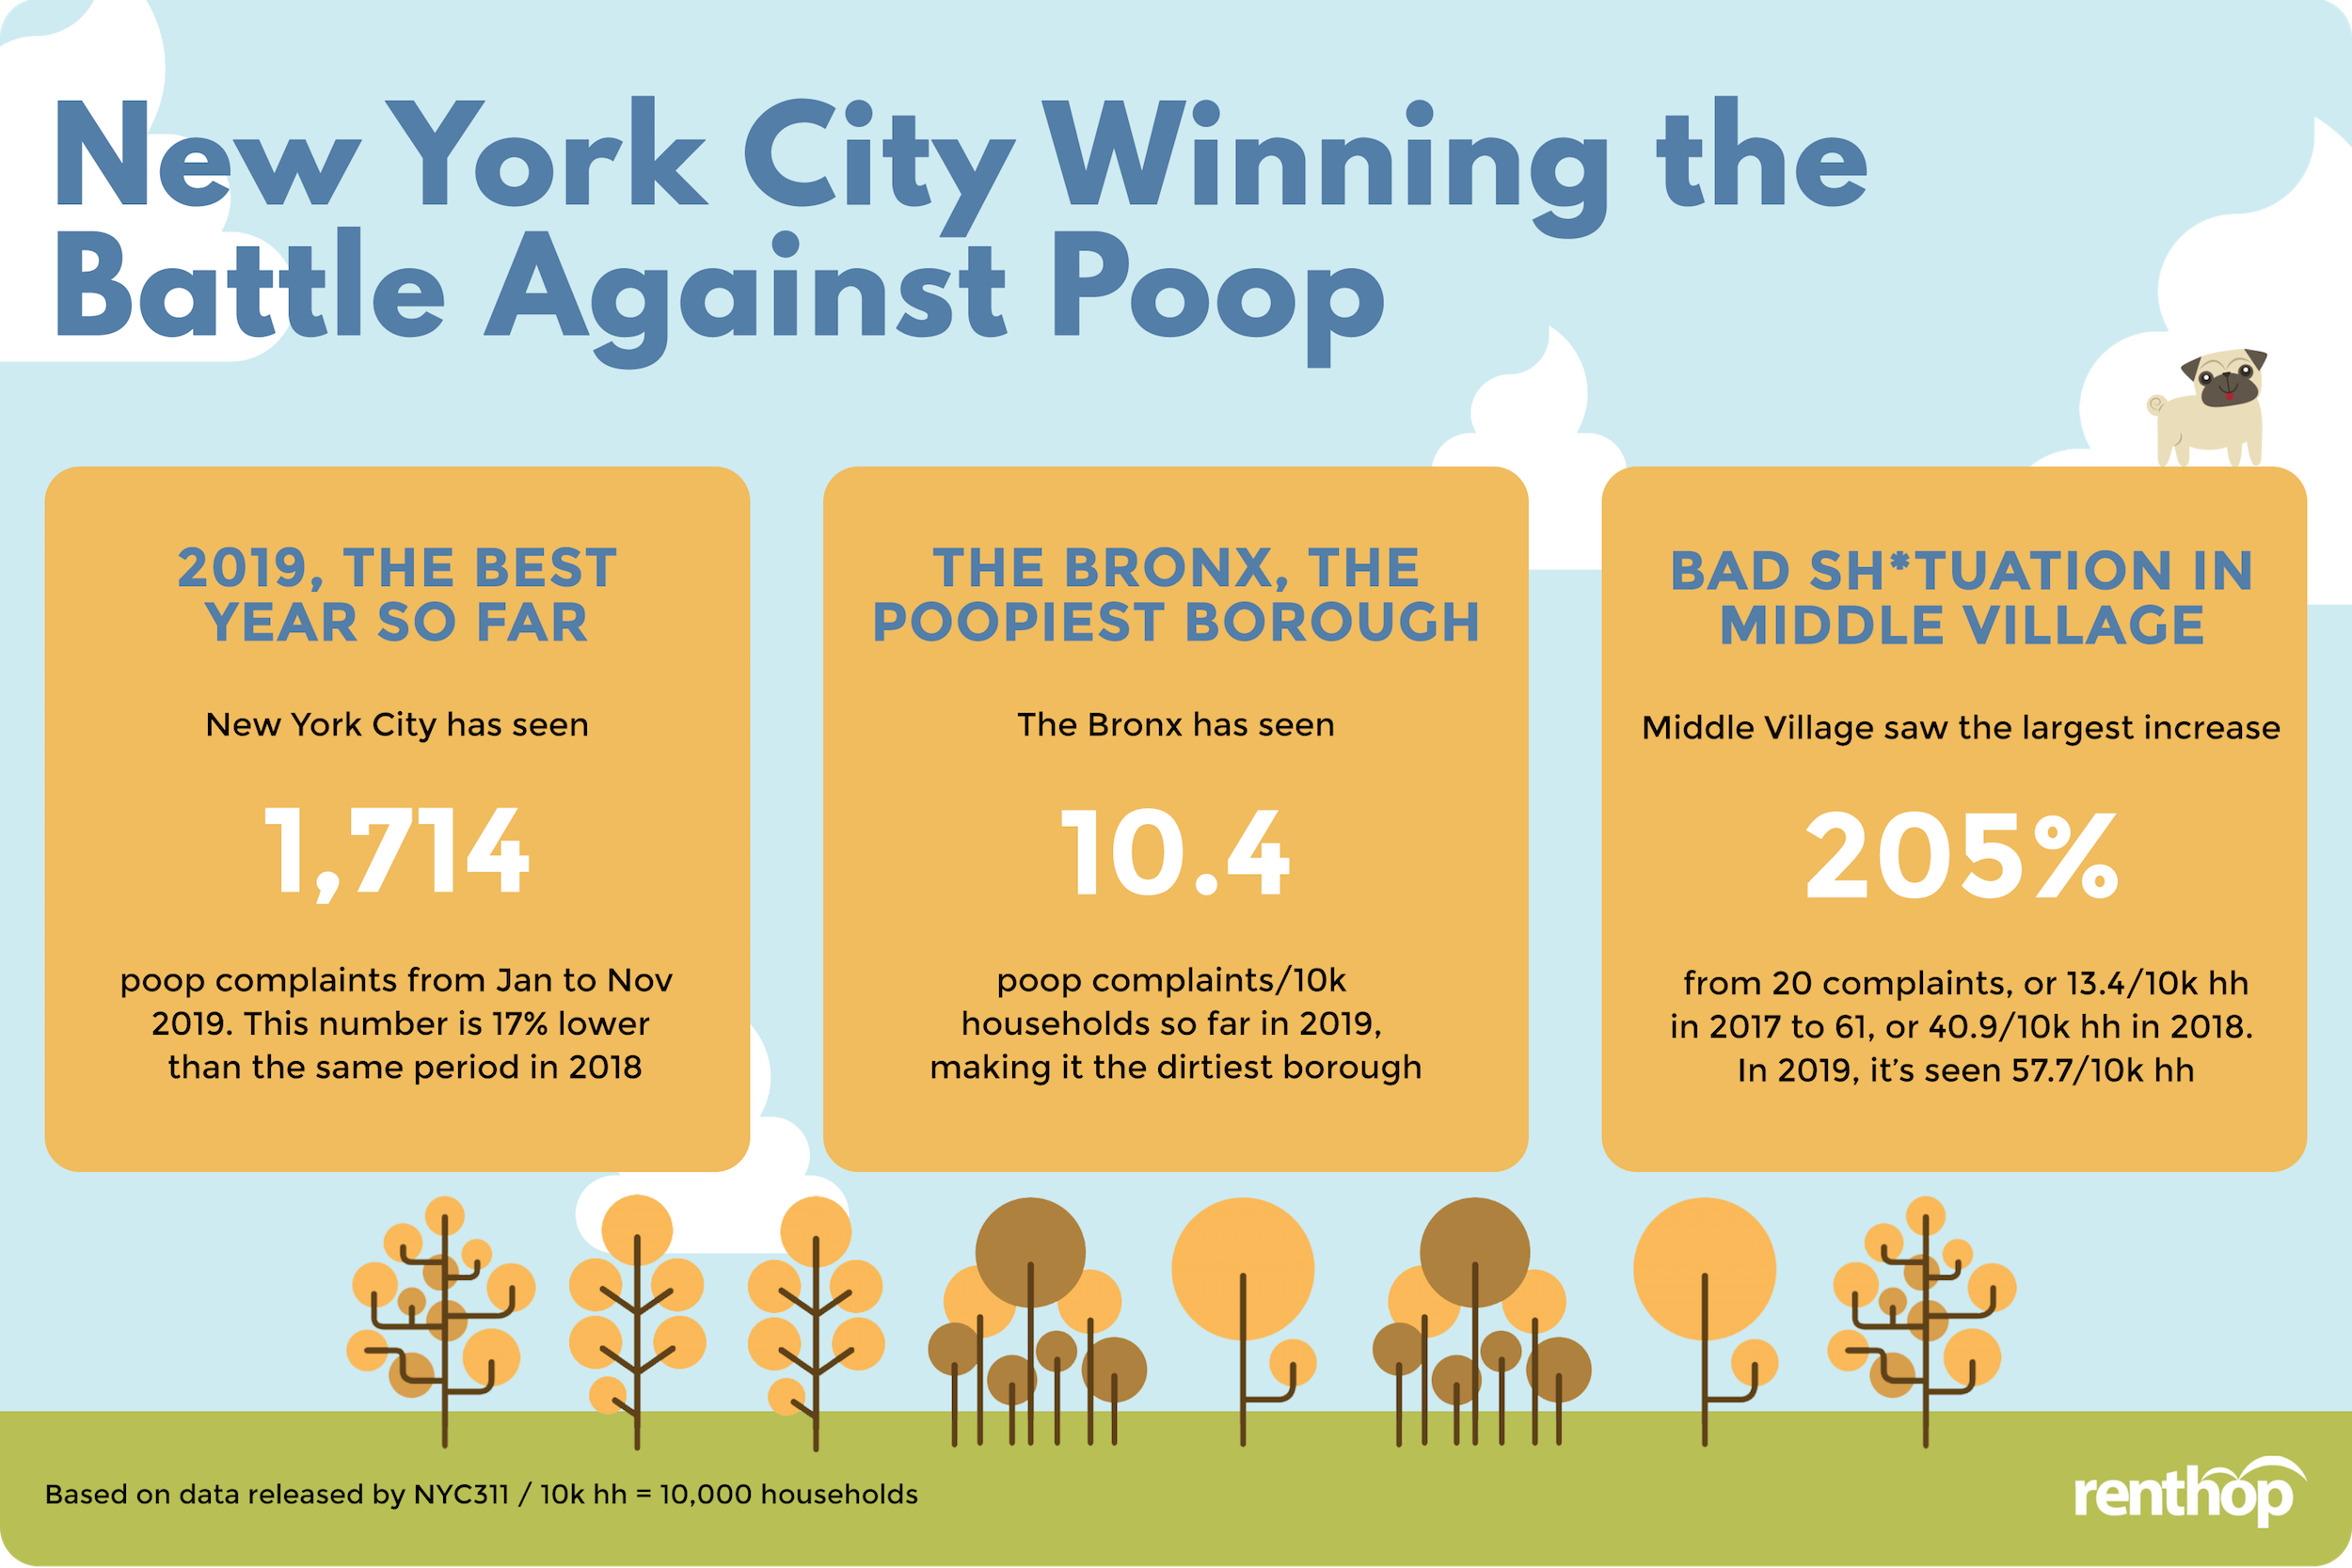
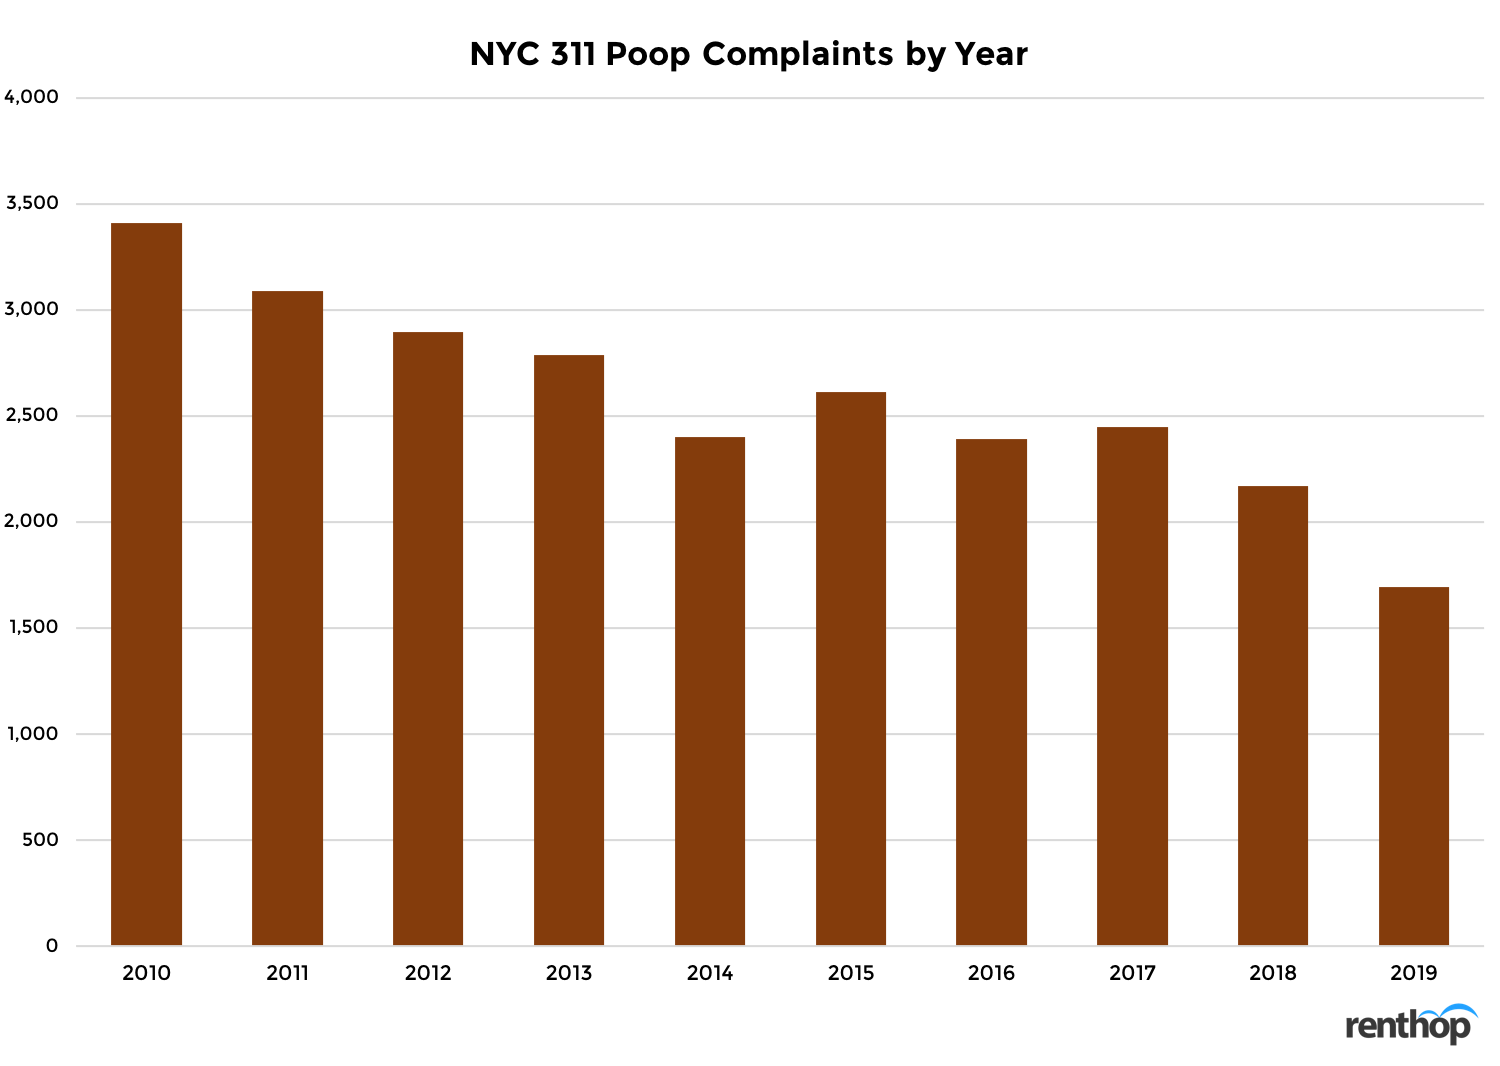
- 2019 is on track to become the best year for New York City in terms of “poop-ness”. So far, the city has received 1,714 poop complaints, around 17.5% fewer than the same period in 2018. [Figure 3]
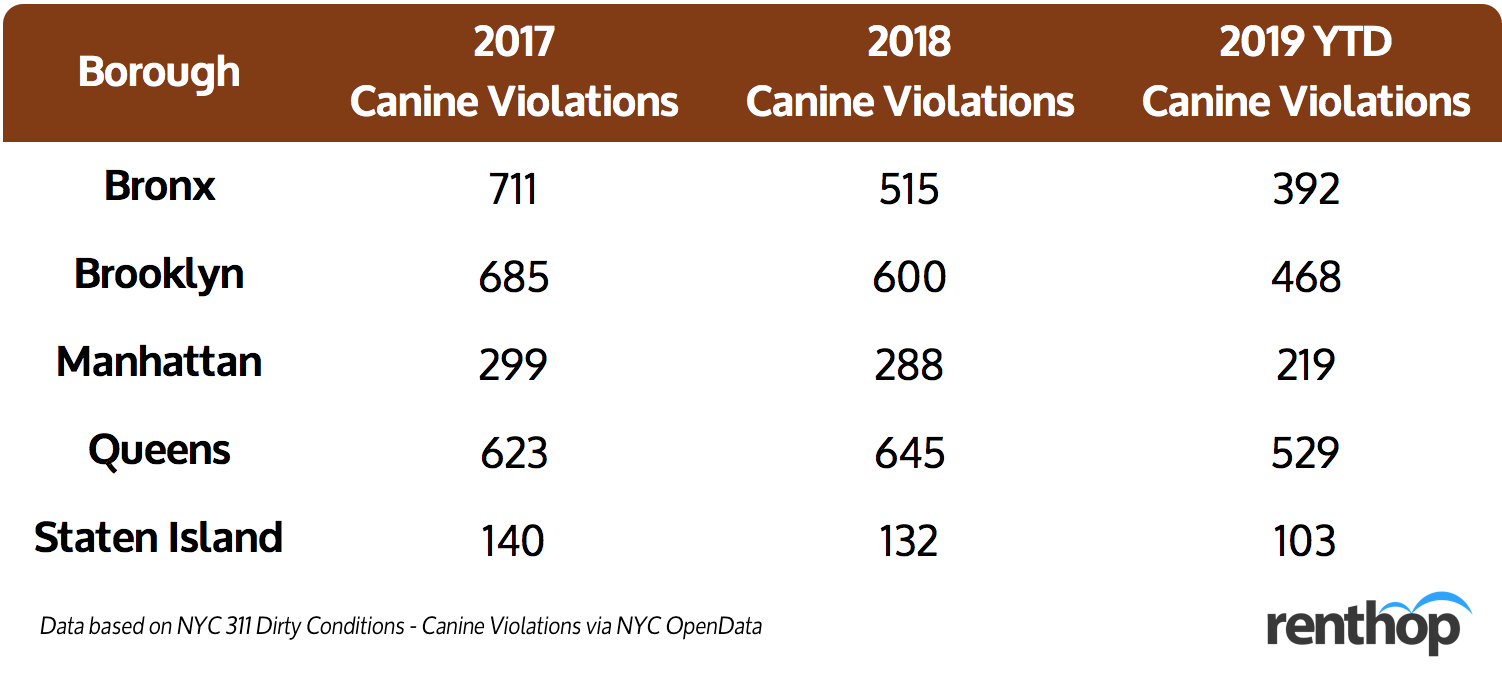
- Queens topped all other boroughs with 645 poop complaints filed in 2018, and 529 so far in 2019. But once factored in the population size, the Bronx, in fact, is the poopiest borough. [Figure 1]
- Manhattan pet owners seem to be more responsible. The borough saw the least number of poop complaints per 10k households, 3.8 in 2018, and 2.9 in 2019.
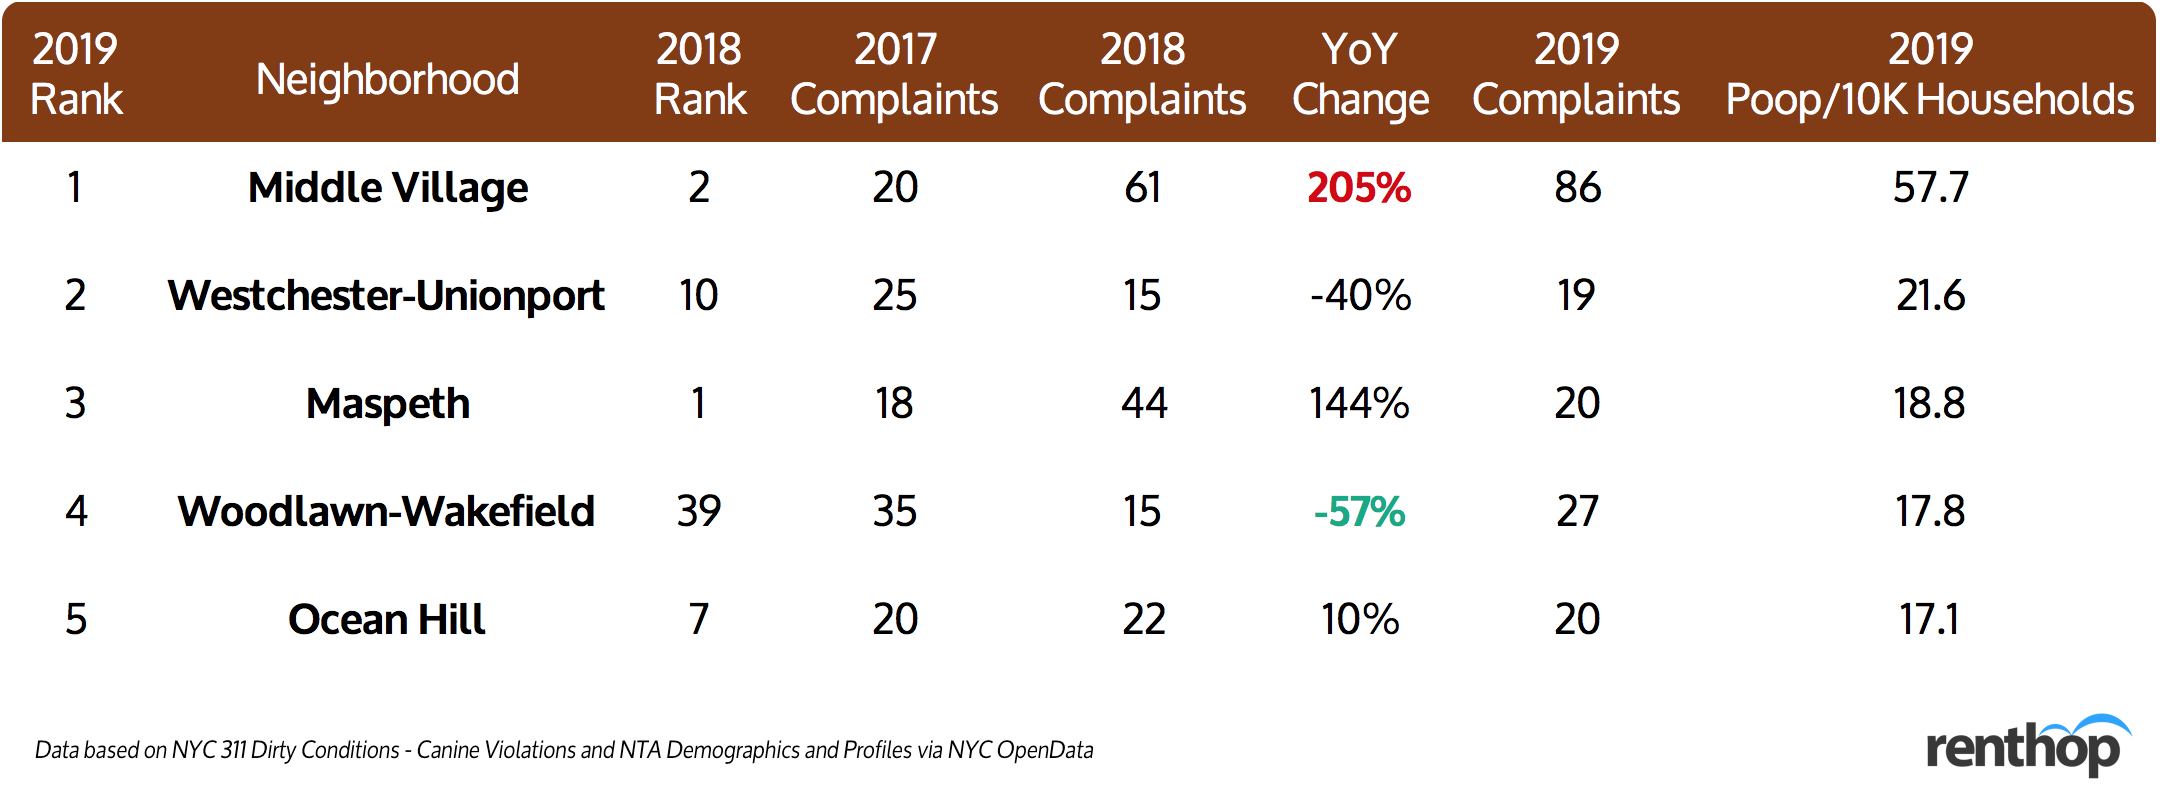
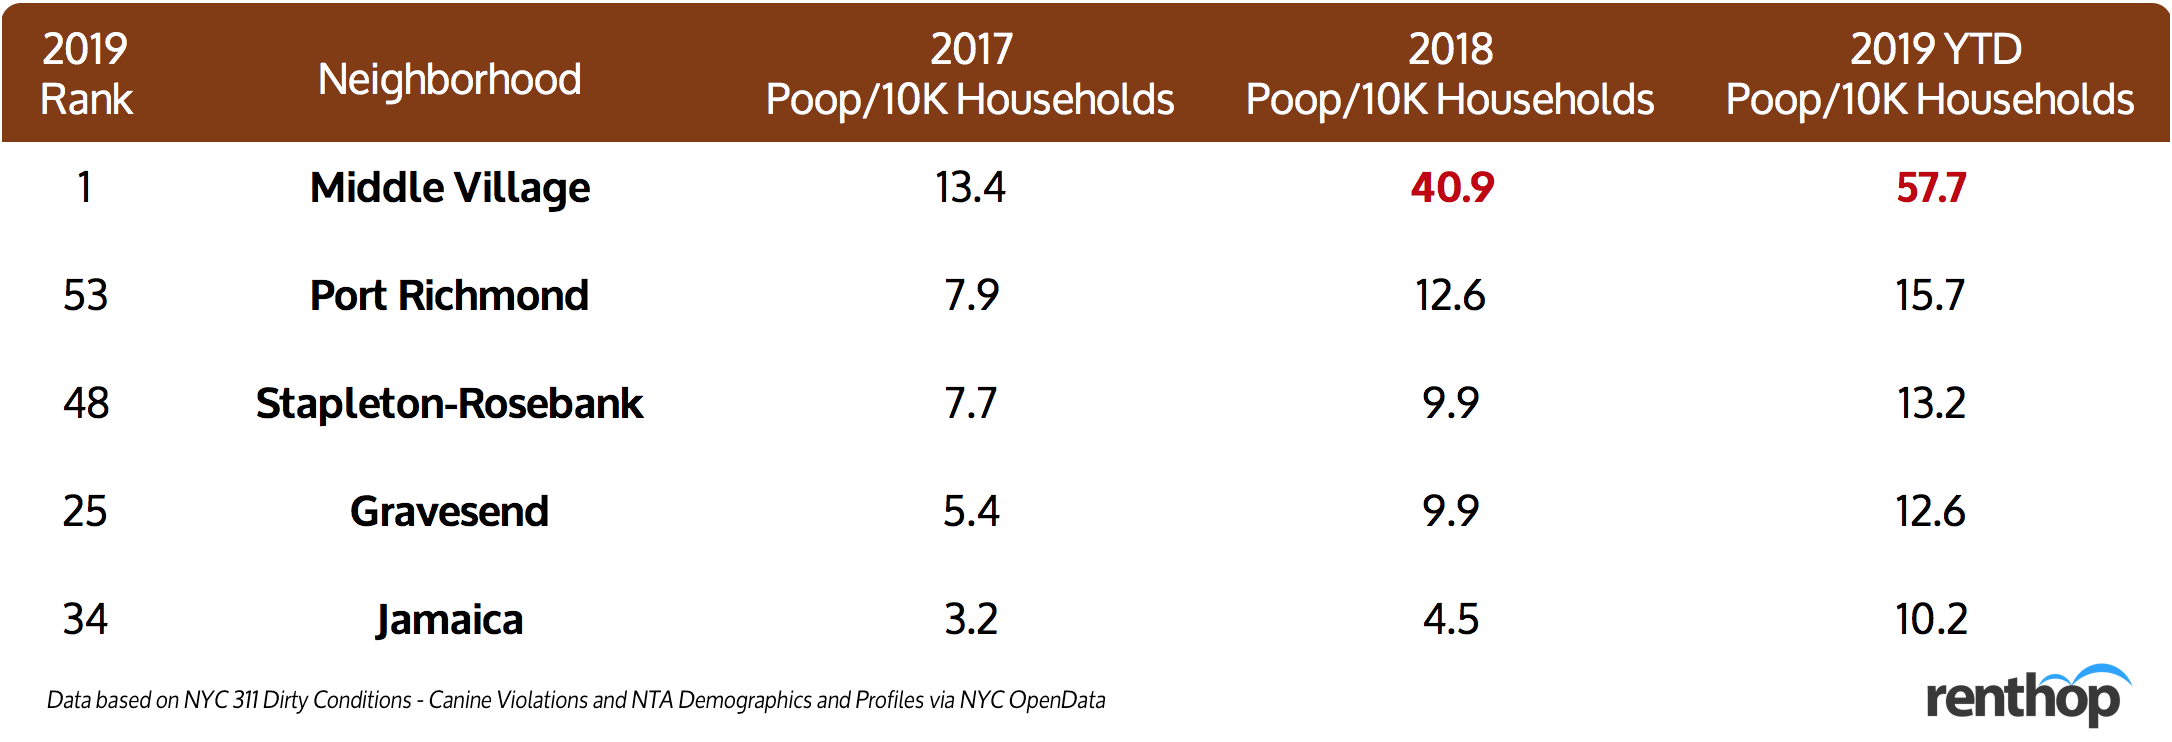
- The shituation is out of control in Middle Village, Queens. The number of poop complaints went up by shockingly 205% from 2017 to 2018. So far in 2019, the neighborhood has seen 86 poop complaints, 41% more than in 2018. This translates to 57.7 poop complaints/10k households in 2019, making the dirtiest neighborhood in New York City. [2019 Poop Map]
- The most reported address, 64-69 59 Avenue, has been reported 50 times in 2019, and 36 times in 2018.
- There is a negative correlation between 2018 median 1-bedroom rent and incidence of poop compliant in 2018. Generally, the higher the rent, the fewer the poop complaints a neighborhood receives. [Figure 2]
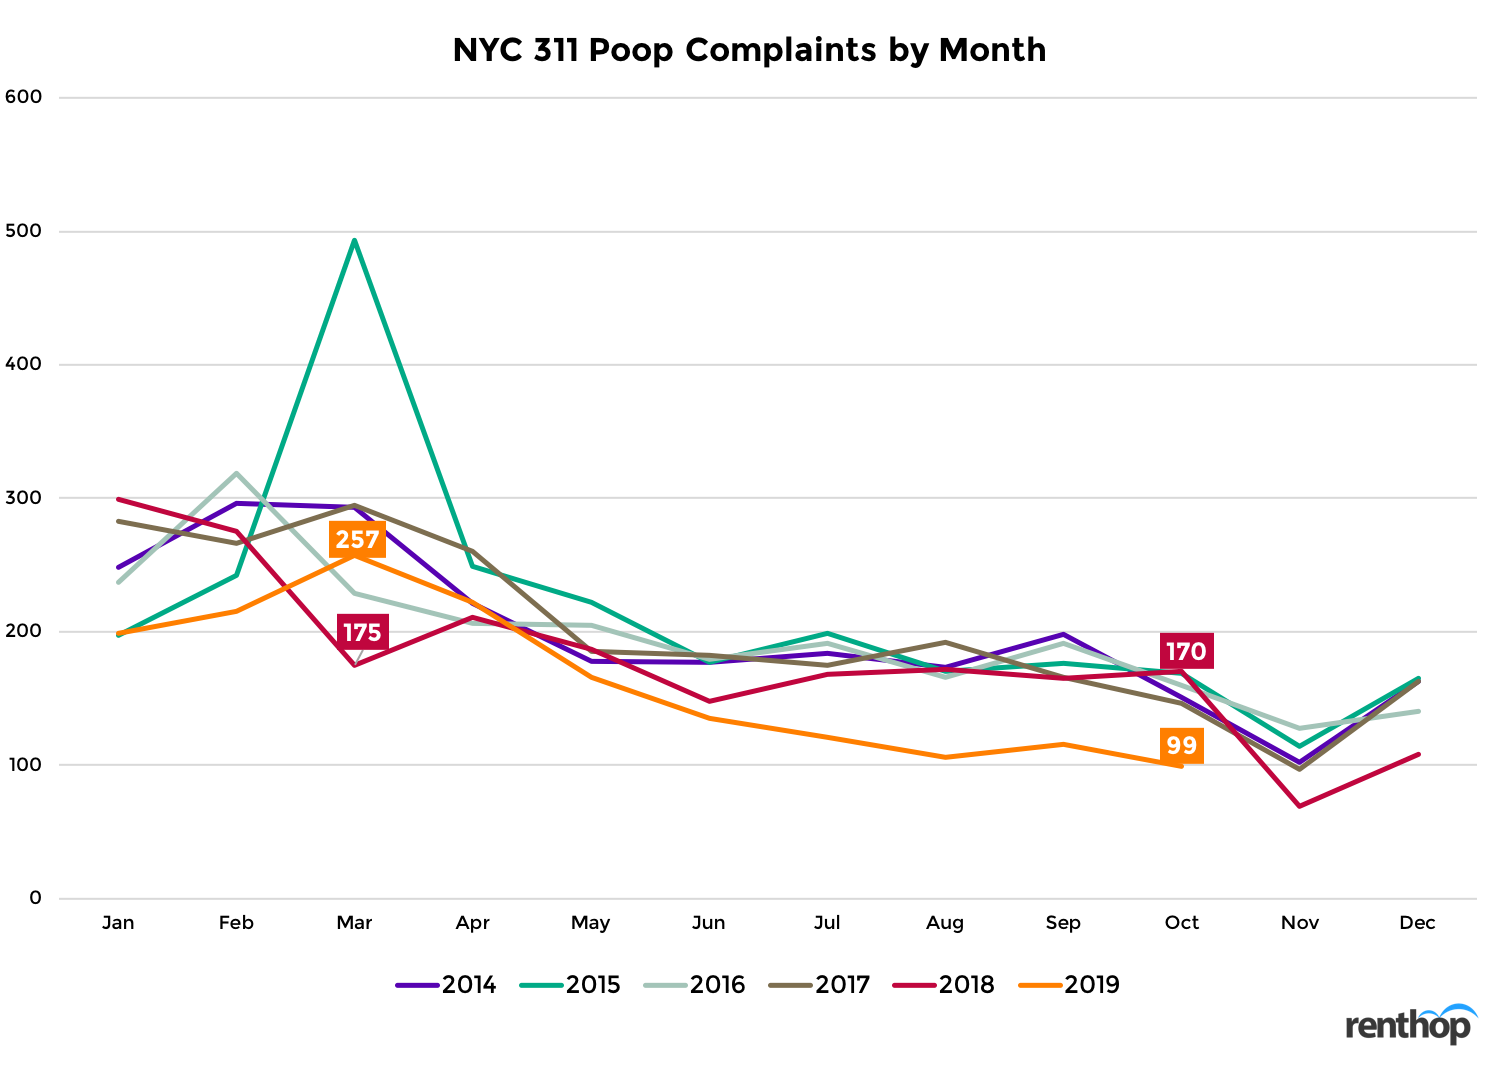
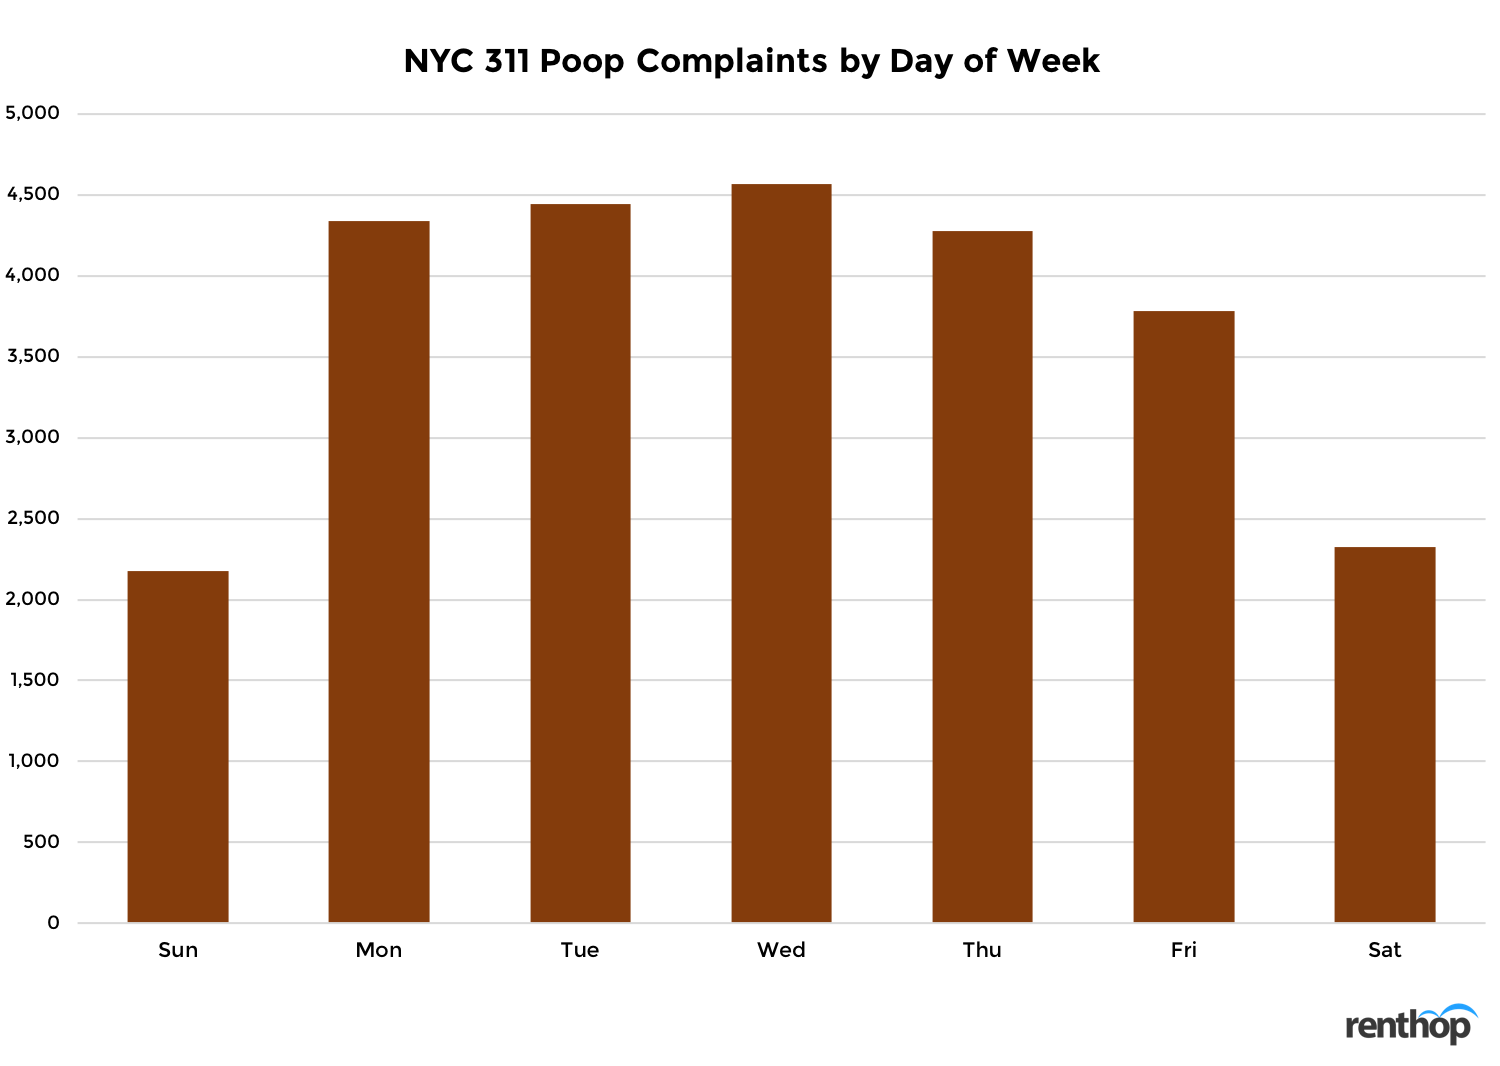
- February and March are historically the months for New Yorkers to dodge the poop. There are also more poop complaints during the week. [Figure 4]
To begin, we first broke down the number of canine violations by borough. Figure 1 includes all poop complaints from in the past three years. Queens topped all other boroughs with in total 645 poop complaints filed in 2018, and as of the first week of November, it has received 529 poop complaints. Note that, however, these numbers are not normalized by the size of each borough. While Queens saw the most canine violations, it is not, after all, the dirtiest borough. Pet owners in the Bronx, in fact, are the least responsible when it comes to cleaning after their furry friends. In 2018, the Bronx received 10.4 poop complaints per 10k households, followed by Queens, with 8.3 poop complaints per 10k households. Manhattan pet owners seem to be more on top of their game with the least number of poop complaints per 10k households – 3.8 in 2018, and 2.9 this year so far.
Where to Watch Out
Aside from analyzing the poop complaints by borough, we also looked at the number of poop complaints by neighborhood. The map below illustrates the “poop-ness” of NYC neighborhoods. The darker the shade, the more poop complaints per 10k households a neighborhood has seen in 2019. You can click on the neighborhood to learn more.
As we can tell from the shades, generally, neighborhoods farther away from the city center tend to have a higher concentration of canine violations. Almost all Manhattan neighborhoods have had fewer than five complaints per 10k households this year, with the exception of Clinton (a.k.a. Hell’s Kitchen), Hamilton Heights, and Central Harlem. Pet owners in Northern Queens also show good etiquette – most neighborhoods have received fewer than six complaints per 10k households this year. But the shades get darker once we are farther away from the city center. Middle Village, among all NYC neighborhoods, has seen the most poop in the year 2019. As of the first week of November, it has seen 86 poop complaints, or 57.7 poop complaints/10k households.
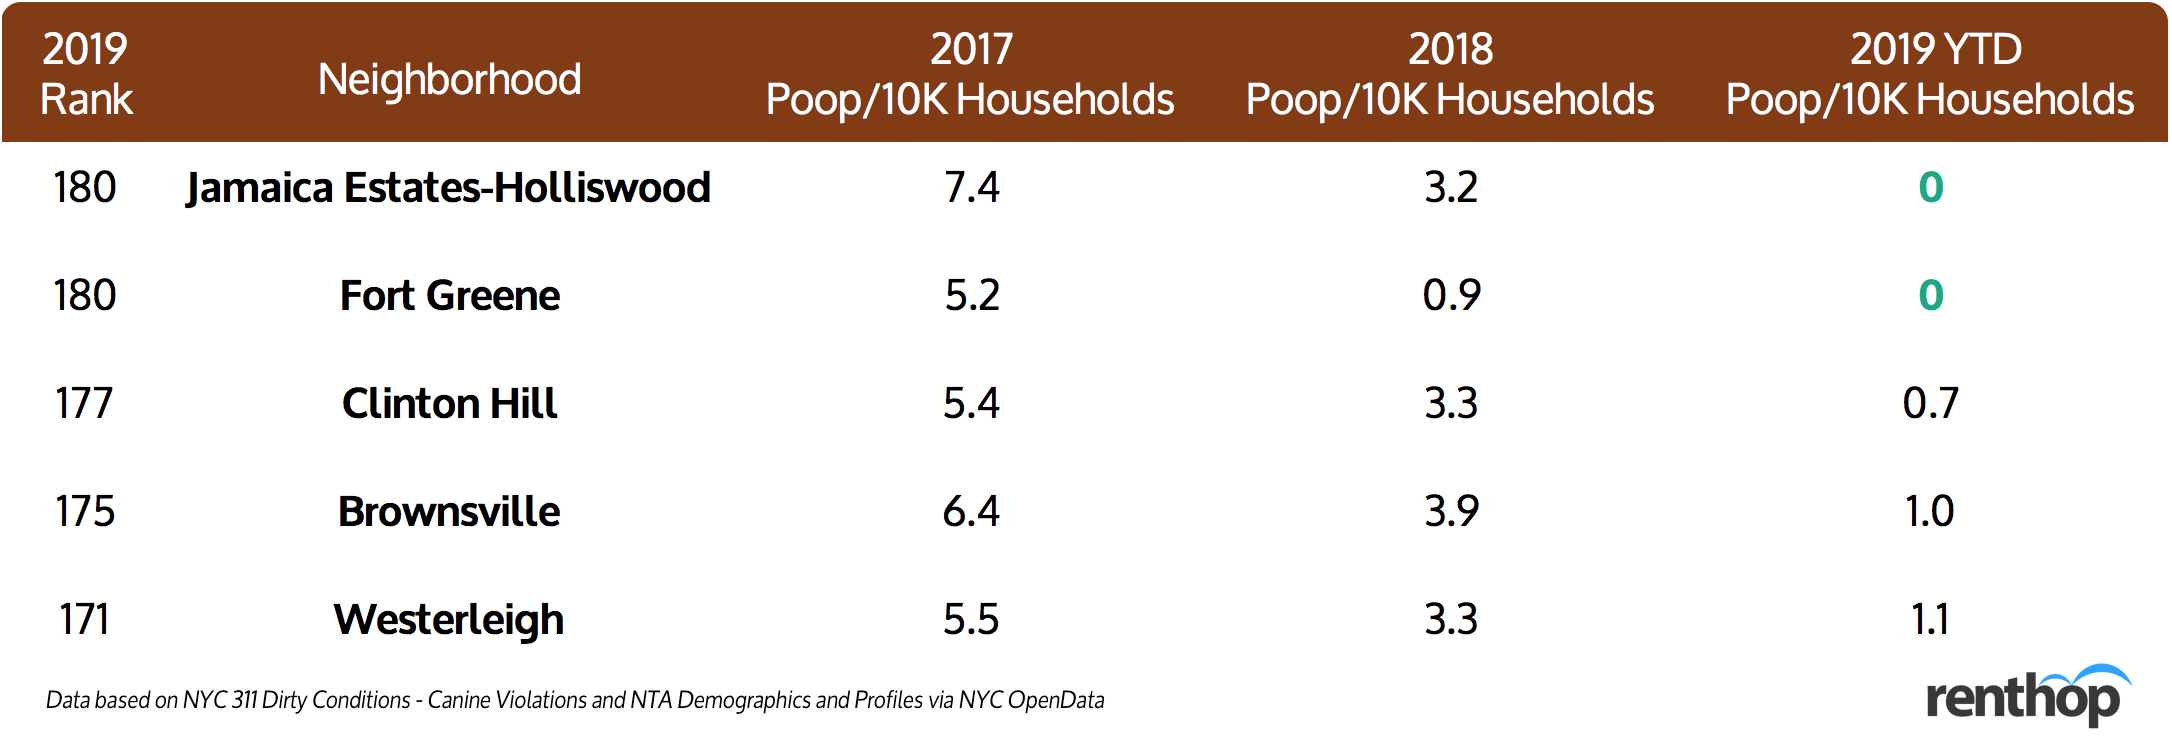
In the Bronx, many neighborhoods have greatly improved from last year, in particular, University Heights-Morris Heights and Bronxdale. But the borough generally still saw more poop per 10k households compared to other boroughs. Williamsburg, Fort Greene, and Brooklyn Heights, among others, are considered the cleanest neighborhoods in Brooklyn. None of them have received any canine violation complaints so far in 2019. While the shituation has gotten mostly under control in Brooklyn, some neighborhoods still experienced an uptick in poop complaints, such as Sunset Park East and Flatbush.
These are the Dirtiest Neighborhoods in New York City
Sh*tuation is Out of Control in these Neighborhoods
Things are Improving in these Neighborhoods
The Higher the Rent, the Fewer the Poop
In addition to the geographical locations of the canine violations and proximity to city center, we also took the time to explore the relationship between rental rates and poop complaints.
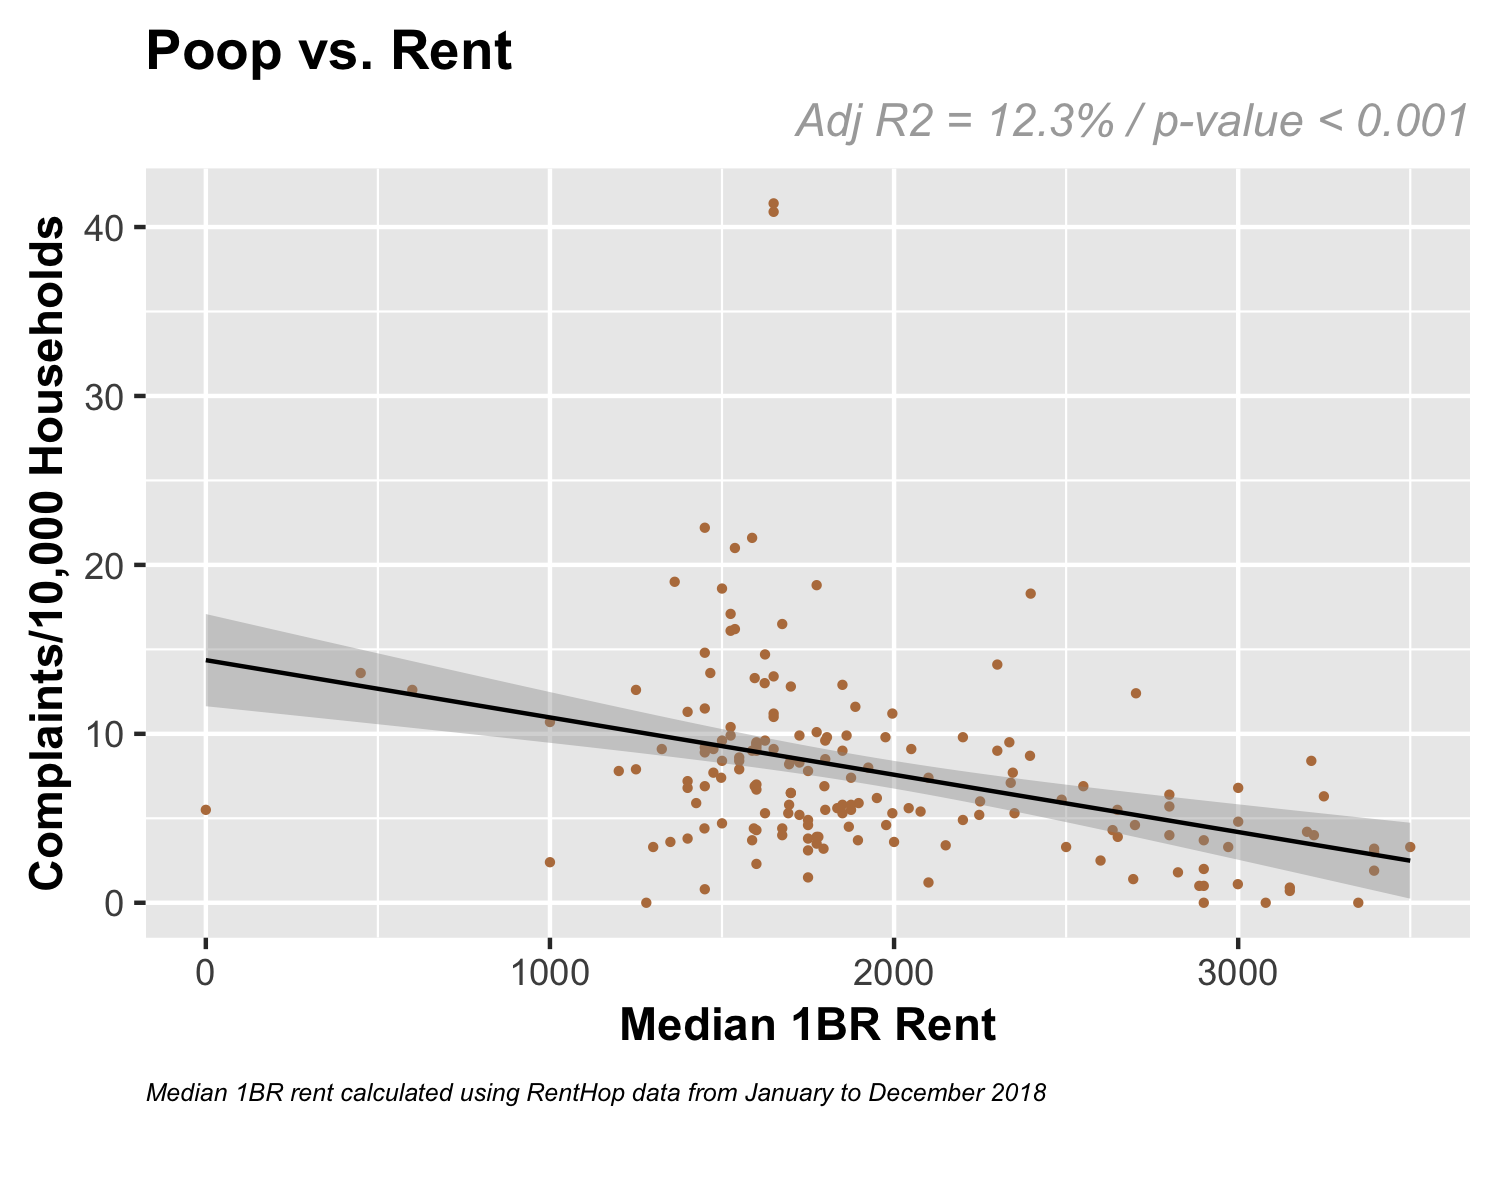
In order to assess the correlation between median 1-bedroom rent and incidence of a canine violation, we plotted the two against one another and calculated the correlation coefficient. We found that there is a negative correlation between 2018 median 1-bedroom rent and the number of poop/10k households (-0.379) in 2018, which states that as rents increase, the observed incidence of poop violation decreases.
NYC is Winning the Battle Against Poop
Good news for New Yorkers – the poop crisis is finally under control. According to the 311 data, the number of reported poop complaints has generally been decreasing since 2011. Figure 5 below shows the downward trend in the number of unique poop complaints per year. While there’s a slight uptick in 2015 and again in 2017, the number of poop complaints generally has been in decline. In 2018, the city received 2,180 canine violations from New Yorkers, 11% fewer than the previous year. As of early November, there have been 1,714 canine violations in 2019.
When to Watch Out for Poop
In addition to where to watch out for poop, we also broke down complaints by month and day of the week. In New York City, February and March are historically the worst months. The shituation, then, improves as the weather gets warmer, and the number of complaints stays low throughout the rest of the year. Moreover, it seems that 2019 is going to be a good year. October 2019 marked the best month of October since 2011, with only 99 poop complaints. So far, the number in 2019 has been consistently lower compared to previous years.
When breaking down the data by day of the week, we noticed that Wednesday (4,567 complaints in total) is the worst day in terms of cleanliness, followed by Tuesday (4,442), and Monday (4,334). People also tend to skip weekends. Could it be that many New Yorkers go out of town on weekends, or could it be that pet owners are more relaxed on weekends and therefore have more time to pick up the doo-doo?
Methodology
To conduct this study, we collected all dirty conditions – canine violations data made public by NYC311 via the NYC OpenData portal. Each canine violation equals one poop complaint. To make sure that we map the complaints in the right neighborhood, we geocoded every incident using the latitude and longitude provided in the dataset. The neighborhoods adopted in this study are the “Neighborhood Tabulation Areas”, and the household counts are based on the information included in the Demographics and Profiles at the NTA level. The household counts at the borough level are based on the U.S. Census data.
Note that to properly address the NYC shituation and compare the neighborhoods, we first removed duplicates by date and location. We did so since multiple residents can complain about the same pile of doo-doo and would not be aware whether the issue they see has already been reported. We then normalized the unique poop count by the household counts so we could fairly rank neighborhoods.


