Chicago has been considered a dangerous city in many respects since as early as the 1960s and, in many years, has been considered the “murder capital” of the United States. While the crime rate seems to be in decline, the city’s overall crime rate, especially the violent crime rate, is still higher than the national average.
According to the most recent FBI UCR Crimes in the United States report for the period from January 2019 to June 2019, the number of violent crimes per 10,000 population dropped 7% from 48.0 to 44.6. However, compared to other major U.S. cities, such as New York (26.07 crimes/10k pop) and Los Angeles (35.33 crimes/10k pop), Chicago still has one of the highest crime rates. It is no wonder many people are now leaving their homes after decades in Chicago. With attention focused on shootings and gun crimes in Chicago, RentHop’s data science team has taken a look at violent crime in the city to gather insights about how one can evaluate neighborhoods in the context of violent crime.
Our key findings this year include:
- Fuller Park, albeit small, is the most dangerous neighborhood in Chicago. In 2019, the neighborhood saw 289 violent crimes, which translates to 1,184.9 crimes/10k pop.
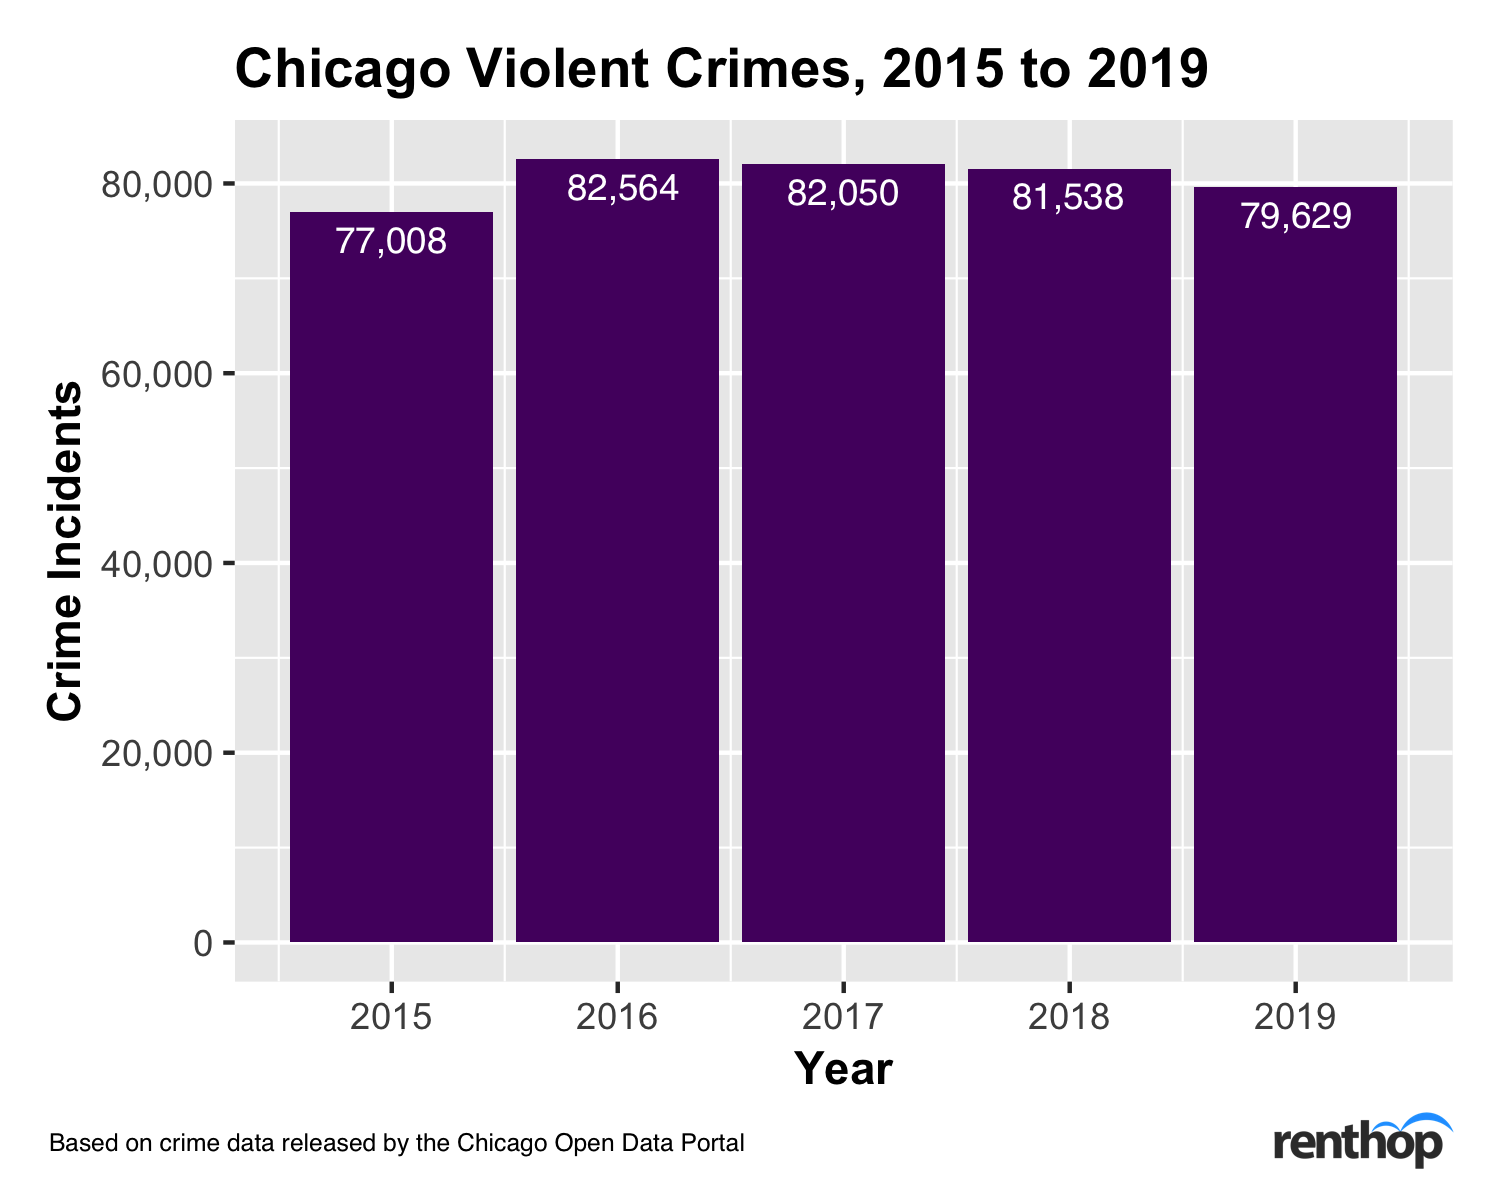
- Generally speaking, crimes are in decline in Chicago. The number of violent crimes jumped 7.2% in 2016 and continued to stay in the 80,000 range through 2018. In 2019, 79,629 violent crimes were reported, 2.3% fewer than 2018.
- The top 10 most dangerous neighborhoods generally saw fewer crimes in 2019 except Greater Grand Crossing. The neighborhood saw a spike in crimes, from 2,461 to 2,668, 8.4% higher than the year prior.
- While Forest Glen is one of the safest neighorhoods in Chicago, the crime rate, in fact, went up by 27.6% from 2018 to 2019.
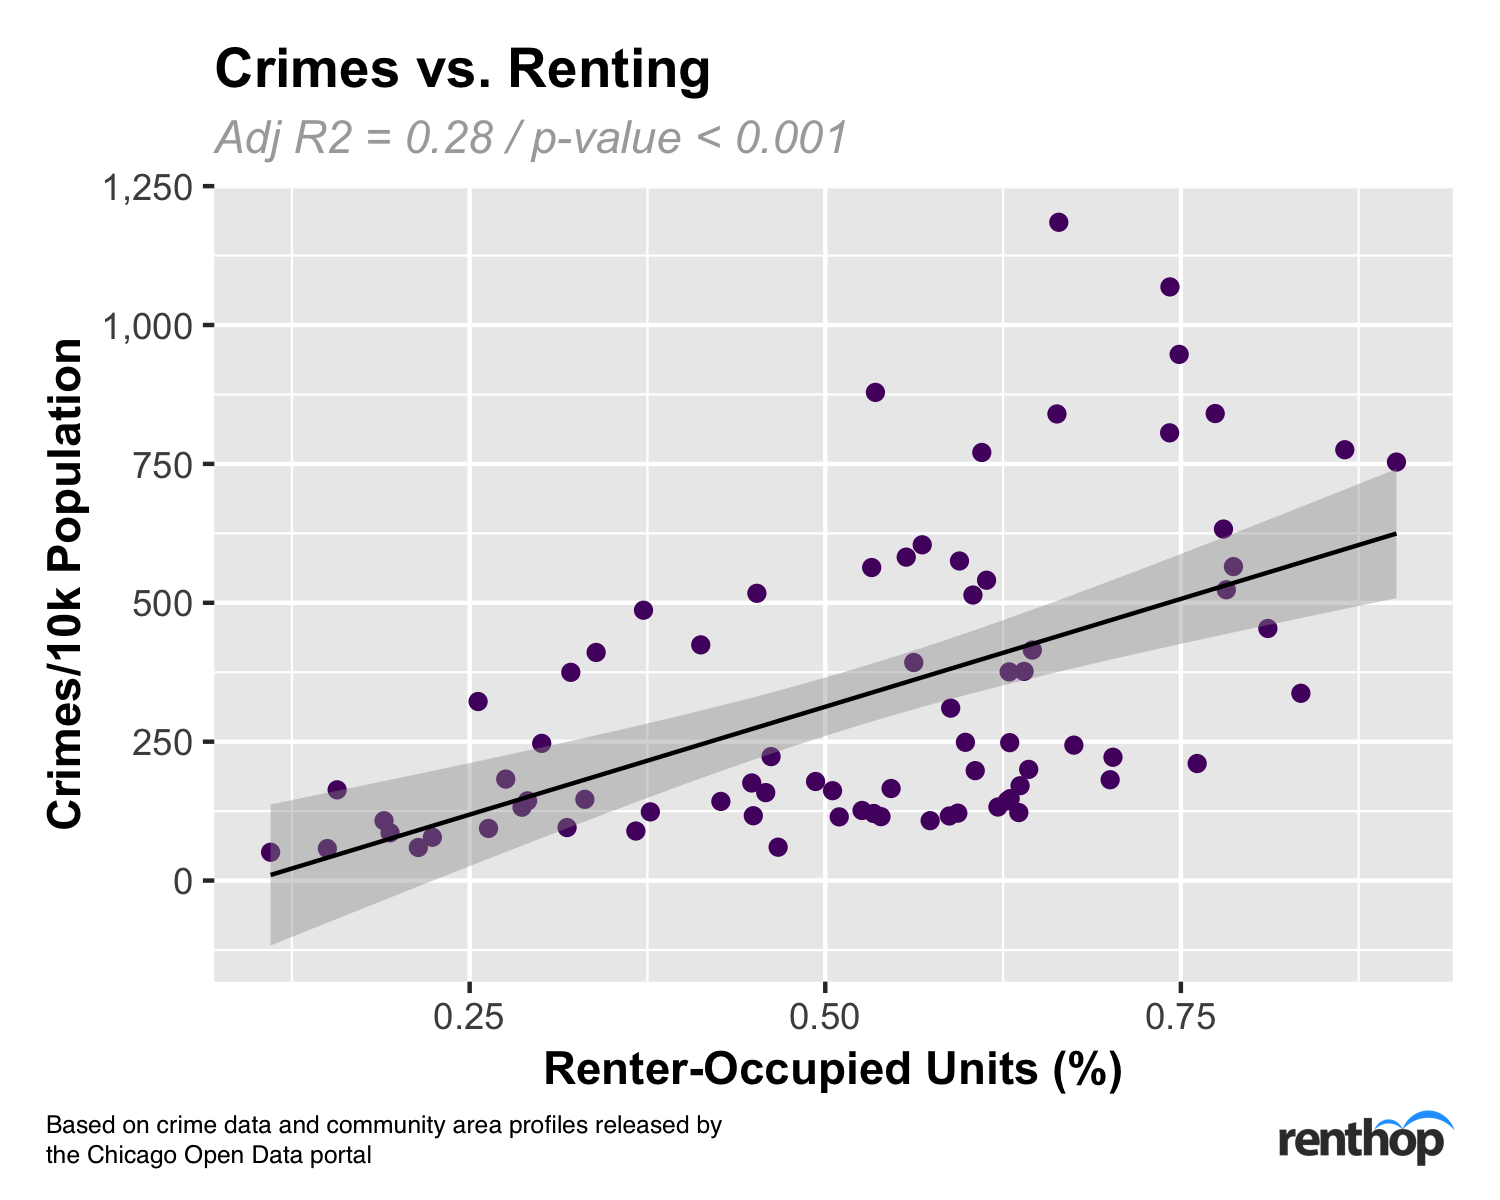
- We found a positive correlation between the percentage of renter-occupied units and the number of reported crimes/10k pop. In other words, the more renter-occupied units in a given neighborhood, the more violent crimes that neighborhood experienced in 2019.
Chicago Violent Crimes, 2015 to 2019
We started out by looking at the changes in the number of reported crime incidents in the past five years. In 2015, in total 77,008 violent crime incidents were documented. The number then jumped up by 7.2% in 2016 and continued to stay at the 80,000 range until 2018. In 2019, 79,629 violent crime incidents were reported, 2.3% fewer than the year prior. However, it is unknown whether the decline would continue.
Is Your Neighborhood Safe Enough?
The interactive map below shows violent crimes in 2019 along with neighborhood statistics such as population and median 1BR rent. The darker the shade, the higher the crime rate. Note that, in order to rank the neighborhoods impartially, we normalized the crime data by the population count in each neighborhood. Why did we do that? Hypothetically, neighborhoods with denser populations might see more criminal activities and normalization allows us to fairly compare the number of crimes from different neighborhoods.
We can tell from the shades that the north part of the city appears to be safer with fewer crimes reported. However, it doesn’t look like there’s a significant correlation between crime rates and proximity to the city center. Englewood, Fuller Park, and West Garfield Park, among others, had more violent crimes/10k pop in the past year. Meanwhile, Forest Glen, Mount Greenwood, and Norwood Park are some of the safest places in Chicago. The orange clusters show the locations of all violent crimes reported in 2019. Click on the neighborhoods to learn more, and you can reset the map by clicking on the ‘reset’ button in the upper left corner.
These are the Most Dangerous Neighborhoods in Chicago
- Fuller Park – 289 reported violent crime incidents, or 1,184.9/10k pop in 2019
- West Garfield Park – 1,834 reported violent crime incidents, or 1,068.6/10k pop in 2019
- Englewood – 2,375 reported violent crime incidents, or 947.2/10k pop in 2019
- West Englewood – 2,630 reported violent crime incidents, or 878.7/10k pop in 2019
- East Garfield Park – 1,681 reported violent crime incidents, or 840.7/10k pop in 2019
- Greater Grand Crossing – 2,668 reported violent crime incidents, or 839.9/10k pop in 2019
- North Lawndale – 2,897 reported violent crime incidents, or 805.9/10k pop in 2019
- Washington Park – 892 reported violent crime incidents, or 775.5/10k pop in 2019
- Chatham – 2,398 reported violent crime incidents, or 770.6/10k pop in 2019
- Riverdale – 557 reported violent crime incidents, or 753.3/10k pop in 2019
These are the Safest Neighborhoods in Chicago
- Forest Glen – 97 reported violent crime incidents, or 51.0/10k pop in 2019
- Mount Greenwood – 111 reported violent crime incidents, or 57.6/10k pop in 2019
- Edison Park – 69 reported violent crime incidents, or 59.5/10k pop in 2019
- North Center – 215 reported violent crime incidents, or 60.7/10k pop in 2019
- Norwood Park – 289 reported violent crime incidents, or 77.9/10k pop in 2019
- Beverly – 179 reported violent crime incidents, or 86.0/10k pop in 2019
- Jefferson Park – 239 reported violent crime incidents, or 89.2/10k pop in 2019
- Dunning – 410 reported violent crime incidents, or 93.8/10k pop in 2019
- Clearing – 247 reported violent crime incidents, or 95.4/10k pop in 2019
- Garfield Ridge – 392 reported violent crime incidents, or 107.7/10k pop in 2019
While Crimes Are in Decline, these Neighborhoods Have Become More Dangerous
- Forest Glen – 76 reported crimes in 2018, 97 in 2019 (+27.6%)
- West Elsdon – 222 reported crimes in 2018, 254 in 2019 (+14.4%)
- Near South Side – 527 reported crimes in 2018, 472 in 2019 (+11.7%)
- Gage Park – 718 reported crimes in 2018, 653 in 2019 (+10.0%)
- Chatham – 2,181 reported crimes in 2018, 2,398 in 2019 (+9.9%)
These Neighborhoods Have Become Safer
- McKinley Park – 251 reported crimes in 2018, 184 in 2019 (-26.7%)
- Albany Park – 779 reported crimes in 2018, 631 in 2019 (-19.0%)
- Washington Park – 1,070 reported crimes in 2018, 892 in 2019 (-16.6%)
- East Side – 416 reported crimes in 2018, 347 in 2019 (-16.6%)
- Hegewisch – 202 reported crimes in 2018, 172 in 2019 (-14.9%)
What Kind of Neighborhood is Safer?
In addition to geographical location, we also looked at a few other factors that may affect crime rates. While we didn’t find any correlation between rental rates and crime rates, we found that, in Chicago, there’s a positive correlation (roughly 28%) between neighborhood crime rates and the number of rented units of all occupied housing units within a neighborhood. In other words, the more rented units there are in a neighborhood, the more crimes were reported by residents. Many scholars and research institutions have emphasized the social benefits of stable housing, and that rings true based on what we’ve found in Chicago.
Methodology
To better understand crimes in Chicago, we pulled the crime data made public by the Chicago Police Department via the Chcago Open Data portal. For this study, violent crimes mainly include homicide, robbery, assault, battery, kidnapping, and criminal sexual assault. We first removed duplicates based on time, date, type of crime, and location, and then geocoded each reported crime to corresponding neighborhoods using the coordinates provided by the open data portal. Other neighborhood information, including population count and renter-occupied units, was retrieved from the community data snapshots.
What Does it Mean for You?
Finding the right place to live is not easy, especially when you have to consider safety, unit availability, monthly rent, commute, etc. by analyzing the reported crime incidents in Chicago and median 1BR rent, we at RentHop believe that we better serve all renters, especially those who care about safety. After all, no one should live in fear.


