Chicago has been considered a dangerous city in many respects since as early as the 1960s and, in many years, has been considered the “murder capital” of the United States. Despite the city’s effort to combat crimes, public safety continues to be the top #1 concern of many residents in Chicago. One minute we hear the Police Department announce that the crime volume has been in decline in recent months, and the next minute we see notifications popping up on our phones about shootings and homicides (remember the four shootings on September 1st?).
To better understand the criminal activity in Chicago, we at RentHop looked into the crime data released by the Chicago Police Department, and here are our key findings:
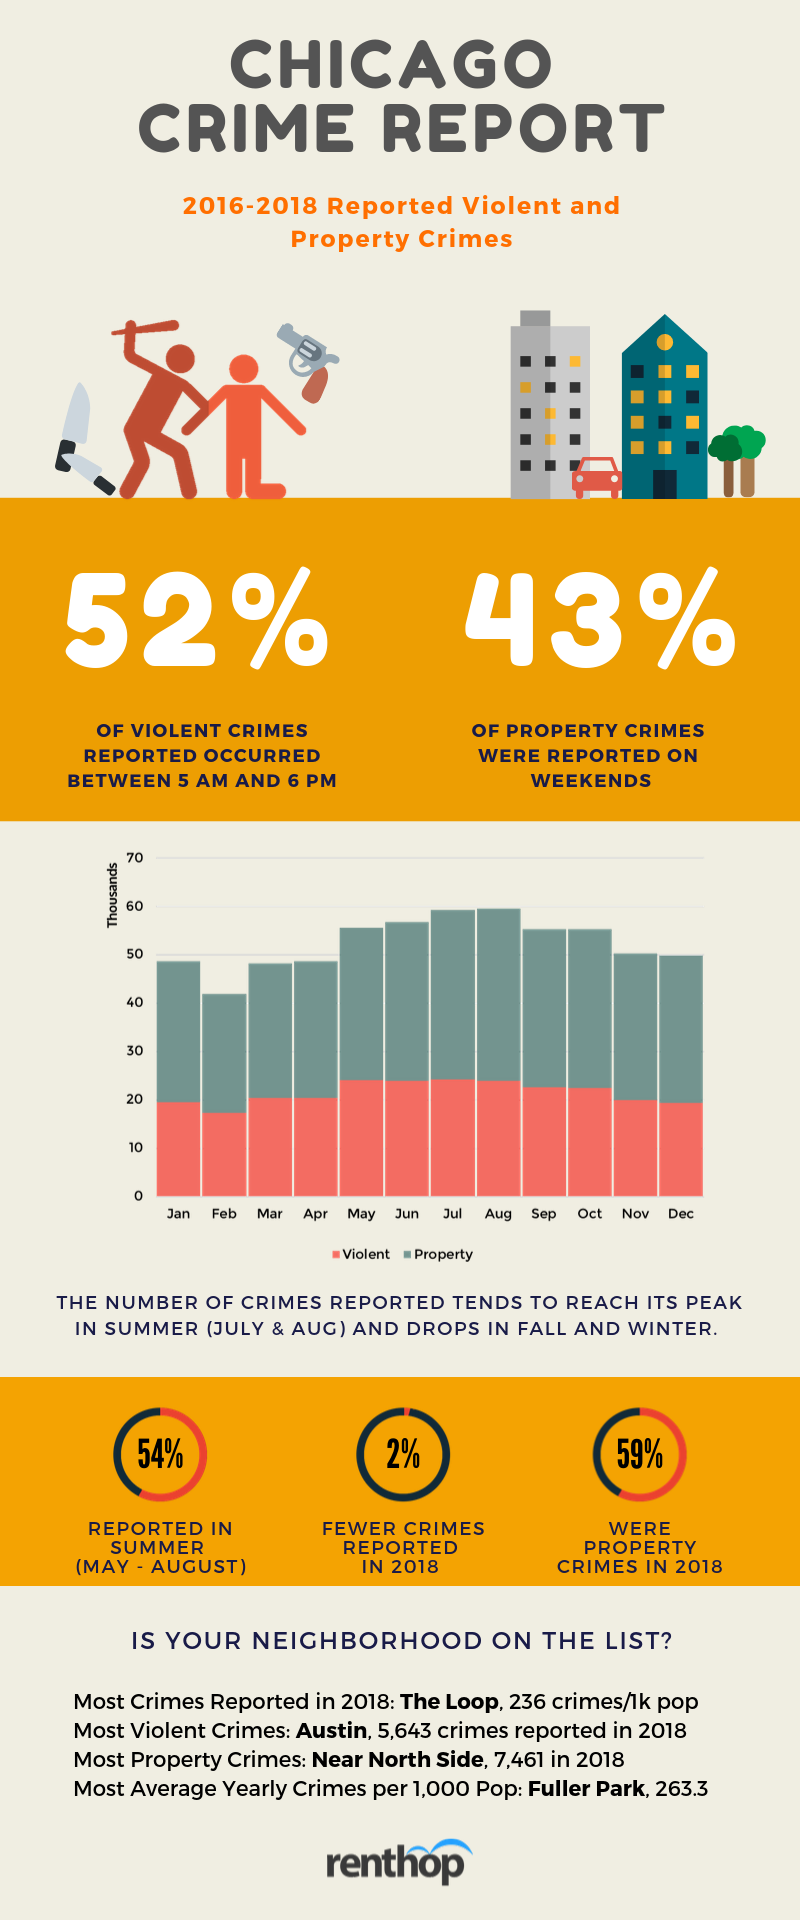
- The number of crimes reported is dropping in Chicago. In 2018, 207,425 crimes were reported by Chicagoans, 1.6% fewer than in 2017.
- In 2018, Chicago saw more property crimes than violent crimes. According to the data, over 121,000 property crimes were reported in 2018, compared to 85,707 violent crimes.
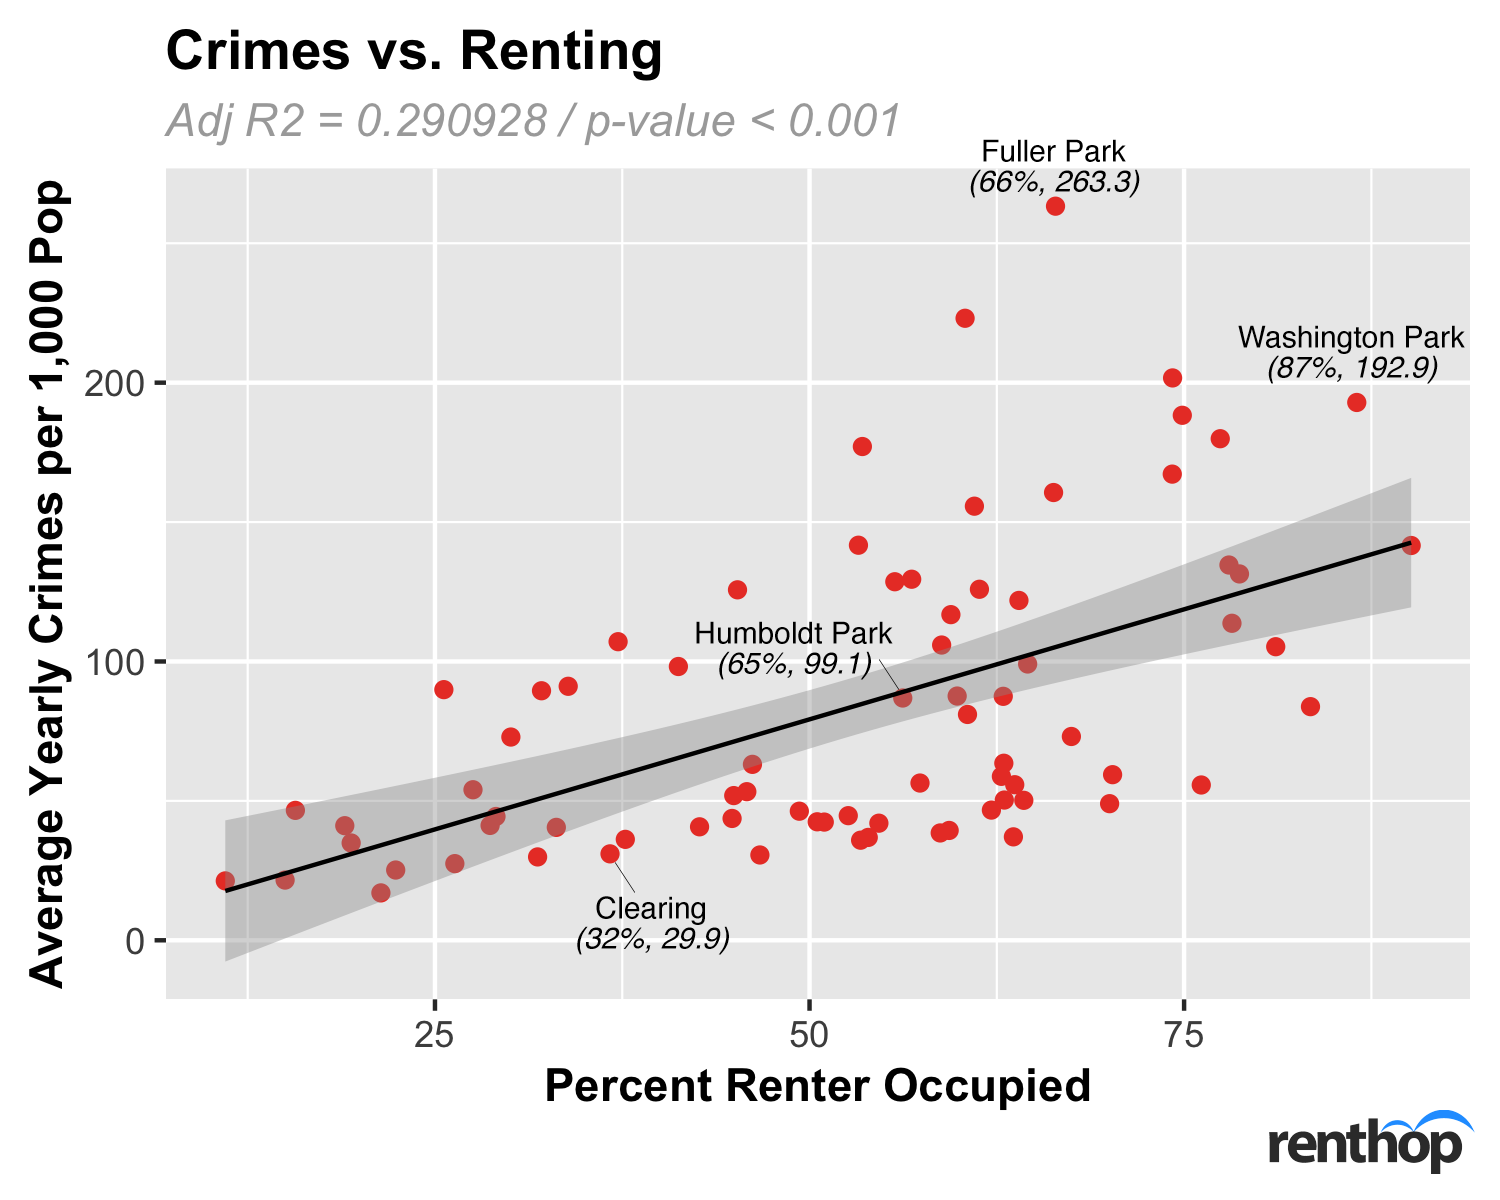
- Fuller Park, among all areas, is the most dangerous neighborhood in Chicago, averaging 263.3 crimes per 1,000 population per year. In 2018, the neighborhood saw 306 property crimes and 266 violent crimes.
- Edison Park, on the other hand, is the safest area in Chicago. The neighborhood only saw 77 violent crimes and 107 crimes, which translates into 15.9 crimes/1,000 pop in 2018.
- From 2016 to 2018, 52% of violent crimes reported to the Police Department occurred between 5 am and 6 pm and 43% of property crimes were reported on weekends.
- Crime volume tend to go up slightly in summer and fall. Analyzing the crime data from 2016 to 2018, we noticed that around 36% of the crimes in the database were reported between May and August and 17% between September and October.
- There’s a positive correlation (roughly 30%) between the number of crimes reported and the number of units rented within a neighborhood. Put simply, the more units occupied by renters, the more crimes reported.
Crimes in Chicago – Where Does Your Neighborhood Stand?
The interactive map below shows the number of crimes reported by neighborhoods. The darker the shade, the higher the crime rate. Note that, in order to rank impartially, we normalized the crime data by the population count in each neighborhood. Why did we do that? Hypothetically, neighborhoods with denser populations might see more criminal activities and normalization allows us to fairly compare the number of crimes from different neighborhoods.
We can tell from the shades that the north part of the city appears to be safer with fewer crimes reported. However, it doesn’t look like there’s a significant correlation between crime rates and proximity to the city center. The Loop, Fuller Park, West Garfield Park, and Washington Park, among others, have more average yearly crimes per 1,000 population. Meanwhile, Forest Glen, Edison Park, and Norwood Park are some of the safest places in Chicago. The orange clusters show the locations of all crimes reported in 2018. Click on the neighborhoods to learn more, and you can reset the map by clicking on the ‘reset’ button in the upper left corner.
Violent Crime Volume Went Up in These Neighborhoods in 2018
- Pullman – 309 violent crimes in 2017, 373 in 2018, +21%
- Jefferson Park- 256 violent crimes in 2017, 292 in 2018, +14%
- Calumet Heights – 491 violent crimes in 2017, 560 in 2018, +14%
- Lincoln Park – 701 violent crimes in 2017, 792 in 2018, +13%
- Edgewater – 704 violent crimes in 2017, 792 in 2018, +13%
Property Crime Volume Went Up in These Neighborhoods in 2018
- Hyde Park – 947 property crimes in 2017, 1,173 in 2018, +24%
- Lincoln Park- 3,026 property crimes in 2017, 3,483 in 2018, +15%
- Jefferson Park – 519 property crimes in 2017, 585 in 2018, +13%
- Garfield Ridge – 930 property crimes in 2017, 1,030 in 2018, +11%
- Norwood Park – 555 property crimes in 2017, 614 in 2018, +11%
What Kind of Neighborhoods is Safer?
In addition to geographical location, we also looked at a few other factors that may affect crime rates. We found that, in Chicago, there’s a positive correlation (roughly 30%) between neighborhood crime rates and the number of rented units of all occupied housing units within a neighborhood. In other words, the more rented units there are in a neighborhood, the more crimes were reported by residents. Many scholars and research institutions have emphasized the social benefits of stable housing, and that rings true based on what we’ve found in Chicago.
What You Need to Know to Stay Safe
In addition to geographical location and relationship between crimes and renting, we also broke down reported crimes by day of the week, month, and time of the day. Below is an infographic for easy-sharing, which summarizes our findings.
Methodology
To better understand crimes in Chicago, we pulled the crime data made public by the Chicago Police Department. For this study, violent crimes mainly include homicide, robbery, assault, battery, kidnapping, and criminal sexual assault. Property crimes mainly include arson, larceny/theft, burglary, and motor vehicle theft. We first removed duplicates based on time, date, type of crime, and location, and then geocoded each reported crime to corresponding neighborhoods using the coordinates provided by the open data portal. Other neighborhood information, including population count, number of households, renter-occupied units, etc., was retrieved from the community data snapshots.


