While climate change seems to be making winters shorter and warmer, humans still need shelter and heat during cold months. Winter storms have started picking up in frequency, and many New Yorkers prefer to stay warm at home rather than walking outside. But some are not so lucky, especially those who rent apartments in the city.
Although required by the NYC Heat Law, some landlords, perhaps due to limited resources or pure negligence, don’t turn up the heat, leaving the tenants to face the consequences. Our studies in the past few years have shown that certain parts of the city, such as Erasmus (Brooklyn), Bedford Park-Fordham South (the Bronx), and Hamilton Heights (Manhattan), are just not getting the heat they need, despite people’s continuous complaints to 311. As we brace ourselves for the cold with some hot cocoa, it is time to see which neighborhoods suffer the most this winter.
Here’s a summary of our findings this year:
- In total, 116,452 heat/hot water complaints were filed to 311 by residents in New York City between October 1, 2021, and January 19, 2022.
- After grouping complaints by day and address, we found 83,878 unique heat complaints, 25.6% higher compared to the same period last winter.
- All five NYC boroughs experienced increases in the number of unique heat violations. [Figure 1]
- Our analysis indicates that as rents decreases, the observed incidence of heating violation increases. [Figure 4]
- Some of the worst heat violation offenders include 2176 Tiebout Avenue (1,403 complaints / 84 unique) and 2040 Bronxdale Avenue (531 complaints / 81 unique) in the Bronx, and 93 Linden Boulevard in Brooklyn (168 complaints / 75 unique). [Data Table]
Heat Complaints, Broken Down by Borough
The Bronx
- The Bronx continues to be the coldest borough, receiving 27,505 unique heat complaints or 659.7 complaints/10k renter-occupied units. Of the top 20 worst neighborhoods with heat violations, 85% or 17 are located in the Bronx.
- Fordham South in the Bronx ranks the coldest neighborhood among over 180 NYC neighborhoods. It received 939 unique complaints or 1,158.3 complaints/10k renter-occupied units, 27.2% more than last year. [Figure 2]
Brooklyn
- In Brooklyn, the number of heat complaints went up 22.0%. The borough has received 24,203 unique heat complaints in 2022.
- Erasmus remains the coldest neighborhood in Brooklyn. In total 764 unique complaints were filed between October 1 and January 19, 2022.
- Meanwhile, heat complaints skyrocketed in Gravesend, Brooklyn. In total, 226 unique complaints have been filed this season, 153.9% more than last winter. [Figure 3]
Manhattan
- Renters in Manhattan have filed 18,946 unique heat/hot water complaints this winter season as of January 19, 30.7% more than the same period last year.
- Hamilton Heights remains the coldest neighborhood in Manhattan, with a total of 1,478 unique heat complaints filed as of January 19 this year.
Queens
- In Queens, unique heat complaints rose 27.2% from 9,522 to 12,114 this year.
- Renters in St. Albans have filed 228 unique complaints in 2022, 36.5% more than in 2021, and topped all other Queens neighborhoods.
Staten Island
- Renters on Staten Island have filed 1,091 unique heat complaints this winter, 22.3% more than the previous year.
- Oakwood-Oakwood Beach rose to become the coldest neighborhood on Staten Island. In total, 101 unique heat complaints were reported between October 1 and January 19, 2022, 83.6% more than the same period last year.
When Does the Heat Season Start?
If you are new to the city, you might not know what the “Heat Season” entails. In New York City, landlords are required to provide heat for all tenants from October 1st through May 31st. While it is indeed more than half of the year, the requirements are pretty low:
- Between 6:00 AM and 10:00 PM, if the outside temperature falls below 55 degrees, the inside temperature is required to be at least 68 degrees F
- Between 10:00 PM and 6:00 AM, if the inside temperature is required to be at least 62 degrees F, no outside temperature requirement
Unfortunately, for many renters in the city, their landlords just don’t seem to care. Some addresses have been reported hundreds of times since we entered the Heat Season, such as 2176 Tiebout Avenue and 2040 Bronxdale Avenue in the Bronx. These are repeat offenders from last year, and things don’t seem to be improving at all, according to the number of 311 complaints associated with these addresses.
Surely, when tenants are suffering, they make dozens of complaints each day to 311. We, therefore, grouped the heat/hot water complaints by address and created date. Complaints filed on the same day regarding the same building are considered one unique complaint. From Oct 1, 2021, the start of this Heat Season, to Jan 19, 2022, the city received 83,878 unique heat complaints, 25.6% higher than the total unique count of 66,784 in the same period last year.
Mapping the 311 Heat Complaints by NYC Neighborhood
To fairly rank the neighborhoods, we further normalize the data by dividing the number of heat complaints by the number of renter-occupied units in a neighborhood retrieved via the American Community Survey (people owning their home and are cold should settle that dispute with their significant other).
The map below illustrates how “cold” each NYC neighborhood is. The darker the shade, the more heat complaints per 10,000 renter-occupied units a neighborhood has seen this winter. You can click on the neighborhood to learn more.
As the map shows, tenants in the Bronx seem to suffer more than in other boroughs. In fact, when looking at the top 20 neighborhoods with the most unique complaints this year, we discovered that 17 of them, or 85%, are neighborhoods located in the Bronx. But Manhattan neighborhoods that are farther away from the city center seem to also experience the same kind of challenge.
Figure 1 below further summarizes the number of normalized heat complaints by each borough between October 1 and January 19 from 2017 to 2022. We can see that the Bronx has historically been the worst borough when it comes to heat complaints, 85.8% worse than the second-worst borough, Brooklyn, this year. It is worth noting, however, that all five boroughs saw an increase in the number of unique complaints this year. Renters in Manhattan have filed 30.7% more unique heat/hot water complaints this winter season as of January 19.
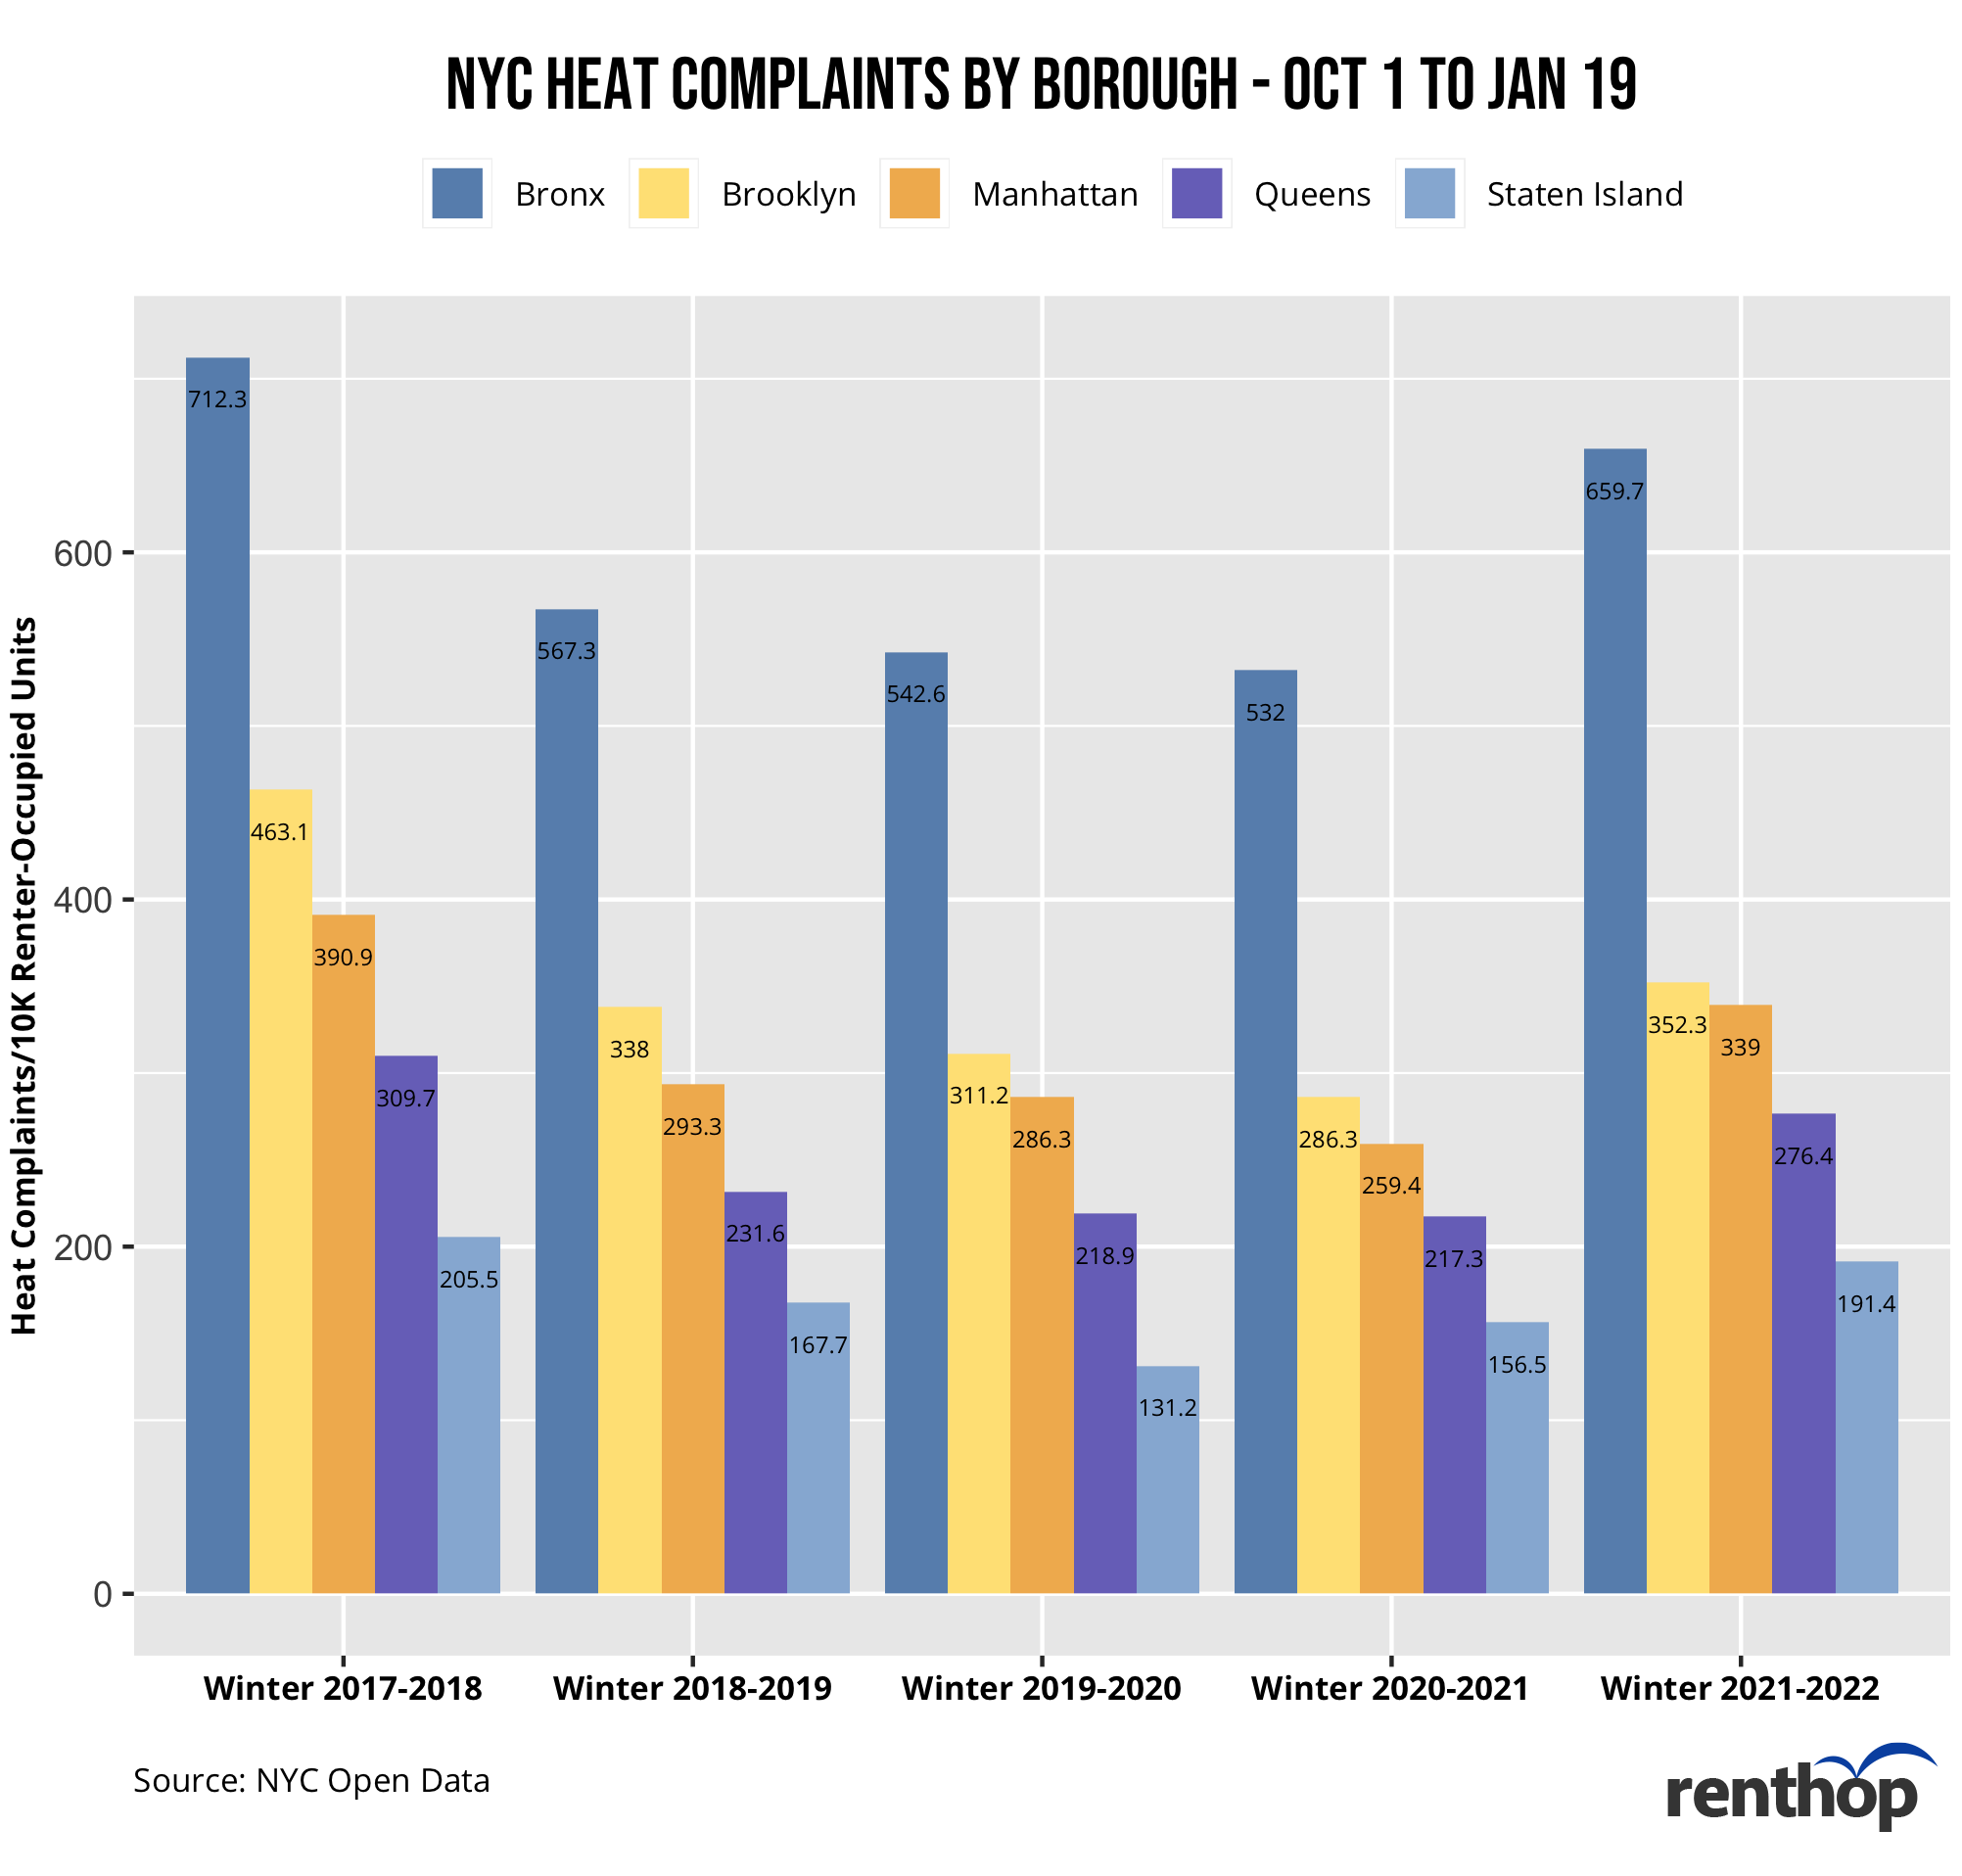
Figure 1
These are the Coldest Neighborhoods in NYC
Figure 2 below lists out the top 20 NYC neighborhoods that received the most heat complaints as of January 19. 17 of the neighborhoods are located in the Bronx.
This year, Fordham South overtook Kingsbridge Heights as the neighborhood with the most unique heat complaints. Buildings in the neighborhood received in total 939 unique complaints, which translates to 910.3 complaints per 10K renter-occupied units. This is 27.2% worse than last winter. Meanwhile, things got worse in Central Harlem South (YoY + 57.1%) and Hamilton Heights (+39.8%).
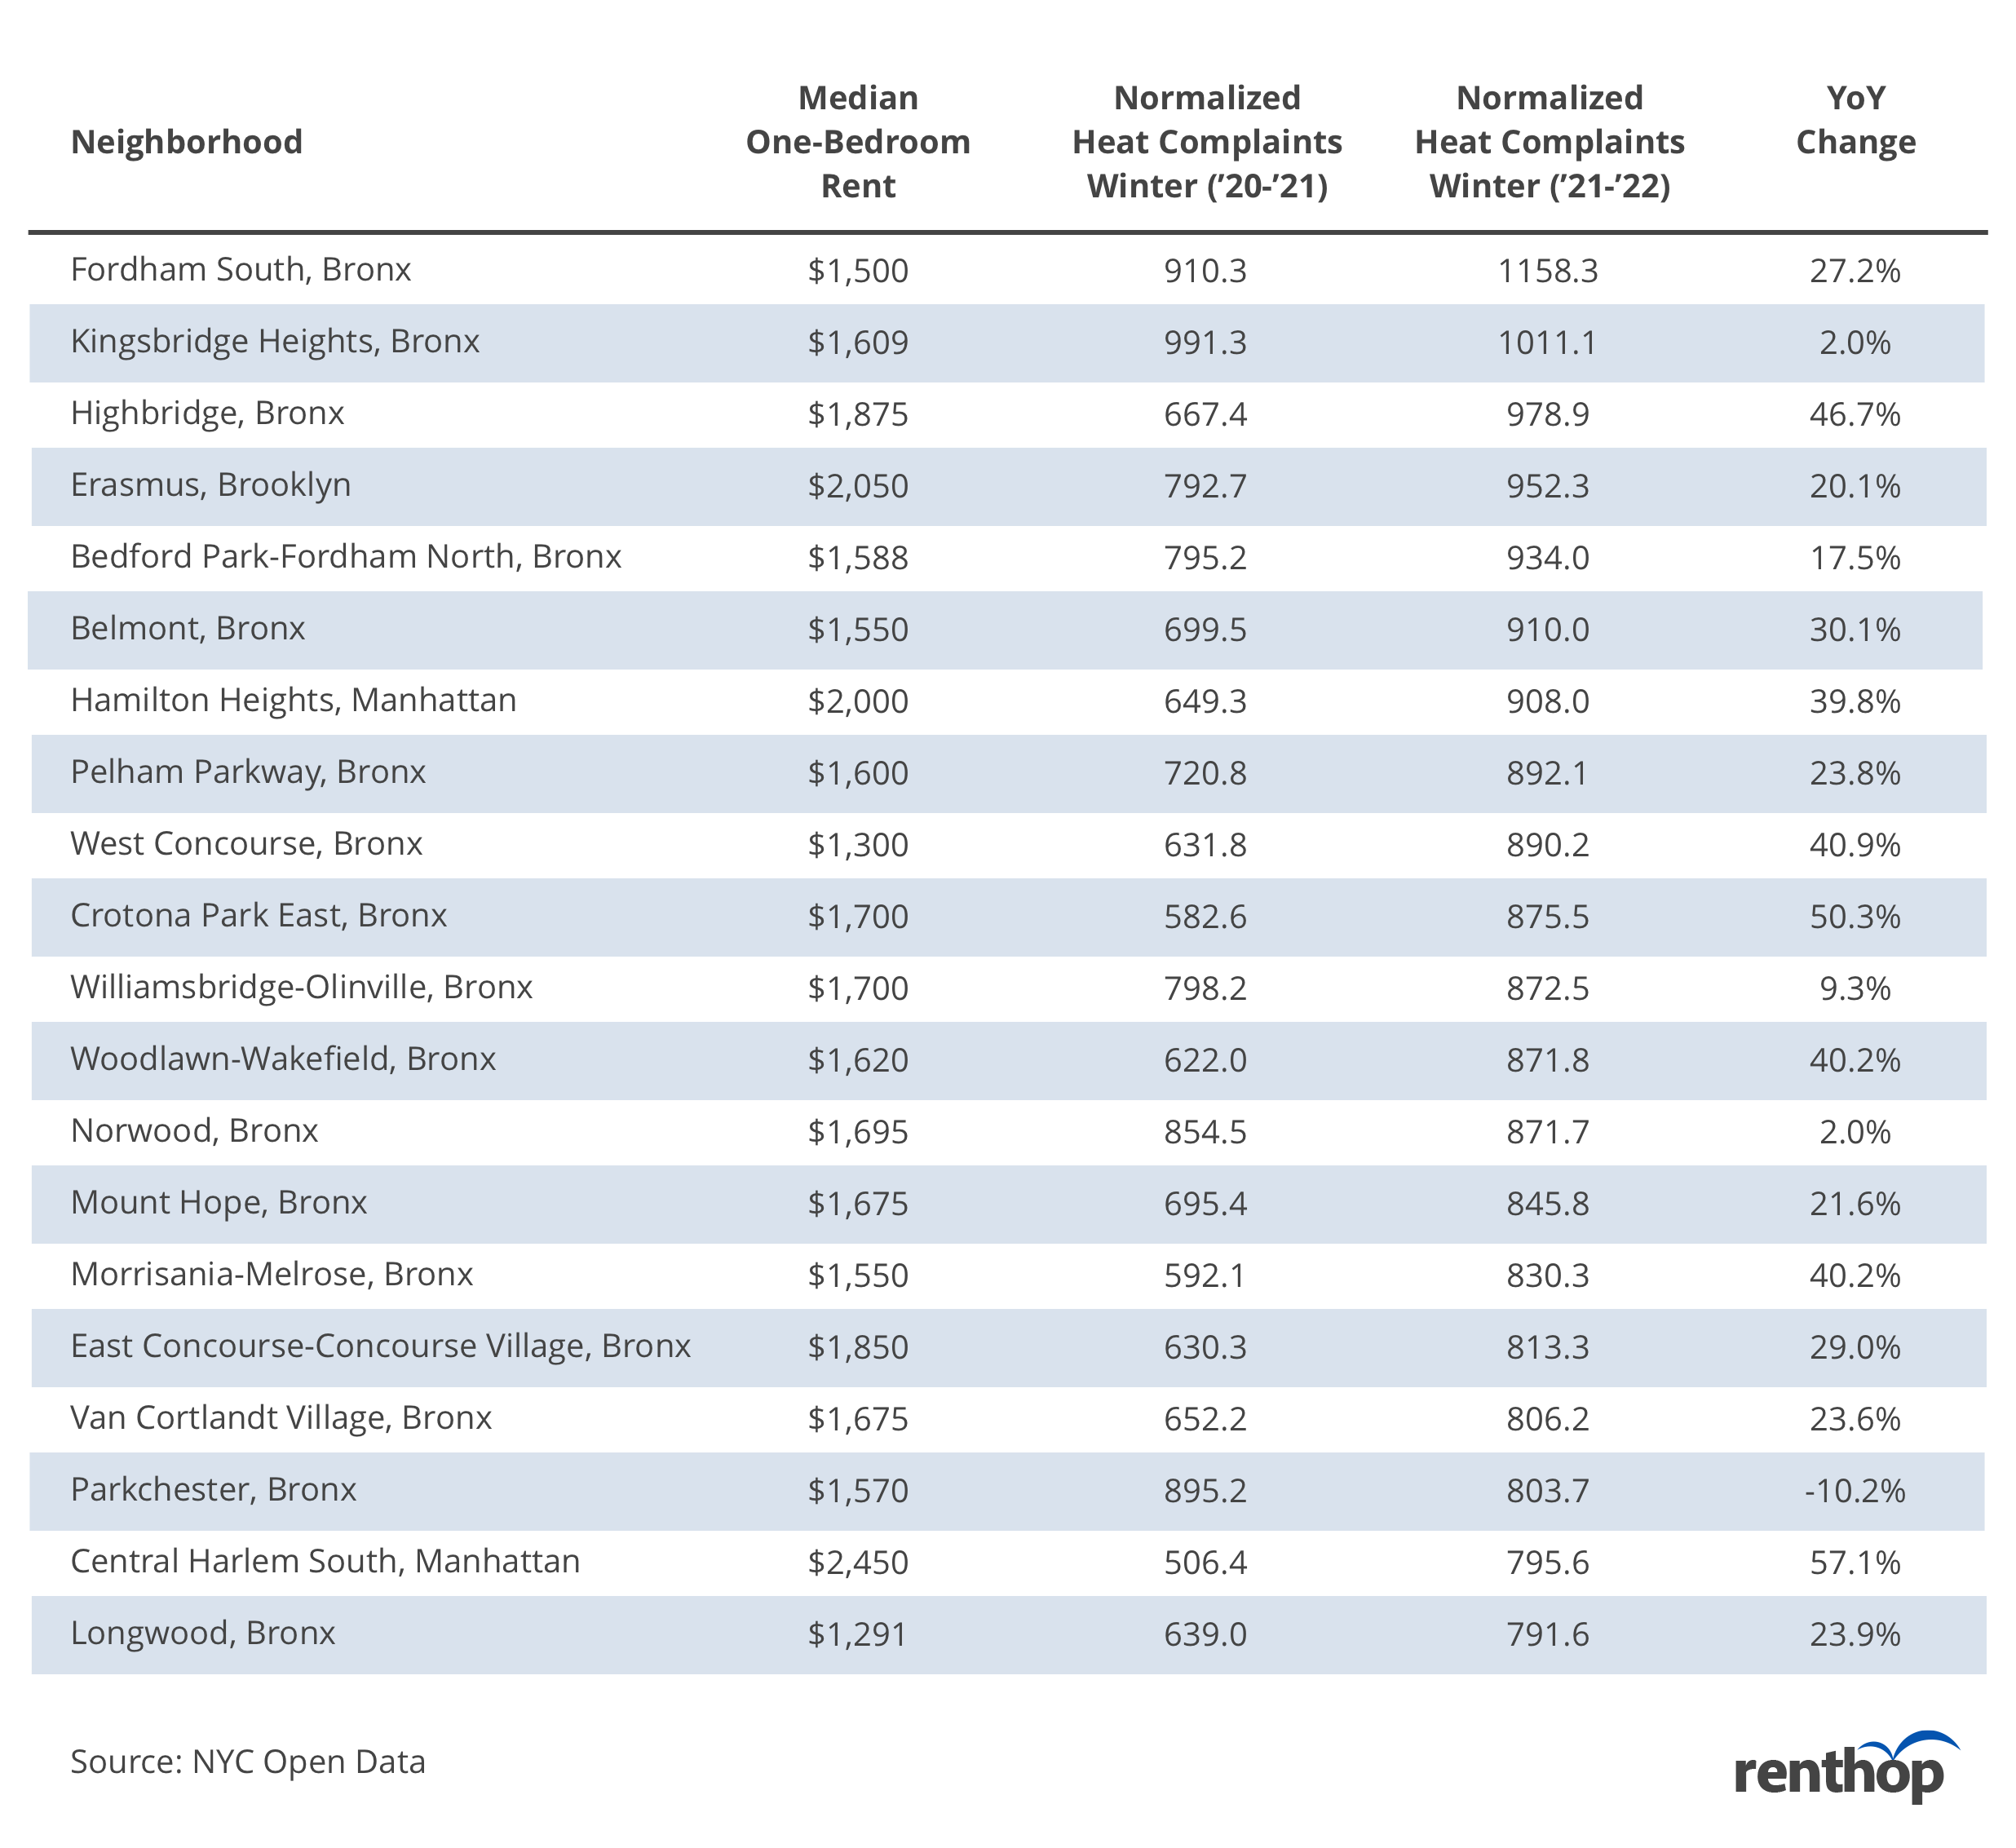
Figure 2
Winter Just Got Colder in these Neighborhoods
Figure 3 below further highlights neighborhoods experiencing the most drastic increase in heat complaints. In Gravesend, Brooklyn, heat complaints to 311 shot up 153.9% this year. Similarly, in Bayside-Bayside Hills in Queens, unique heat complaints reached 152 this year, or 292.1 complaints/10k renter-occupied units, as of January 19. This number is 120.3% higher than the previous winter.
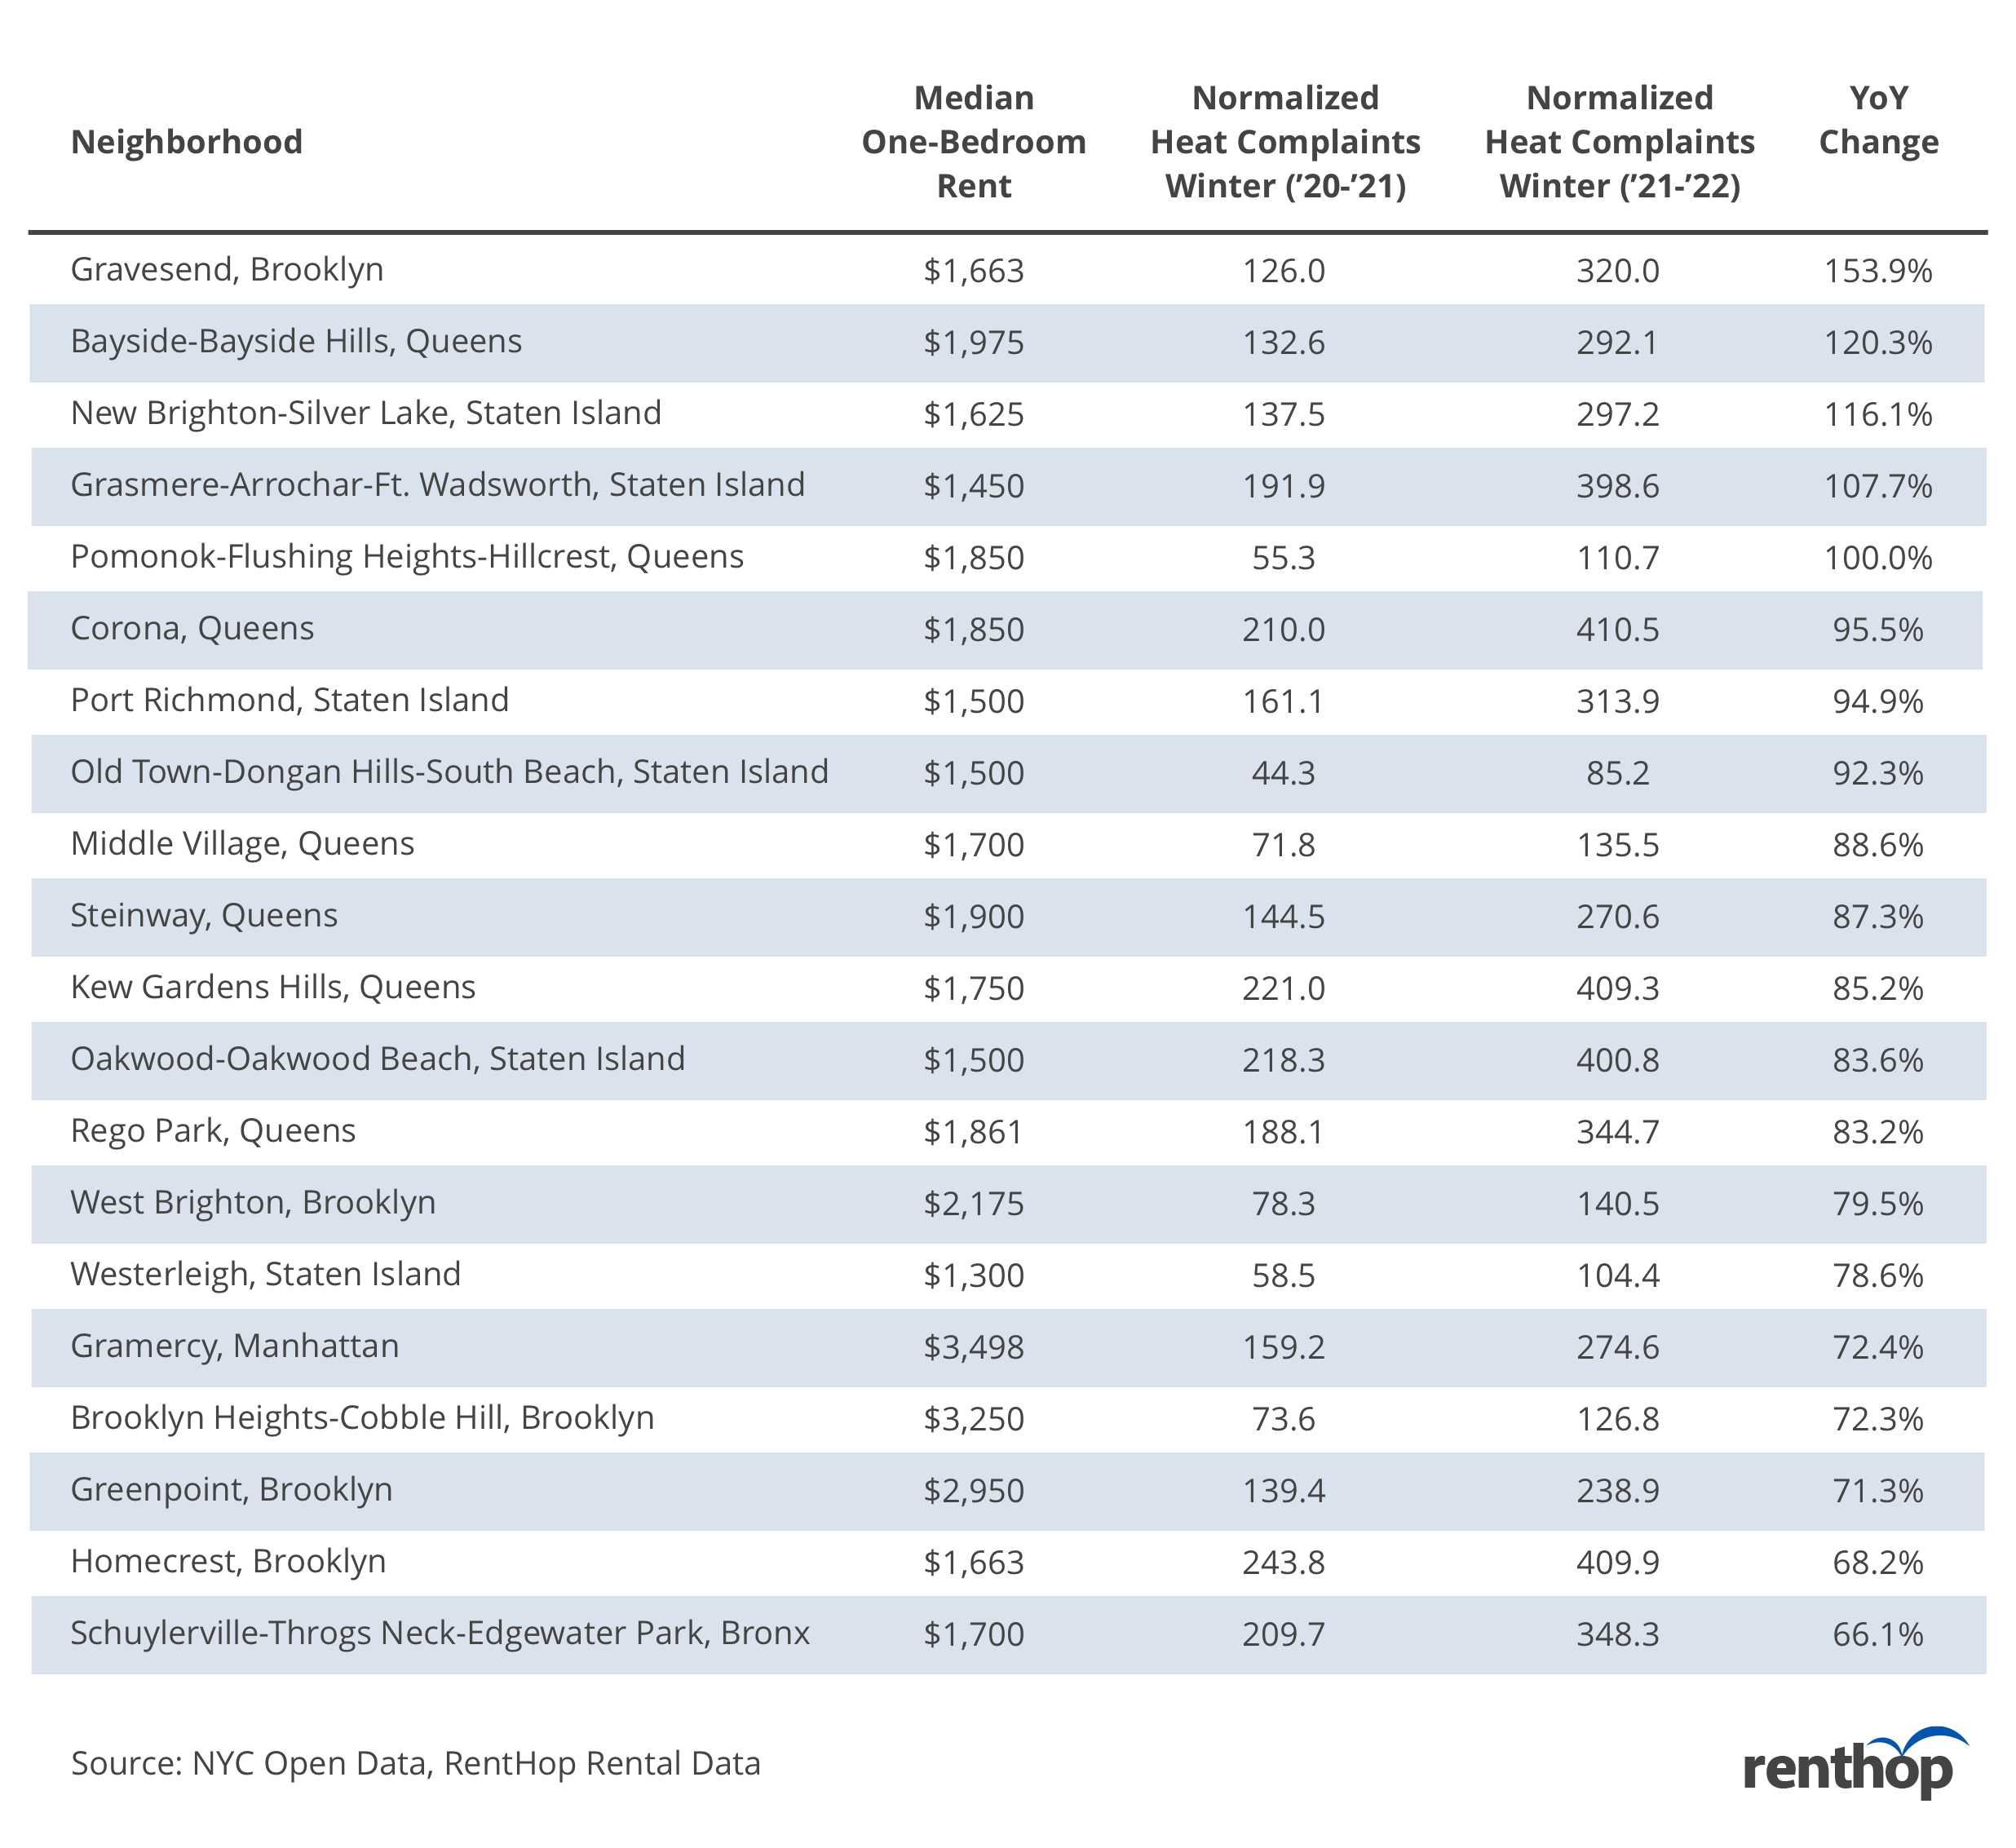
Figure 3
Tenants in Lower Rent Neighborhoods Continue to Suffer
While overall the number of heat complaints filed is showing an upward trend, some neighborhoods suffer worse than others. Our data indicate that generally, landlords operating units with lower rents tend to be more negligent when it comes to turning on the heat.
In order to assess the correlation between median one-bedroom rent and incidence of a heat/hot water complaint, we plotted the two against one another and calculated the correlation coefficient. We found that there is a negative correlation (-0.474) between median one-bedroom rent and the number of heat complaints/10k renter-occupied units. In other words, as rents increase, the observed incidence of heating violation decreases. To a certain degree, this is not surprising, as landlords charging higher rents tend to have more resources and staffers on their management team.
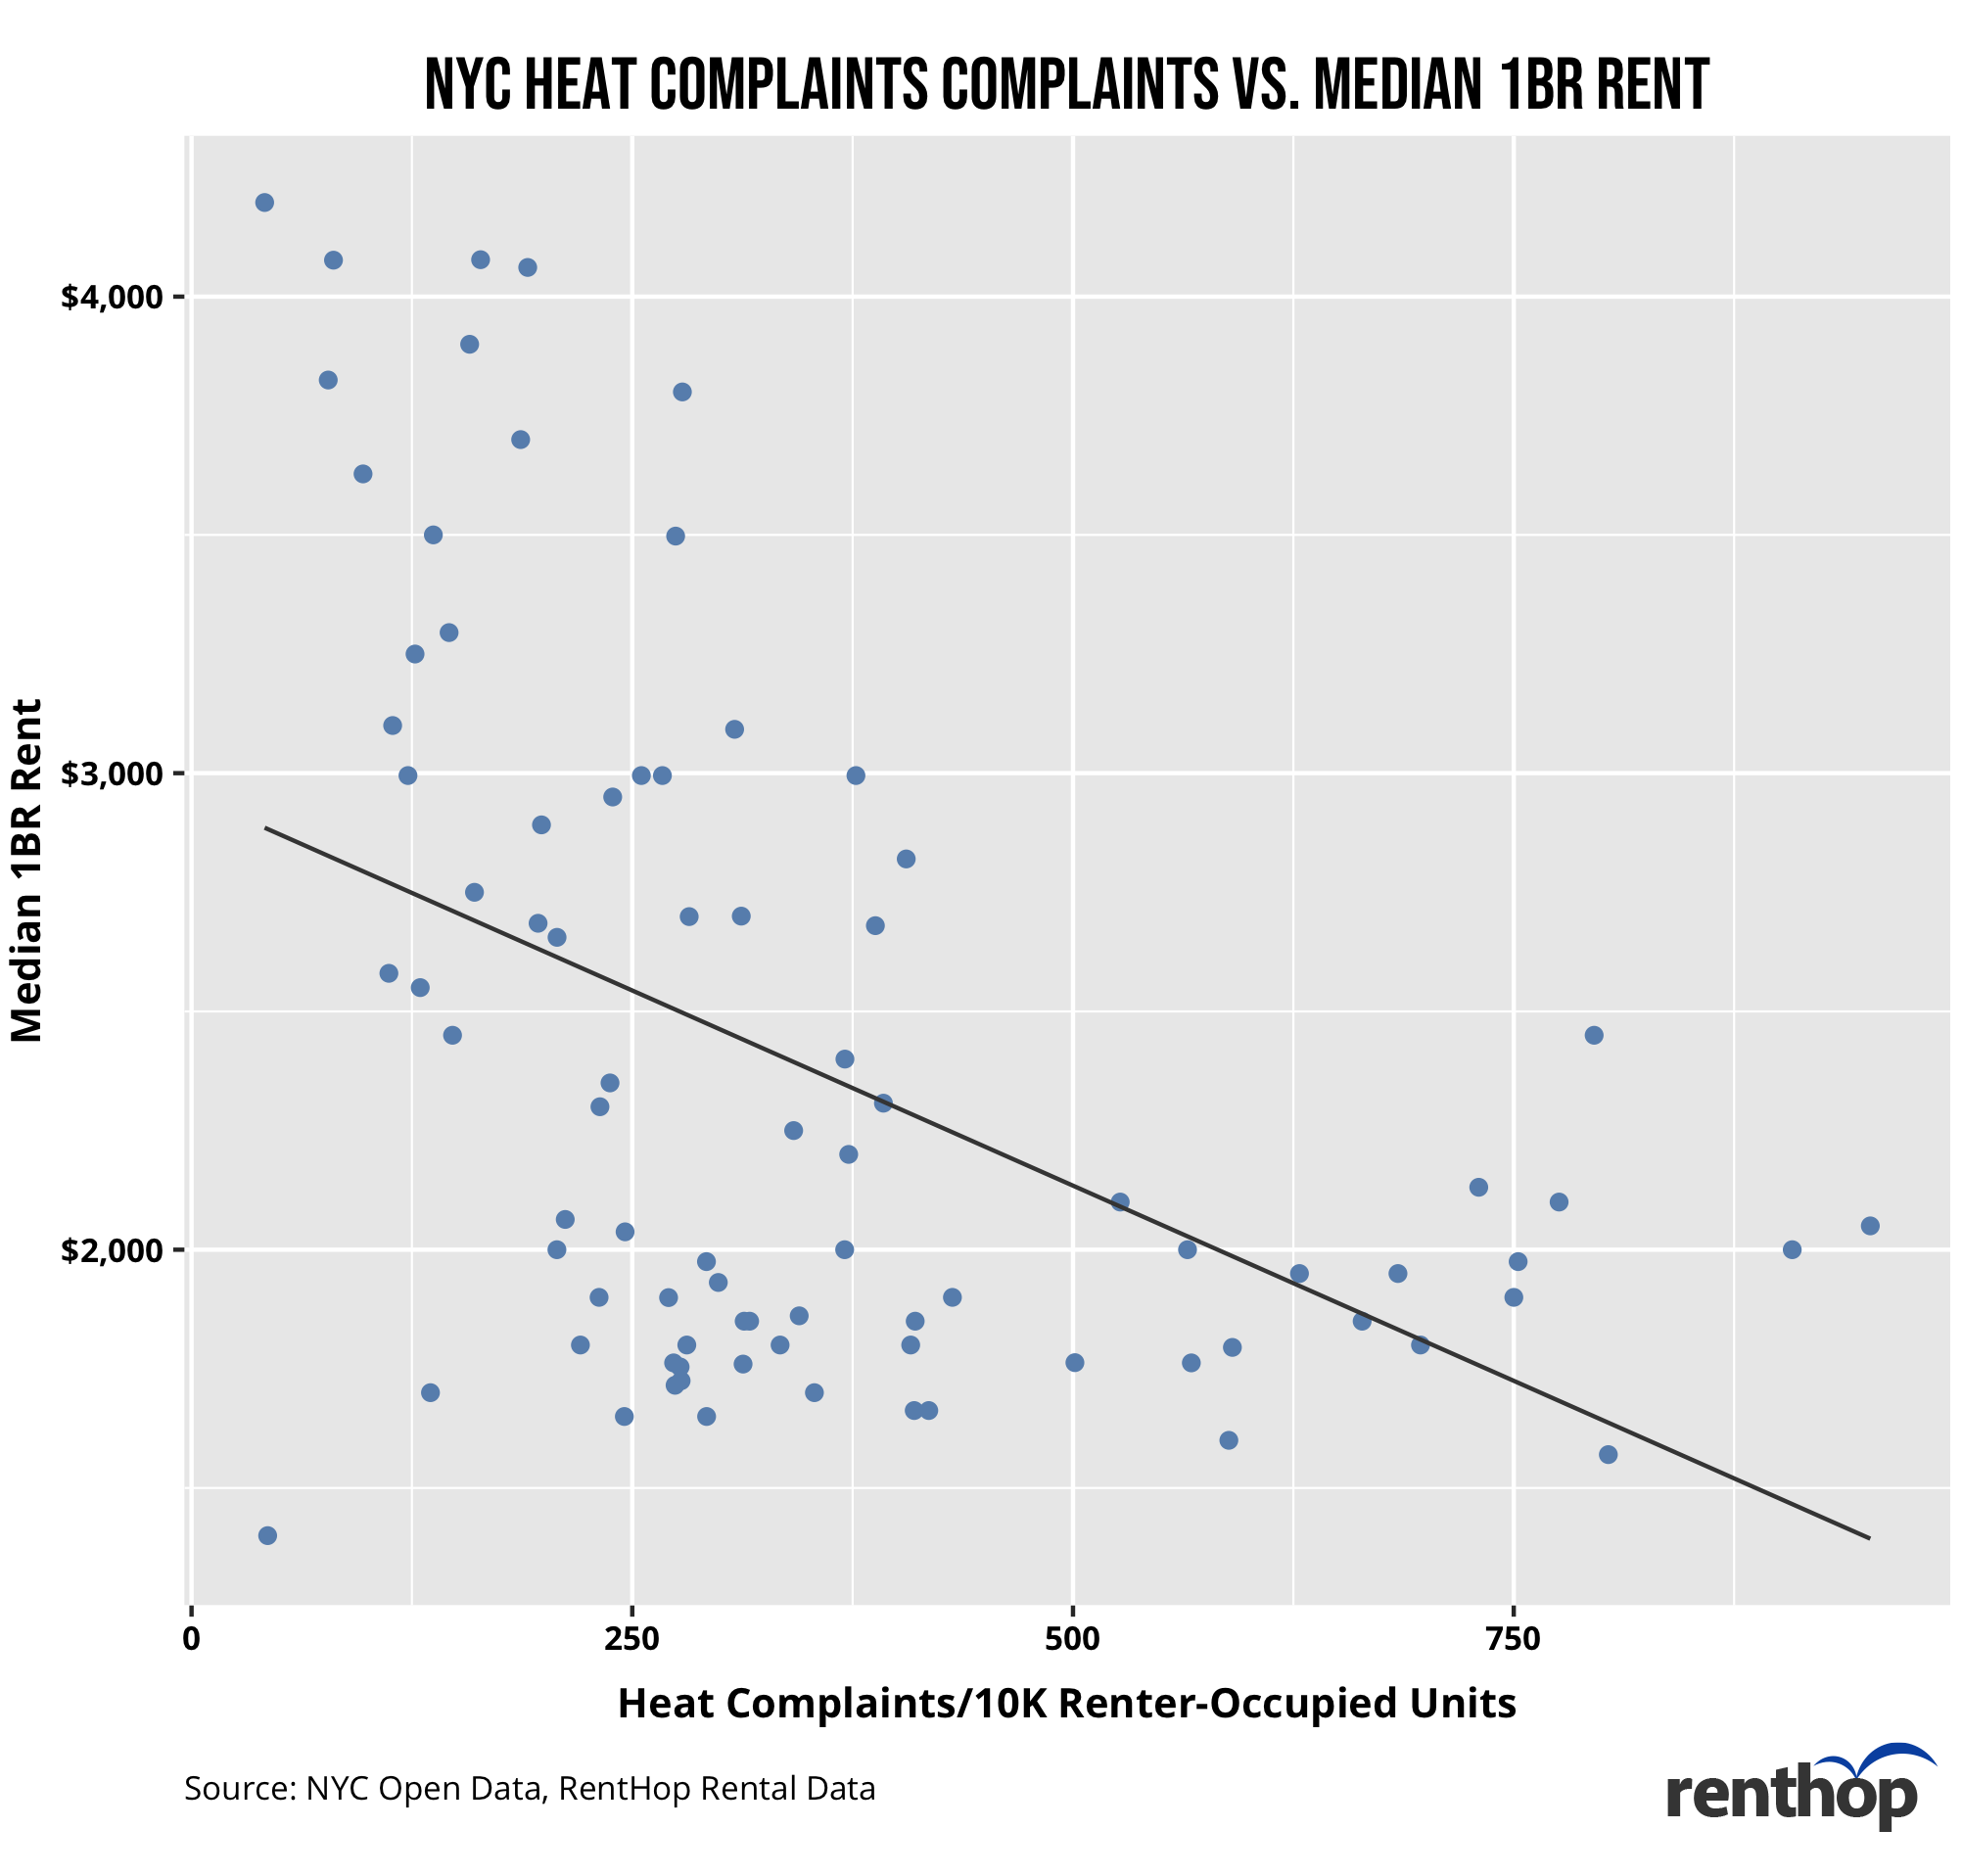
Figure 4
Beware if You Are Looking to Rent in One of these Buildings
In addition to breaking down the heat complaints by their respective neighborhoods, we thought we’d also take a look at how many times each address has been reported this winter. Don’t want to spend any cold days calling 311 and freezing at home? Be sure to check out these repeat offenders before signing your lease! You can further explore the data by sorting the data by column or doing a quick search using the search bar.


