We have all been there, enjoying a beautiful spring day, maybe walking to meet some friends for dinner. Suddenly – SQUISH – uh-oh. In a split second, there is a rush of feelings: anger, sadness, embarrassment or maybe even nausea. You could not help but wonder “who on earth doesn’t clean up after their furry little friends?” While we at RentHop cannot tell you who they are, using Chicago’s data on Sanitation Code Complaints and some data science, we can tell you when and where they are.
Some of our findings this year include:
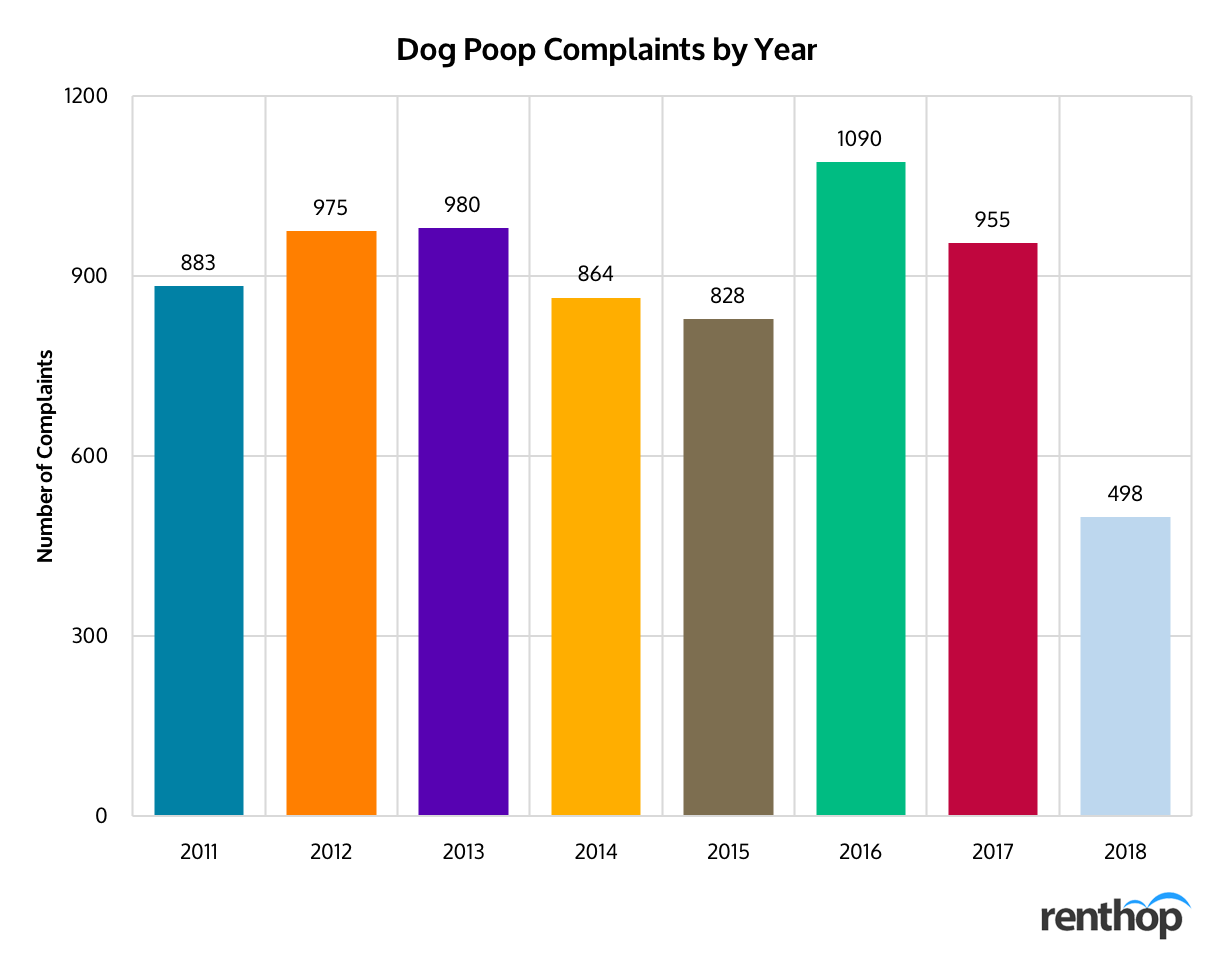
- 2017 was not so bad for Chicagoans, with 955 unique 311 dog poop complaints filed (145 complaints less than 2016).
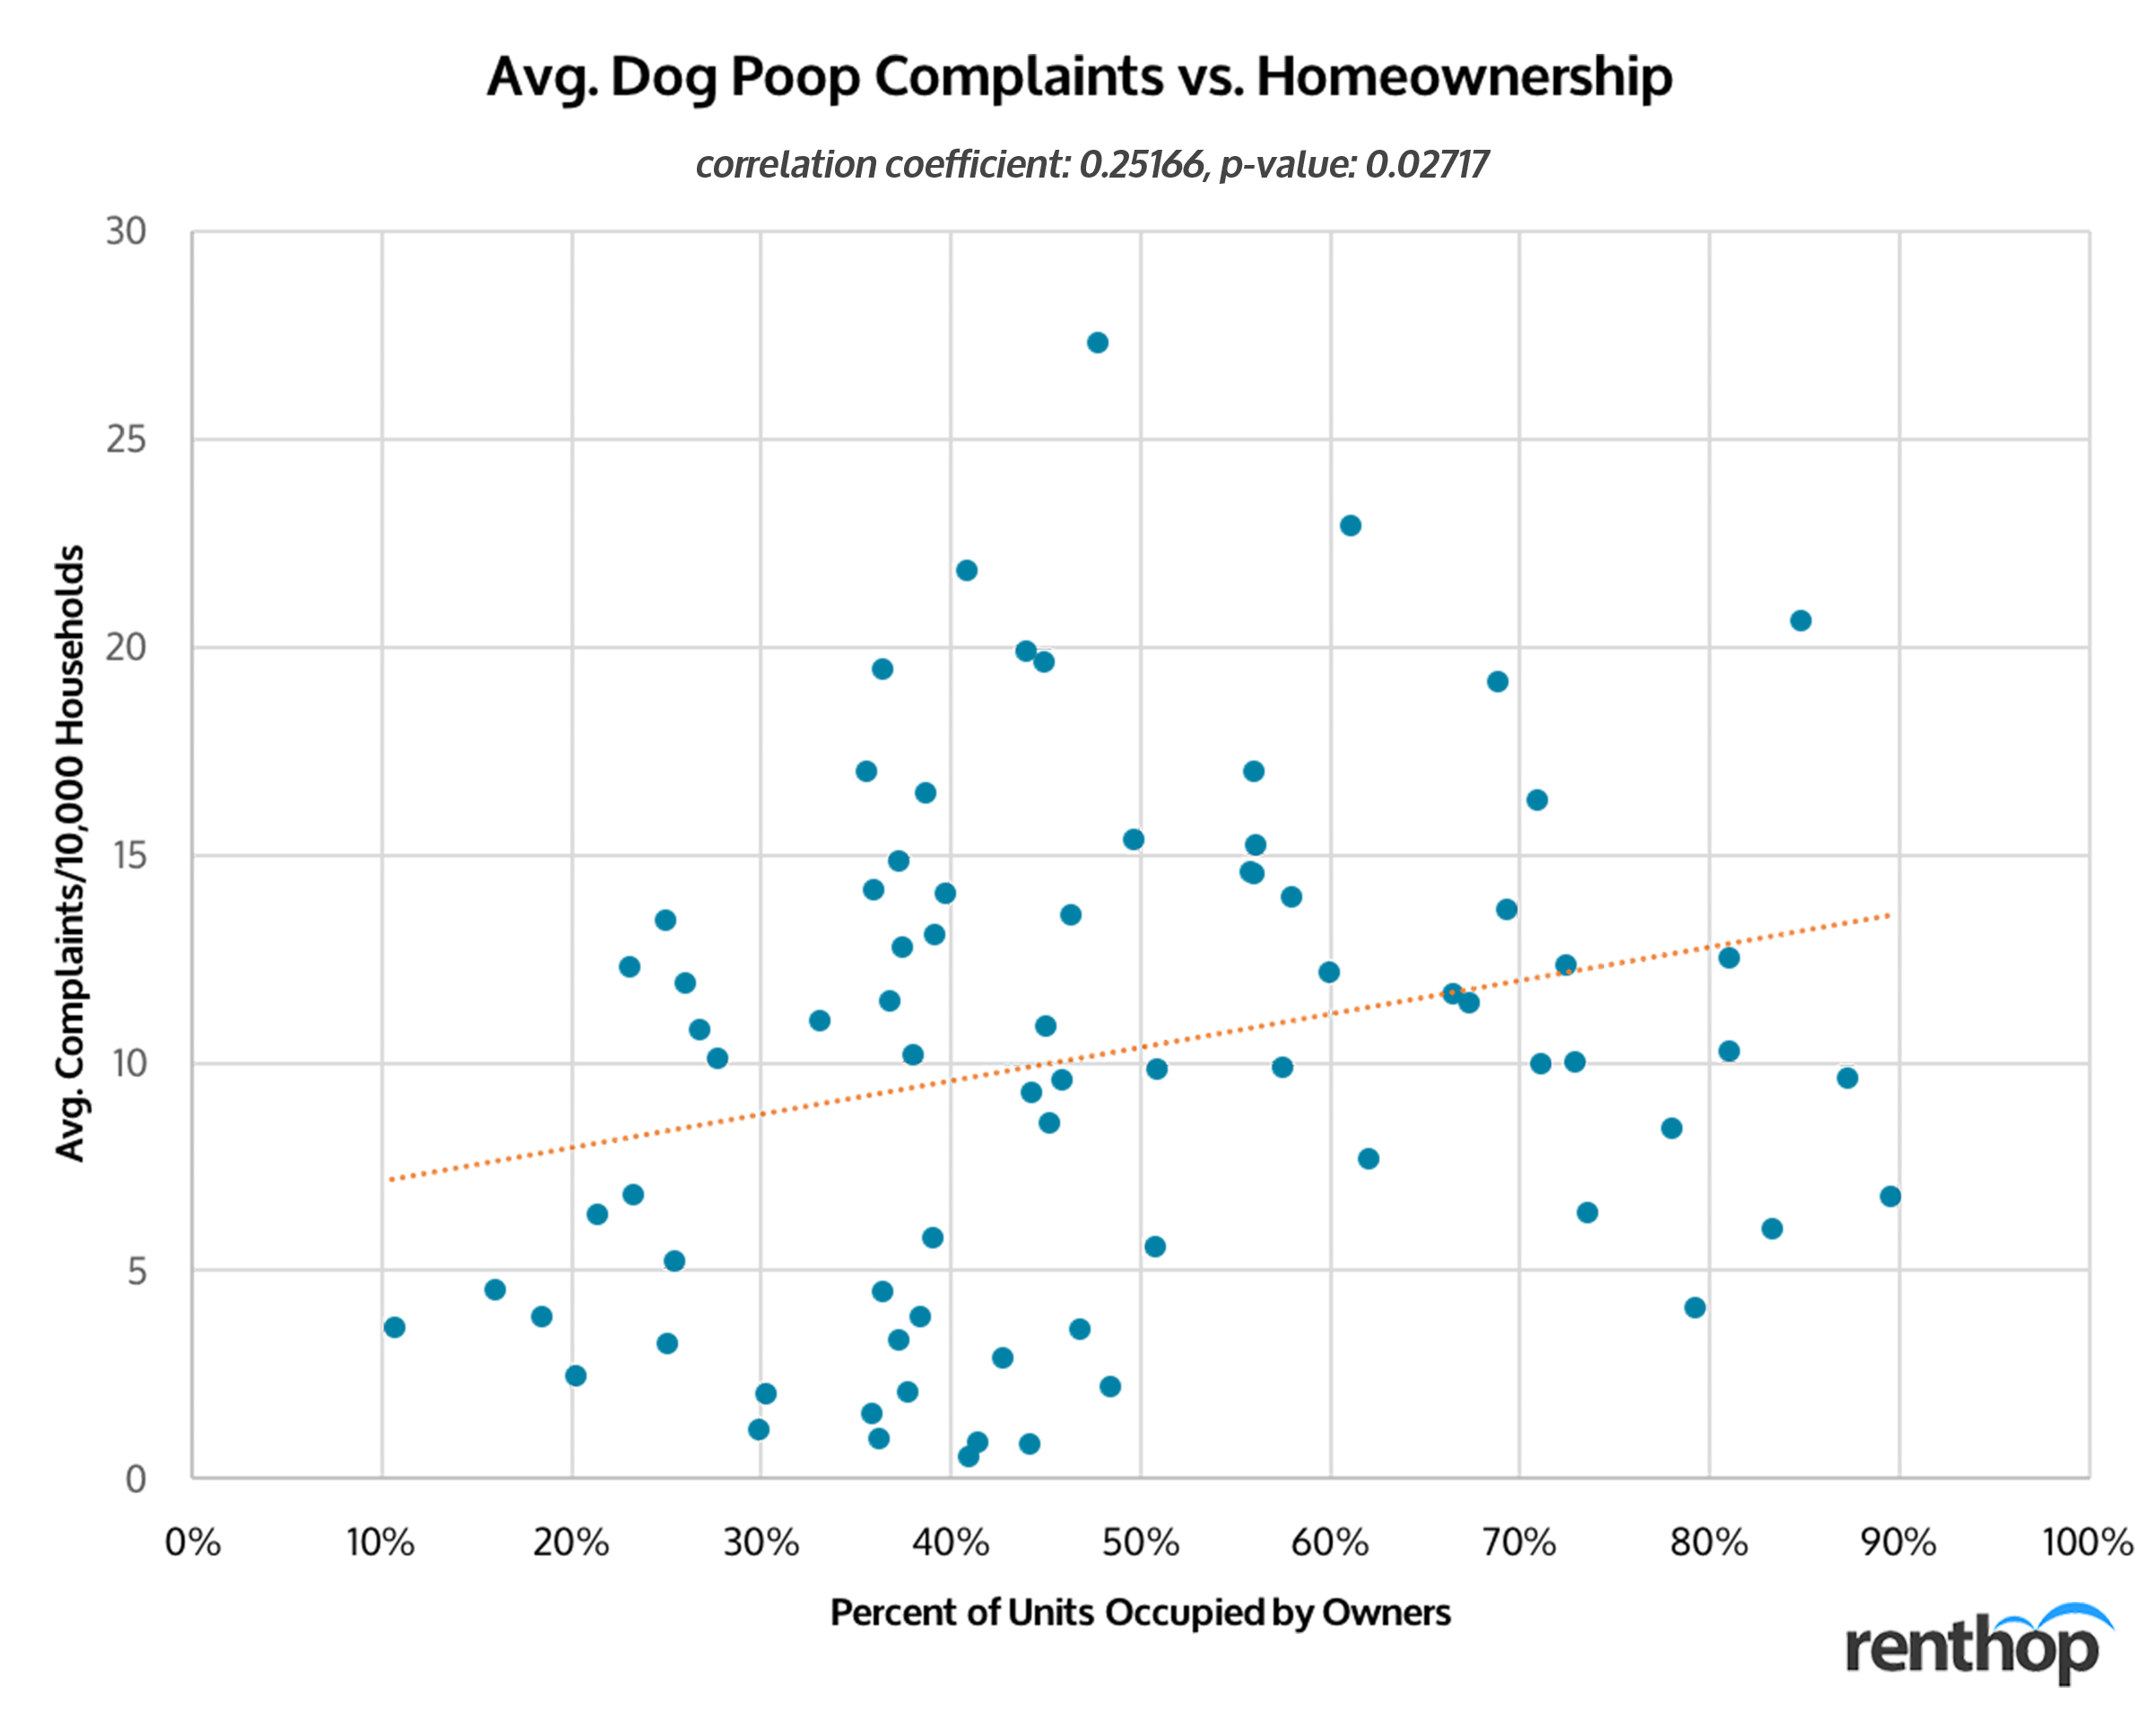
- There is a strong correlation between the number of dog poop complaints and homeownership. Areas with more owner-occupied units saw more dog poop complaints in 2017. See Figure 2.
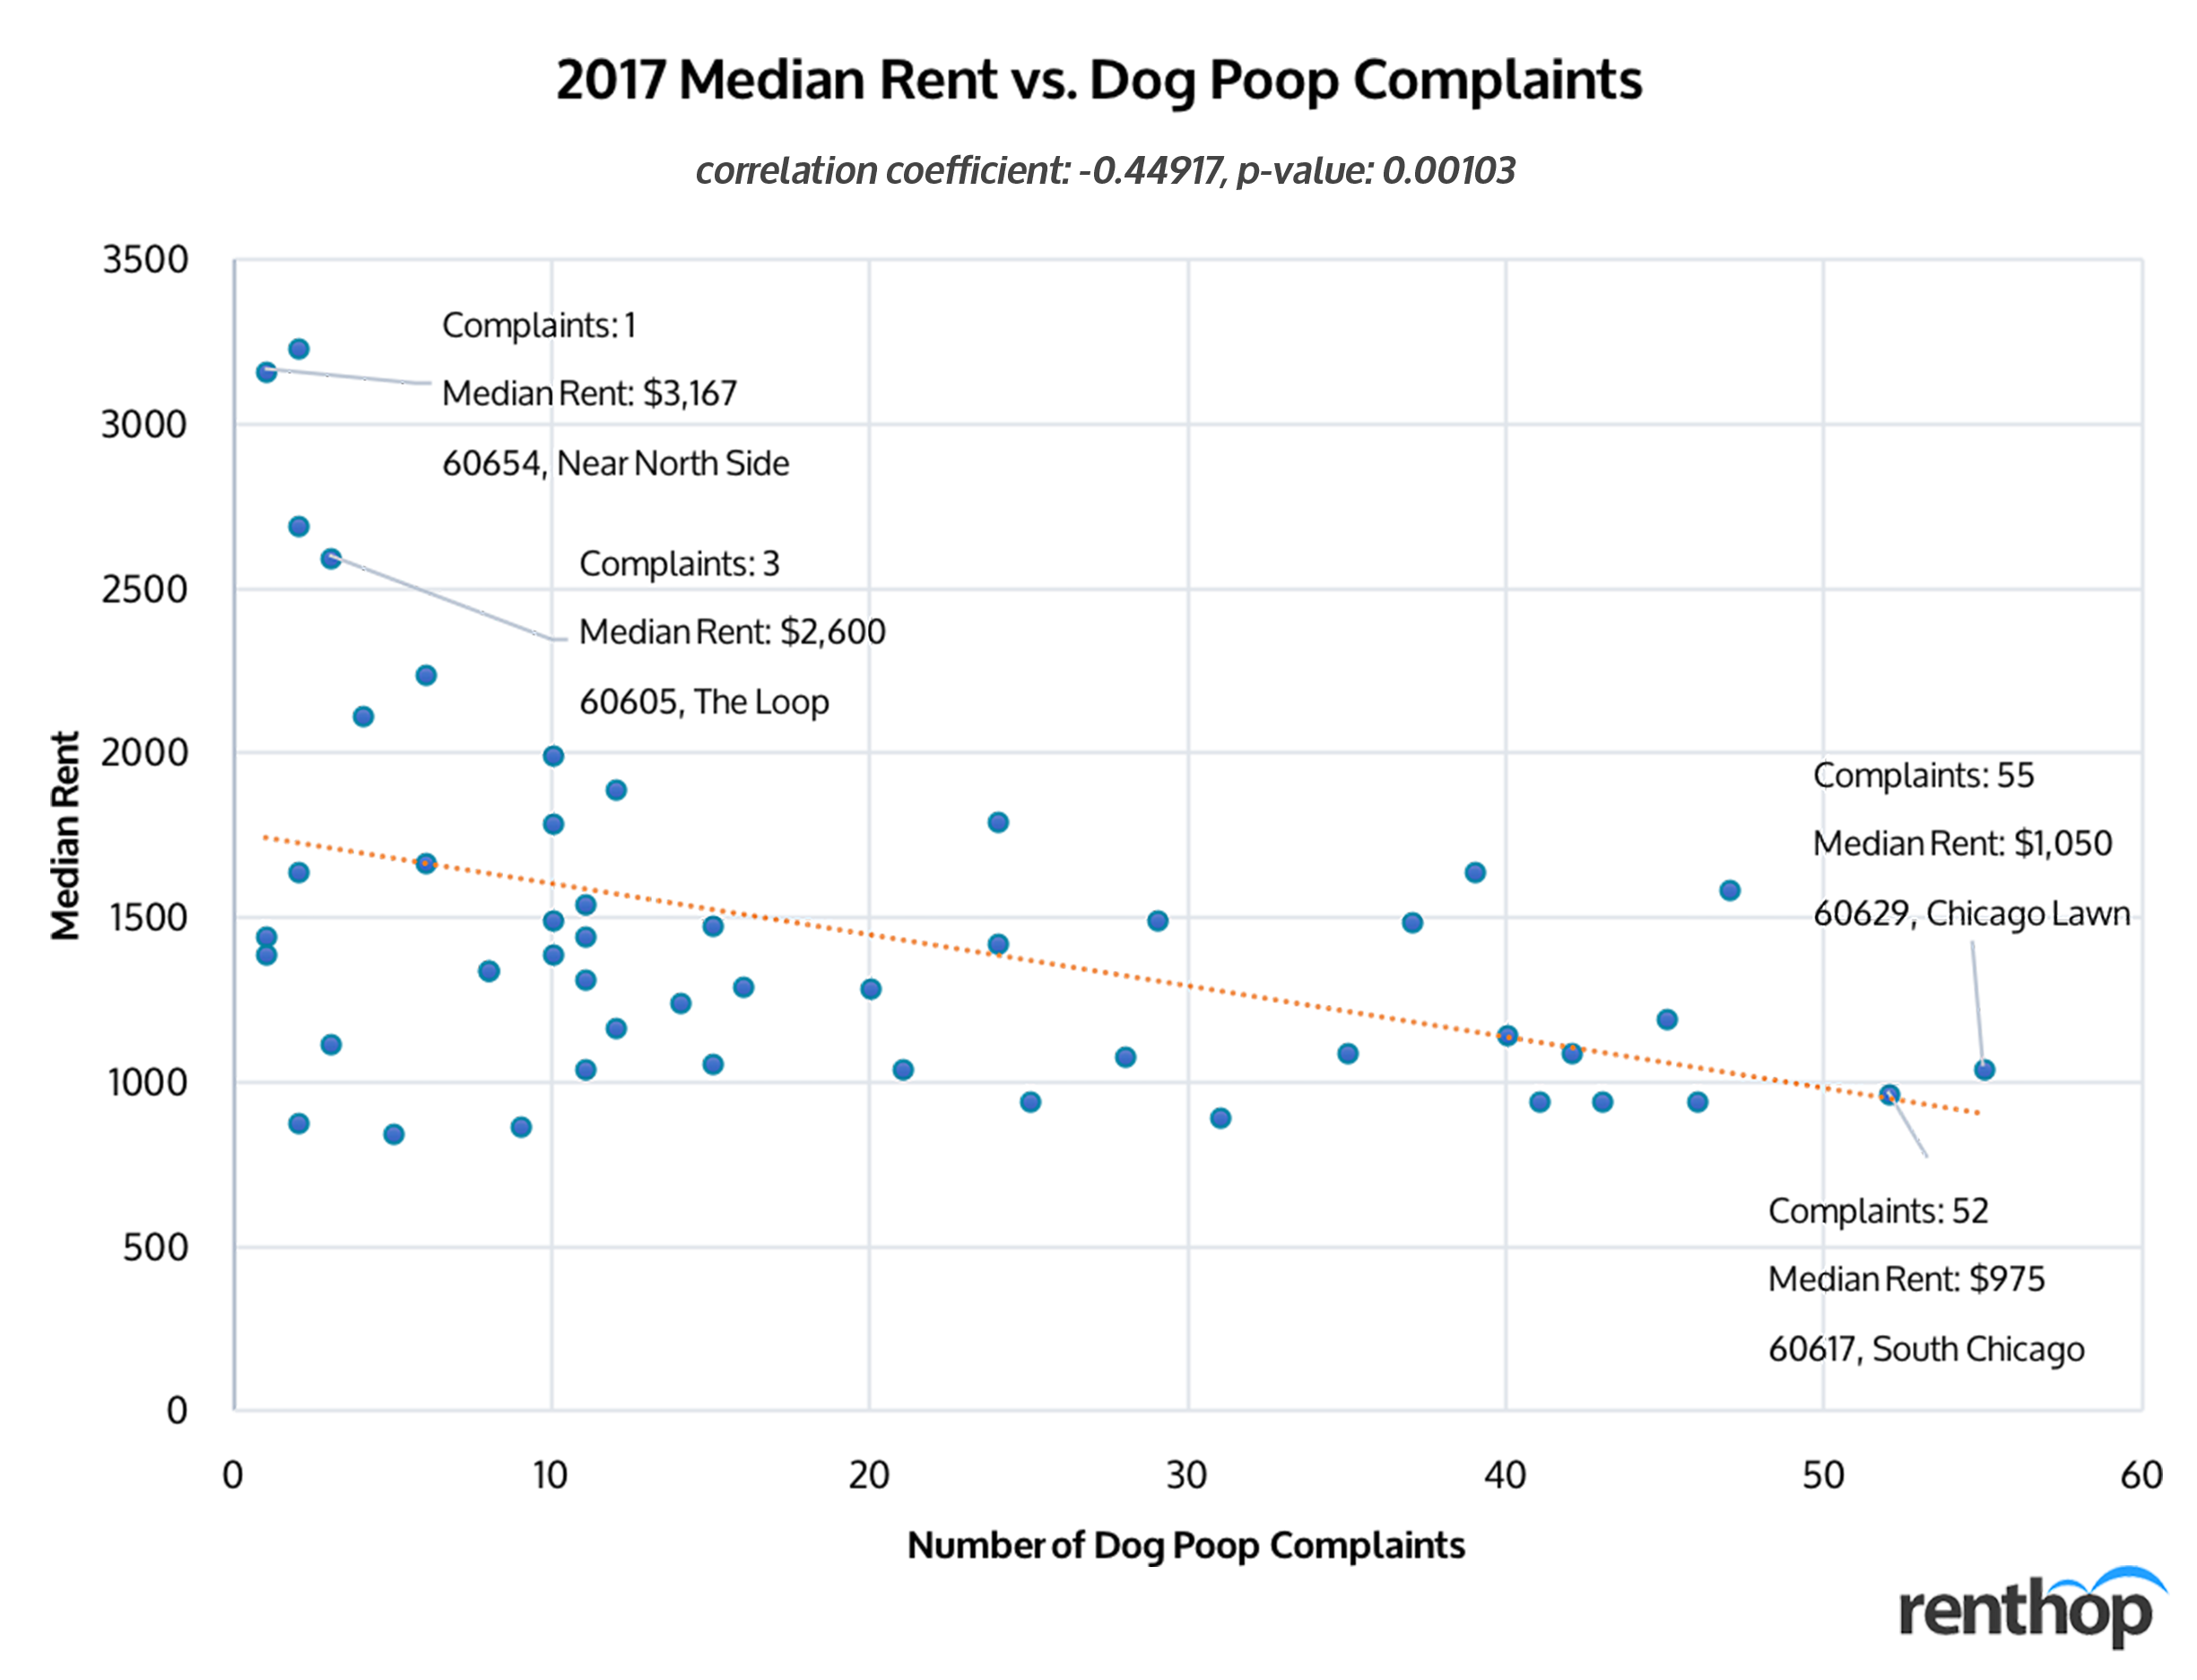
- We also noticed a negative correlation between rent and dog poop complaints when analyzing the data at a zip code level. The higher the two-bedroom median rent is, the fewer the dog poop complaints. See Figure 3.
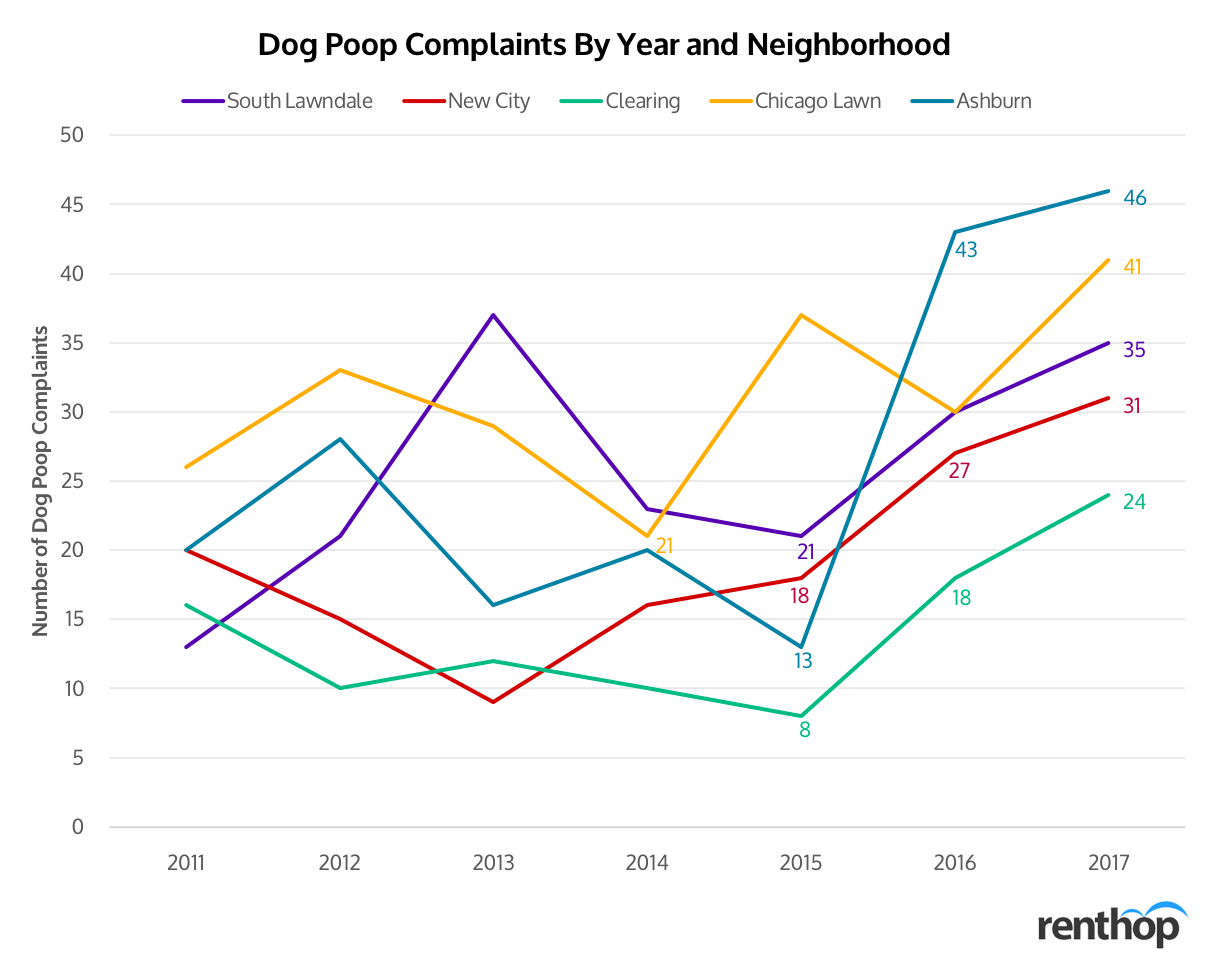
- The number of dog poop complaints tripled in Ashburn from 2015 to 2017, making it one of the worst dog-poop offenders in Chicago. See Figure 4.
- Things, however, seem to be getting better this year. As of July 9, 2018, the city has received only 498 complaints (compared to 564 in 2017 and 640 in 2016). See Figure 6.
Why Do Chicagoans Complain about Dog Poop?
Well, it would be weird if they did not. It is fair to say that no one in this world is happy to see dog feces on the street, not to mention stepping on it, and so clearly when we spot dog poop, we want to get rid of it. Less obviously, dog waste is, in fact, a primary source of food for rodents. The more dog waste there is, the more rats you might spot in your neighborhood. (On a side note, Chicago is the most rat-infested city in the U.S., worse than New York and Los Angeles, even though the population of New York is around three times of Chicago’s.) One could make a case that rats are even more disgusting than dog poop since they carry diseases and reproduce. Regardless, both have negative impacts on our overall wellbeing.
Where to Watch Out
While one might think there is no science in dog poop complaints, we at RentHop were able to find some fascinating trends. The first thing we noticed was the correlation between neighborhoods and the number of complaints. Neighborhoods further from the city center had a significantly higher number of complaints, as shown on the map below.
Areas with darker shades have higher concentrations of poop complaints. To rank fairly, we normalized complaints by the number of households in a neighborhood, according to the most recent Census data available. This allows us to objectively compare one neighborhood to another because one would assume that an area with more households will also have more complaints, and this will correct that. We also removed duplicate complaints to ensure repeated same-day callers about the same poop does not tilt the data.
These areas were the worst dog poop offenders
- West Englewood – 27.42 Average Yearly Complaints/Per 10,000 Households – 24 Complaints in 2017
- West Pullman – 23.03 Average Yearly Complaints/Per 10,000 Households – 19 Complaints in 2017
- Hermosa – 21.93 Average Yearly Complaints/Per 10,000 Households – 20 Complaints in 2017
- Ashburn – 20.72 Average Yearly Complaints/Per 10,000 Households – 46 Complaints in 2017
- Ashburn Gresham – 19.99 Average Yearly Complaints/Per 10,000 Households – 28 Complaints in 2017
West Englewood, West Pullman, and Hermosa stayed as the top 3 worst offenders in 2016. Ashburn, however, rose to the fourth in our study this year, with 46 unique complaints filed in 2017.
These areas won the cleaniness awards
- Near North Side – 0.61 Average Yearly Complaints/Per 10,000 Households – 3 Complaints in 2017
- O’Hare – 0.90 Average Yearly Complaints/Per 10,000 Households – 1 Complaints in 2017
- The Loop – 0.95 Average Yearly Complaints/Per 10,000 Households – 2 Complaints in 2017
- Hyde Park – 1.03 Average Yearly Complaints/Per 10,000 Households – 0 Complaints in 2017
- Kenwood – 1.28 Average Yearly Complaints/Per 10,000 Households – 2 Complaints in 2017
Homeownership vs. Number of Poop Complaints
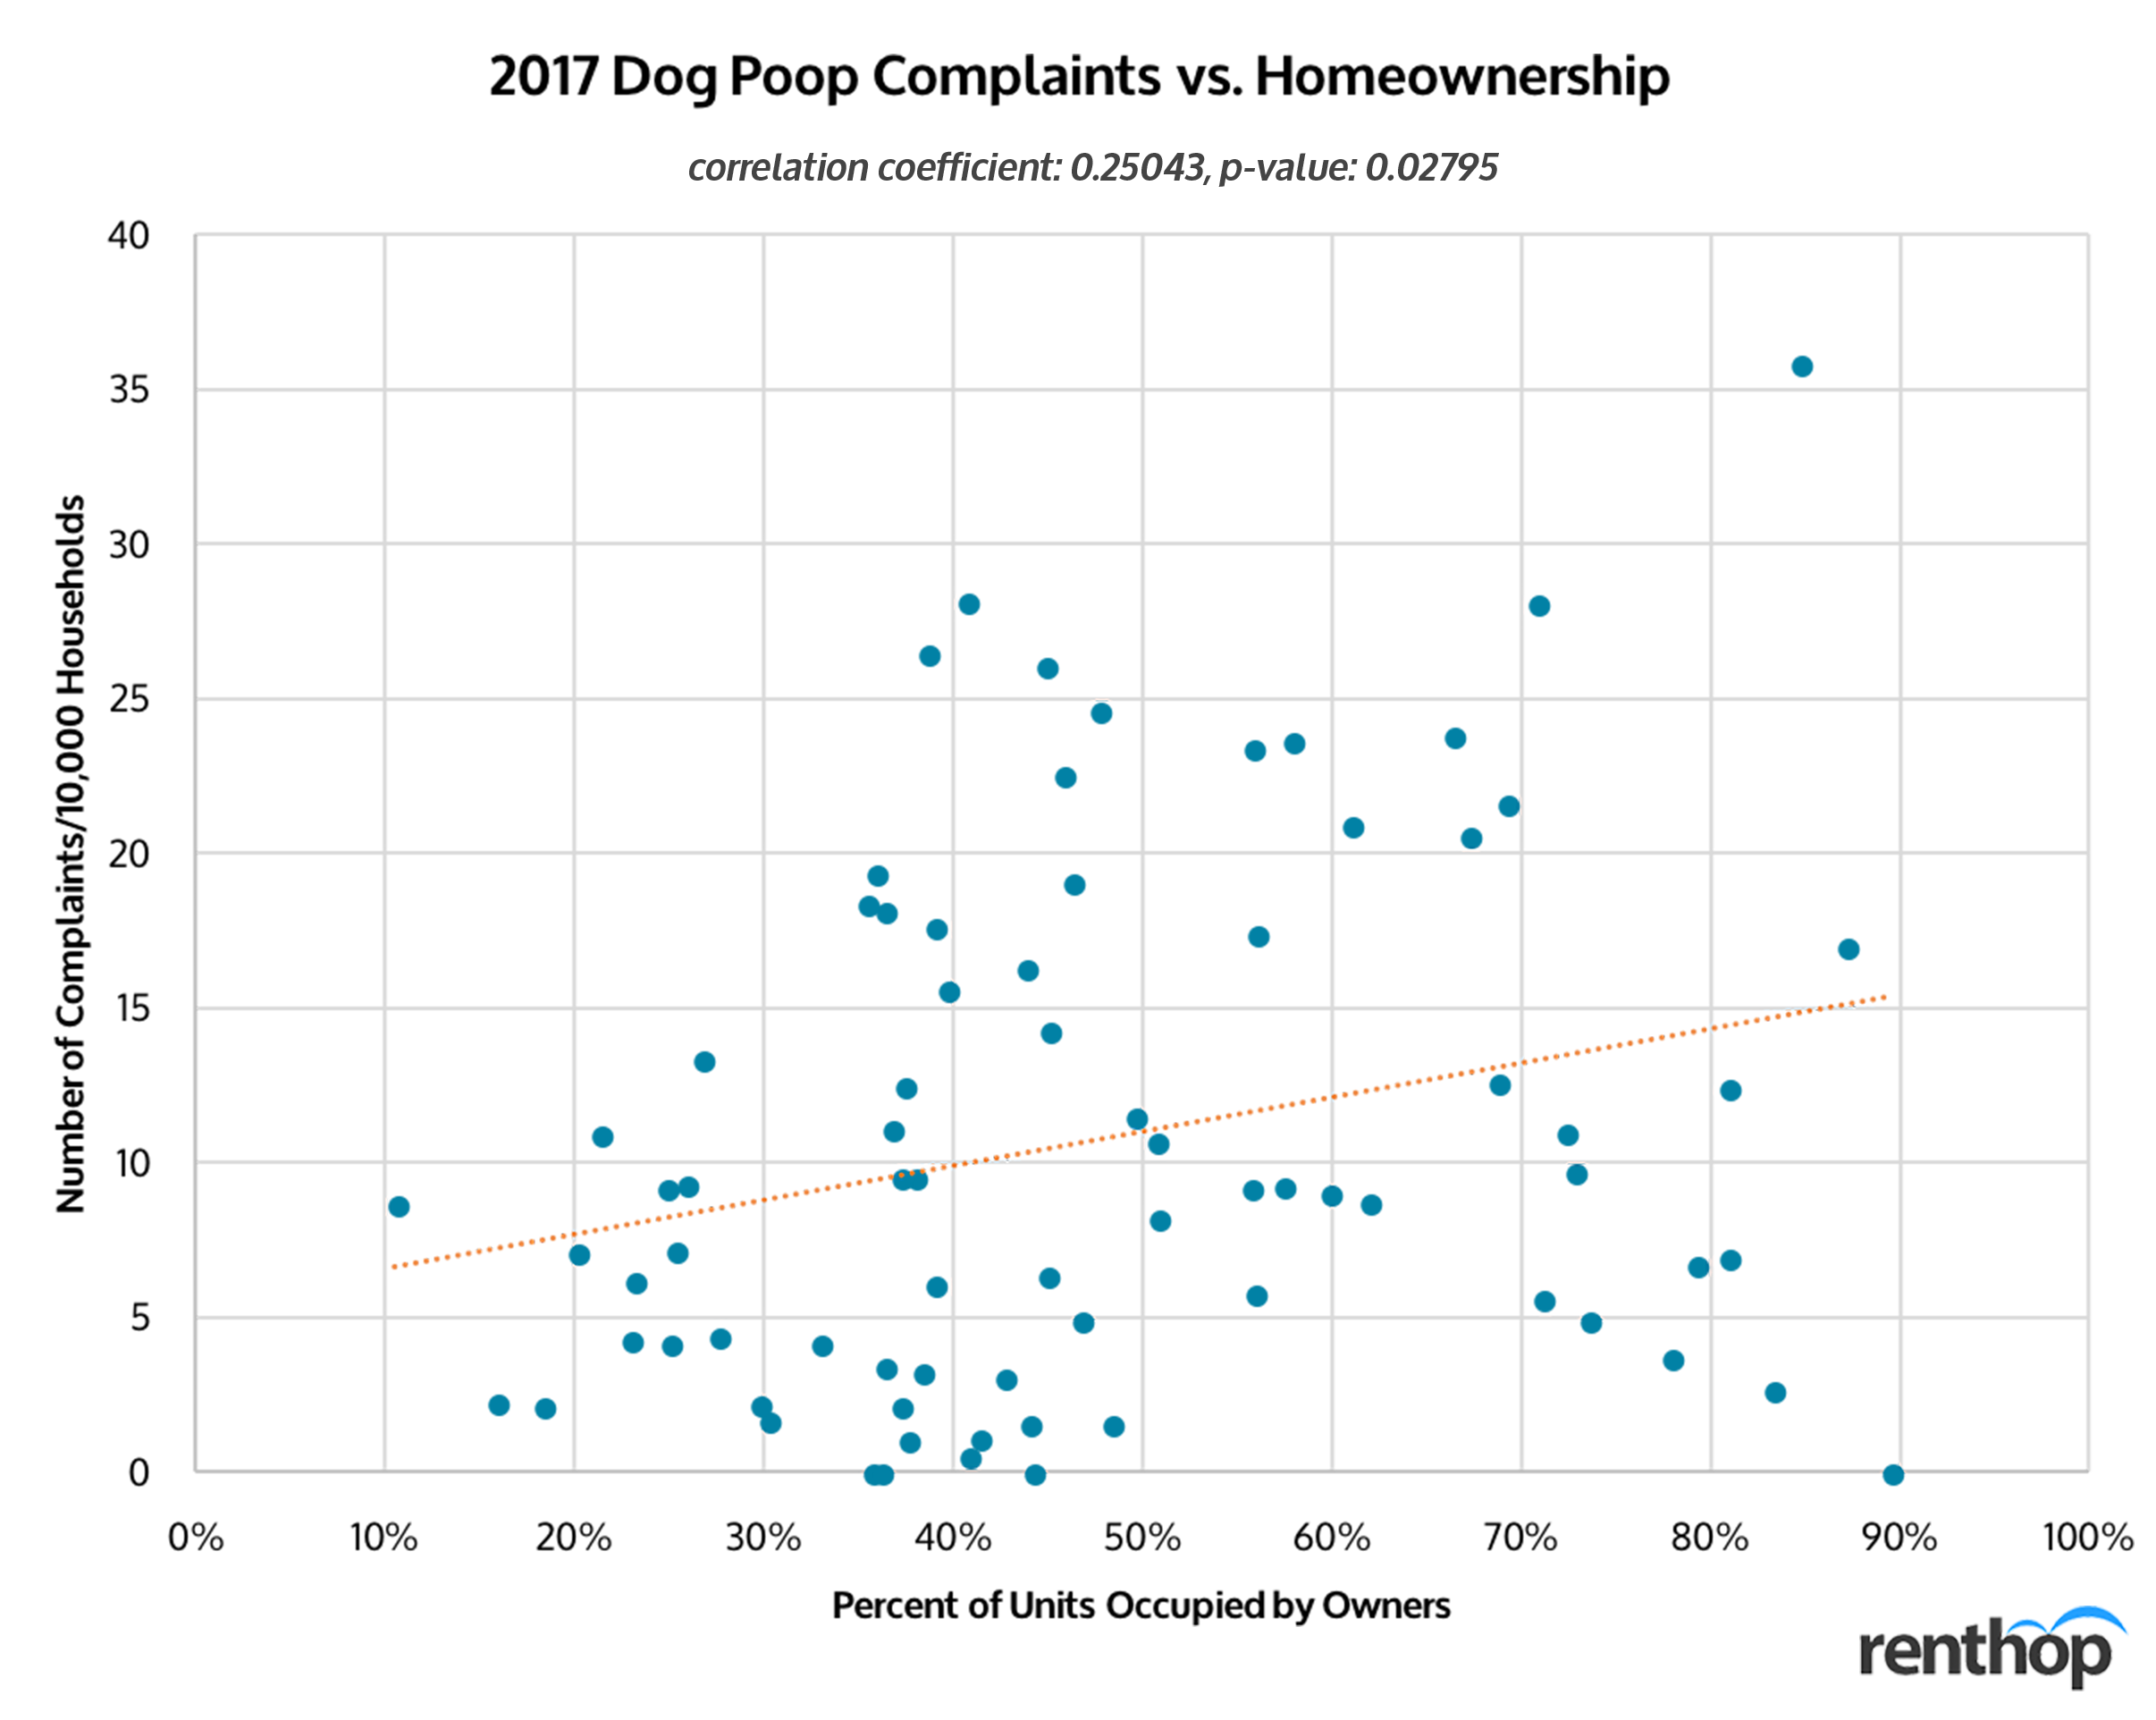
Last year, we found a correlation between the number of dog poop complaints and whether a unit is owned or rented, and the trend continued in 2017. Figure 1 below restates the correlation from 2011 to 2017, and Figure 2 illustrates the significant correlation (r=0.2554) we found when looking at only 2017 data. With p = 0.02489, it is unlikely that the correlation we found is a coincidence (whenever p is 0.05 it is likely not a coincidence). Indeed, correlation does not equal causation, but we do get a glimpse into what types of neighborhoods generate complaints. Maybe homeowners are more likely to complain when they spot dog feces? Maybe homeowners are more likely to have dogs? Or maybe homeowners do a worse job at cleaning after their pets? One cannot say from the available data.
The Higher the Rent Is, the Fewer the Poop Complaints
Additionally, when we looked at the data at a zip code level, we found another trend. As shown in Figure 3, there was a statistically significant negative correlation (r = -0.44917) between 2017 two-bedroom median rent and the number of dog poop complaints within a zip code. The more expensive the rent, the fewer the complaints. In this case, the p-value is 0.001039, which, again, indicates that it is less likely a coincidence. It could be that high-end buildings have staffers clean up the sidewalks and yards, or that many residents hire professional dog walkers to walk their dogs. Or, maybe the high pet fees are discouraging people from having pets?
Things are Getting Worse in These Neighborhoods
While the dog poop issue has been improving since 2017, things are getting worse in some areas. Figure 4 highlights the five neighborhoods that have seen an increase in dog poop complaints. The number of complaints in Ashburn, for example, almost tripled in 2017 compared to 2015. Similarly, in Clearing, the number of dog poop complaints doubled in the past two years. We could not help but wonder what is going on in these areas.
When to Watch Out
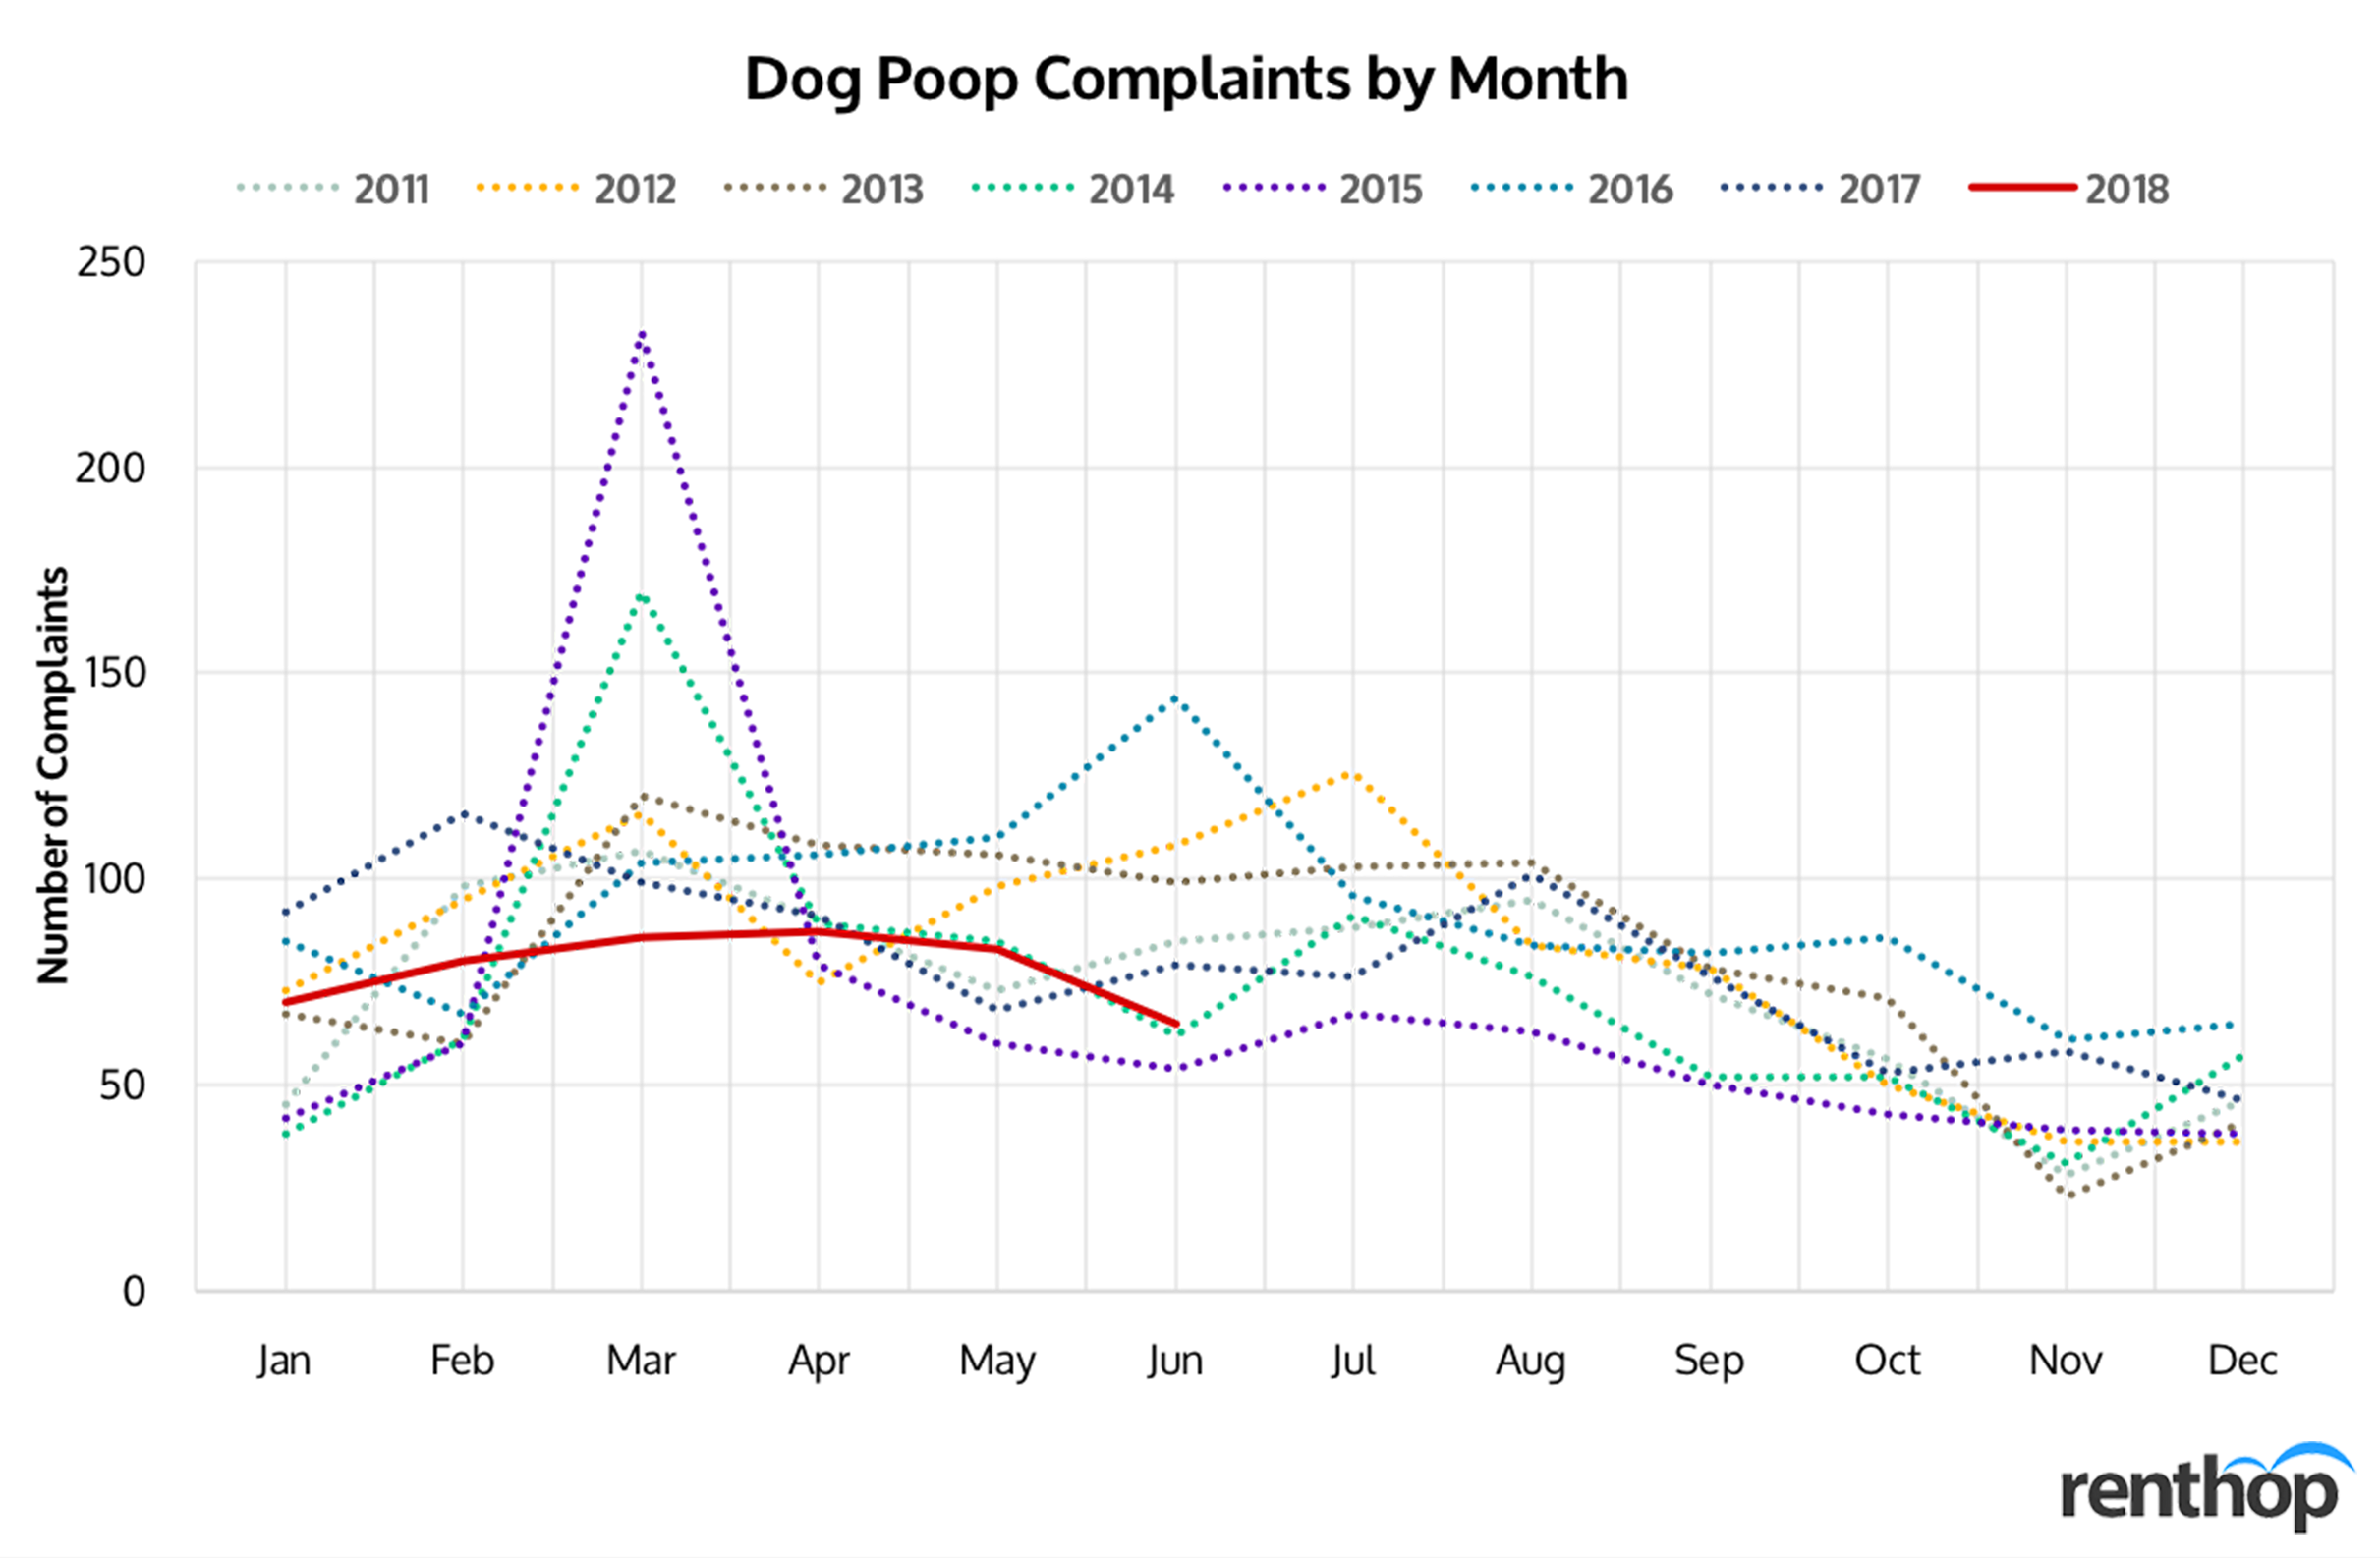
Since predicting where you will spot dog poop was not enough, we dug deeper. Did you know that March has been historically the top month for complaints? Specifically, the city received the most complaints (233) in March 2015. Perhaps, as the snow thaws, little poopsicles finally reveal themselves. It appears that, however, 2018 is going to be a good year. The Chicago 311 received the least number complaints in March 2018 compared to other years, and as of July 9, the city has only received 498 unique complaints (Figure 6) in 2018, 66 fewer than what it received in 2017 and 148 fewer in 2016 around the same time. Is 2018 just an outlier? We hope not.
We also Broke Down Complaints by Day of the Week
We found Mondays to be the busiest day, followed closely by Tuesday and Wednesday. It looks like Chicagoans take a break from calling in/going online and making complaints over the weekend, but once Monday comes (and with the Monday blues of course), they are not going to put up with that sh**.

It is worth noting that for the purpose of research, instead of covering small, undefined neighborhoods, we adopted community areas for this data study. Chicago community areas were defined by the Social Science Research Committee at the University of Chicago and are officially recognized by the City of Chicago. Both Census data and Chicago 311 complaints are tied to the Community Areas, and so we used the same method to ensure accuracy in interpreting the data.
If you’re in the market for a new Chicago apartment, we hope this RentHop study can serve as a resource for you to find one that’s low-poop. In addition to fun and interesting data studies, we also have thousands of great fee and no-fee apartments in Chicago. Check them out now!


