The post Renters in the Bronx Continue to Suffer this Winter appeared first on Real Estate Data & Research.
]]>Despite the NYC Heat Law, many landlords do not comply with heating regulations, resulting in many tenants reporting their buildings to 311. Each winter, RentHop analyzes the frequency of these calls throughout buildings, neighborhoods, and boroughs, finding that certain areas receive more heat complaints than others. Areas like Fordham Heights (Bronx), Flatbush (Brooklyn), and Little Italy (Manhattan) continue to receive a high volume of heat complaints. The following describes where renters are more likely to be left out in the cold.
Key findings from this year’s report include:
- In total, 172,692 heat and hot water complaints were filed to 311 residents across New York City from October 1, 2023, to February 16, 2024, 23.22% fewer than last winter.
- After grouping complaints by day and address, we found 120,092 unique complaints, 23.46% more compared to the same period last year.
- Many New Yorkers were left without heat on Valentine’s Day, with a total of 1,353 complaints, or 1,008 unique, filed. [Figure 1]
- Of the five boroughs in NYC, four received more heat complaints than last year, including the Bronx, Brooklyn, Manhattan, and Queens. [Section “Heat Complaints by Borough“]
- Some of the worst heat violation offenders include 76 Saint Nicholas Place (634 complaints / 128 unique), 31-35 Crescent Street (1,889 complaints / 116 unique), and 2176 Tiebout Avenue (1,413 complaints / 115 unique) [Data Table]
Heat Complaints by Borough
The Bronx
- The Bronx remains the coldest borough, receiving 41,010 unique heat complaints this winter as of February 16.
- Norwood is the coldest neighborhood in the city, with 2,013 unique complaints, or 1828.67 complaints/10k renter-occupied units. Complaints increased by 2.94% from last year.
- 80%, or eight, of the 10 coldest NYC neighborhoods reside in the Bronx.
Brooklyn
- Brooklyn received 33,686 unique heat complaints, increasing by 1.29% from last year.
- Flatbush remains the coldest neighborhood in Brooklyn, with 5,563 unique complaints and 1,146.51 complaints/10k renter-occupied units.
Manhattan
- Heat complaints are up 4% from last year during the same period, with residents filing 26,166 unique heat complaints.
- In the coldest neighborhood, Little Italy, heat and hot water complaints are down 9.78% from last year.
Queens
- Queens received 17,667 unique heat complaints this year, up 6.9% from last year, the most of all boroughs.
- Holliswood is the coldest neighborhood in the borough, where complaints are up 106.82%.
Staten Island
- Renters in Staten Island have filed 1,563 unique complaints as of February 16, 2024, down 6.07% from last year.
- The neighborhood with the most complaints, Clifton, has 1528.48 unique heat complaints per 10k renter-occupied units this year.
When Does the Heat Season Start?
Landlords in New York City must provide heat for all of their tenants from October 1st through May 31st. This period is referred to as the “Heat Season.” Heating requirements include:
- Between 6:00 AM and 10:00 PM, if the outside temperature falls below 55 degrees, the inside temperature is required to be at least 68 degrees F
- Between 10:00 PM and 6:00 AM, if the inside temperature is required to be at least 62 degrees F, no outside temperature requirement
Many buildings in the city do not provide adequate heat for their residents, with some addresses receiving significant numbers of complaints throughout the Heat Season. Buildings like 31-35 Crescent Street in Queens and 2176 Tiebout Avenue in the Bronx received hundreds of complaints this year.
Surely, when tenants are suffering, they make dozens of complaints each day to 311. Therefore, to accurately measure the number of days a building goes without heat, RentHop grouped the heat/hot water complaints by address and created date. Complaints filed on the same day regarding the same building are considered one unique complaint. From Oct 1, 2023, the start of this Heat Season, to February 16, 2024, the city received 120,092 unique heat complaints, 4.33% higher than the total unique count of 115,166 in the same period last year.
Renters Suffer as Temperatures Drop Below Freezing
It is no surprise that when the temperature drops, renters are more likely to file a complaint, but by how much? We at RentHop visualized the correlation for you in Figure 1. As you can see, the recent cold waves have driven many renters in despair to call 311, with unique complaints shooting over 2,000 on January 18 and 19, when the lows in mid 20s. The volume of complaints 311 had to process soon dropped below 750 as the temperature rose above freezing. Complaints picked up between February 5 and 6 and broke 1,000 again on February 14, when the averages fell close to 32 degrees. It looks like many New Yorkers were left with only the heat of passion on Valentine’s Day to keep them warm.
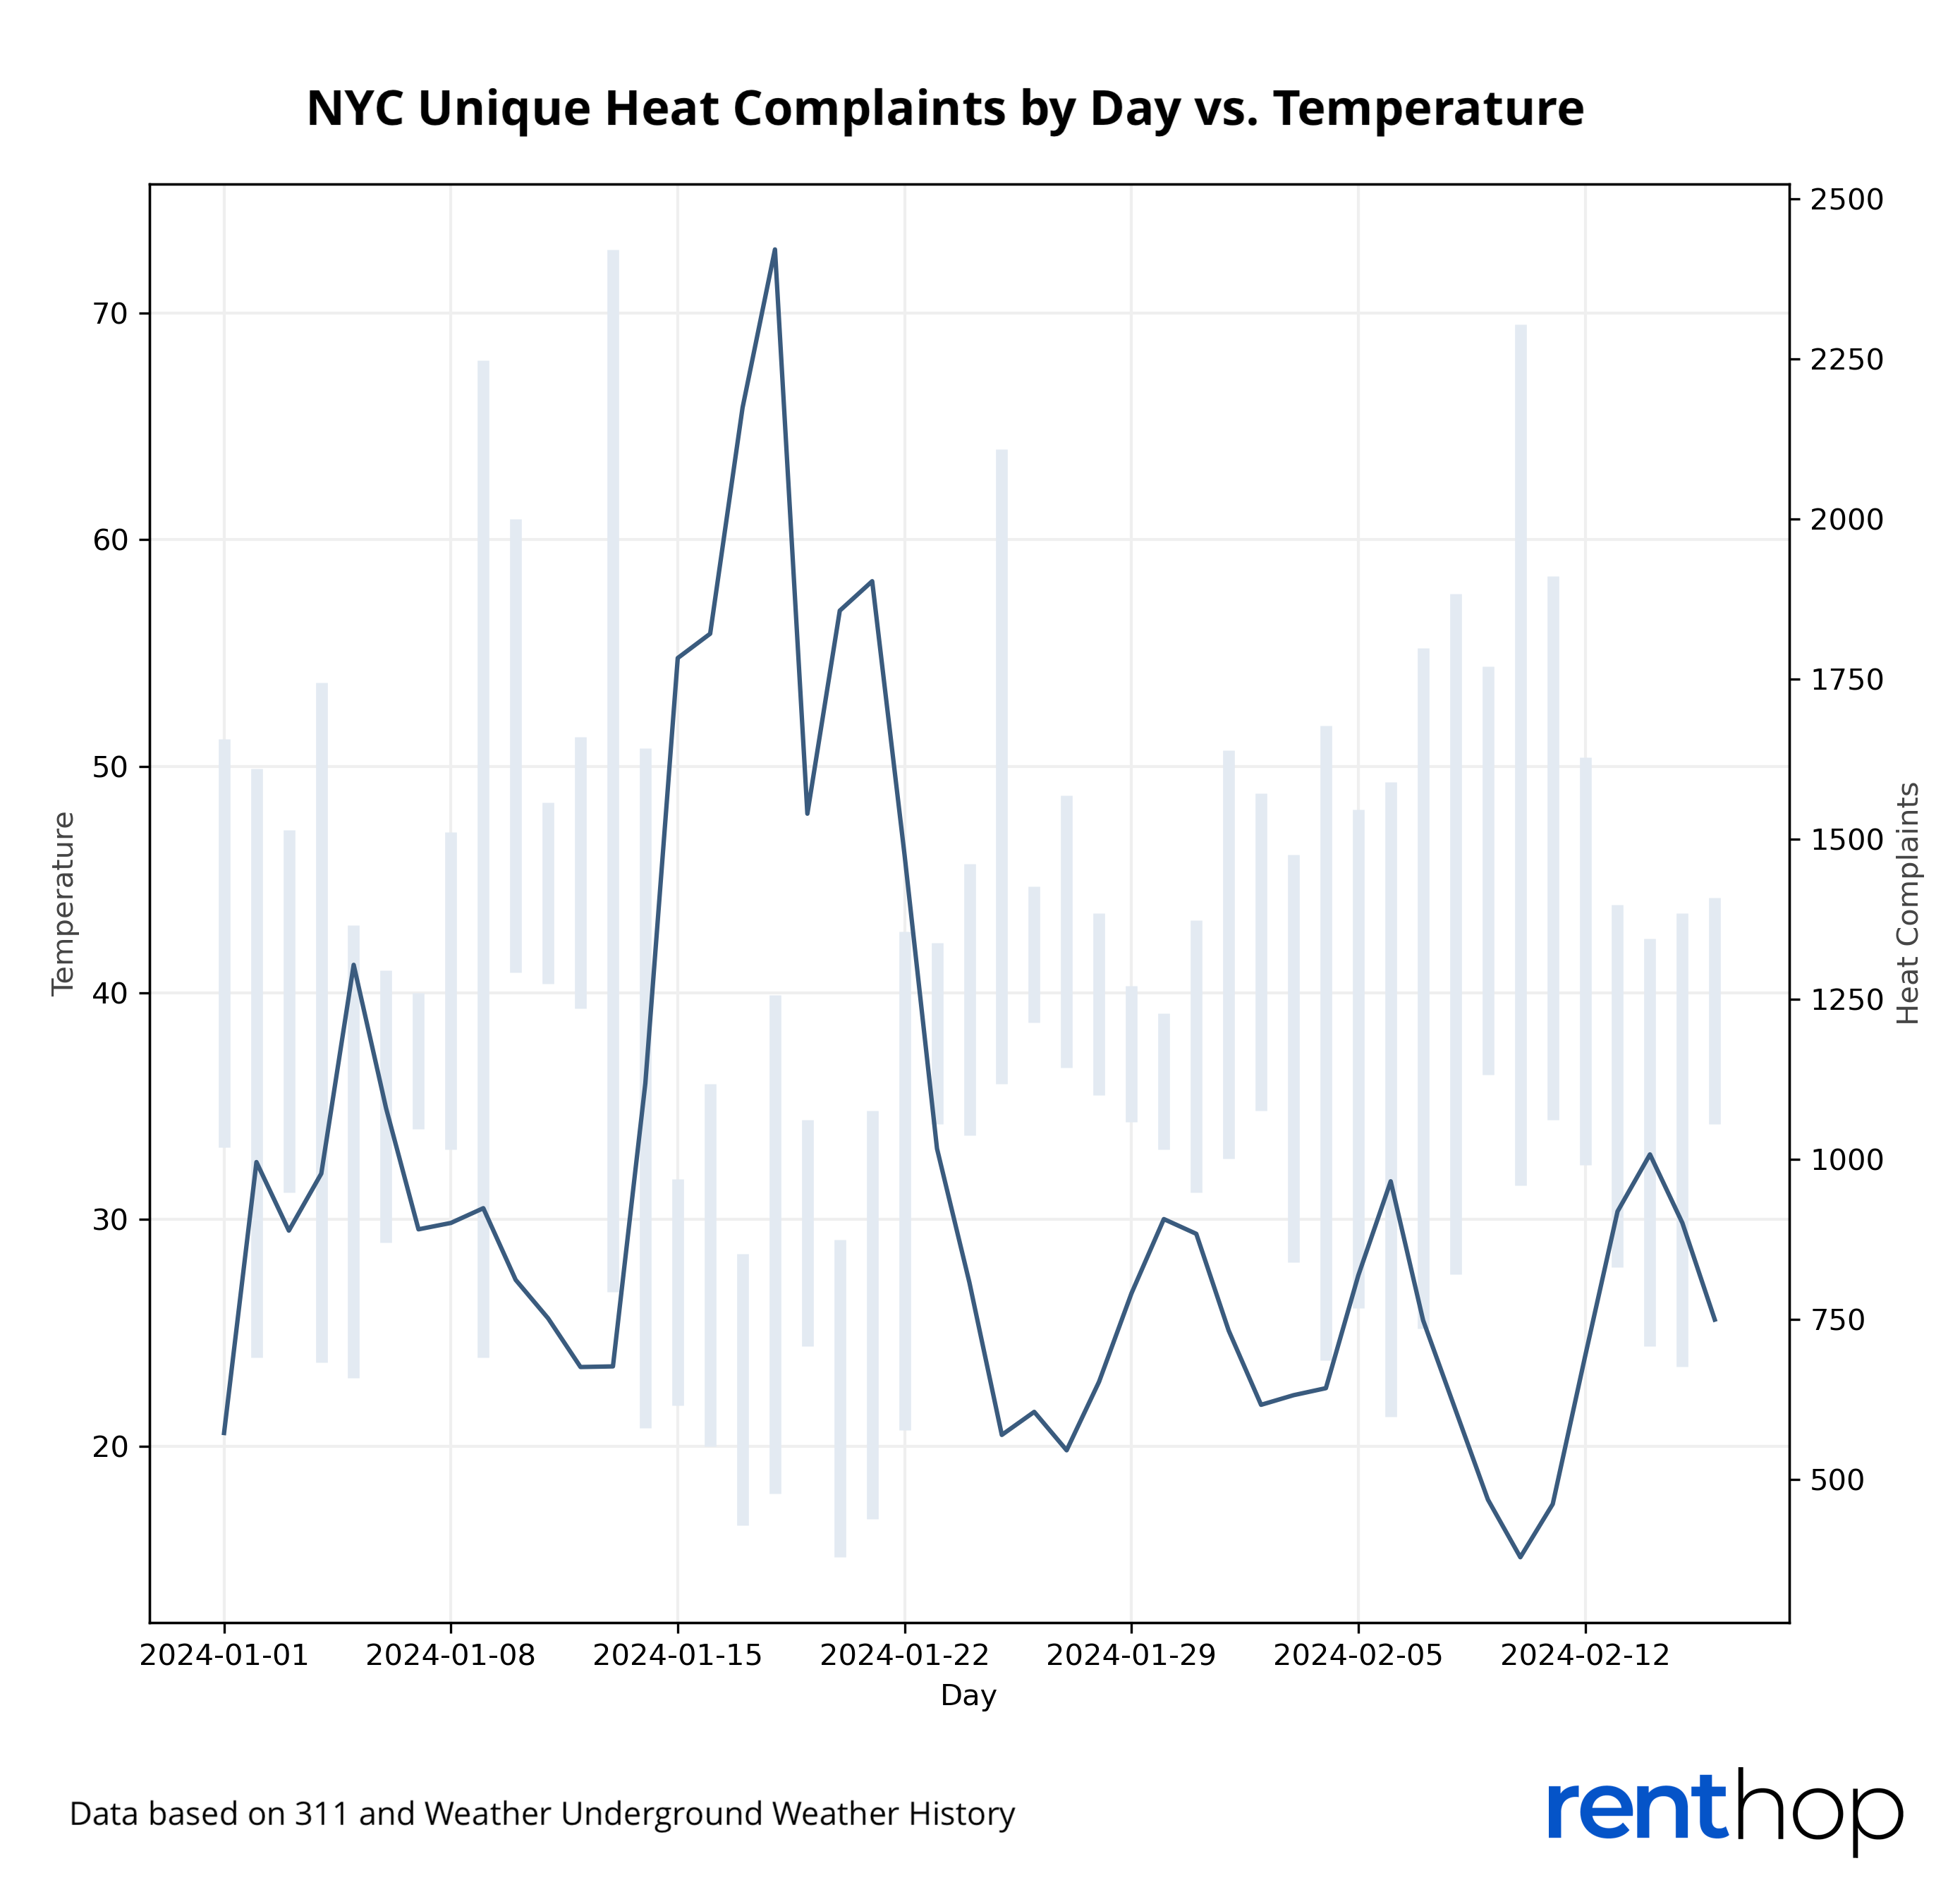
Figure 1
The Bronx Remains NYC’s Coldest Borough
Figure 2 demonstrates the number of normalized heat complaints per borough from October 1st to mid-February of 2020 through 2024. The Bronx consistently receives the highest number of heat complaints annually, accounting for 34.15% of total city-wide complaints this season. Brooklyn outpaced Manhattan this year and became the second-coldest borough in New York. The borough received 510.35 complaints per 10,000 renter-occupied units. Heat complaints have risen across all boroughs other than Staten Island this year.
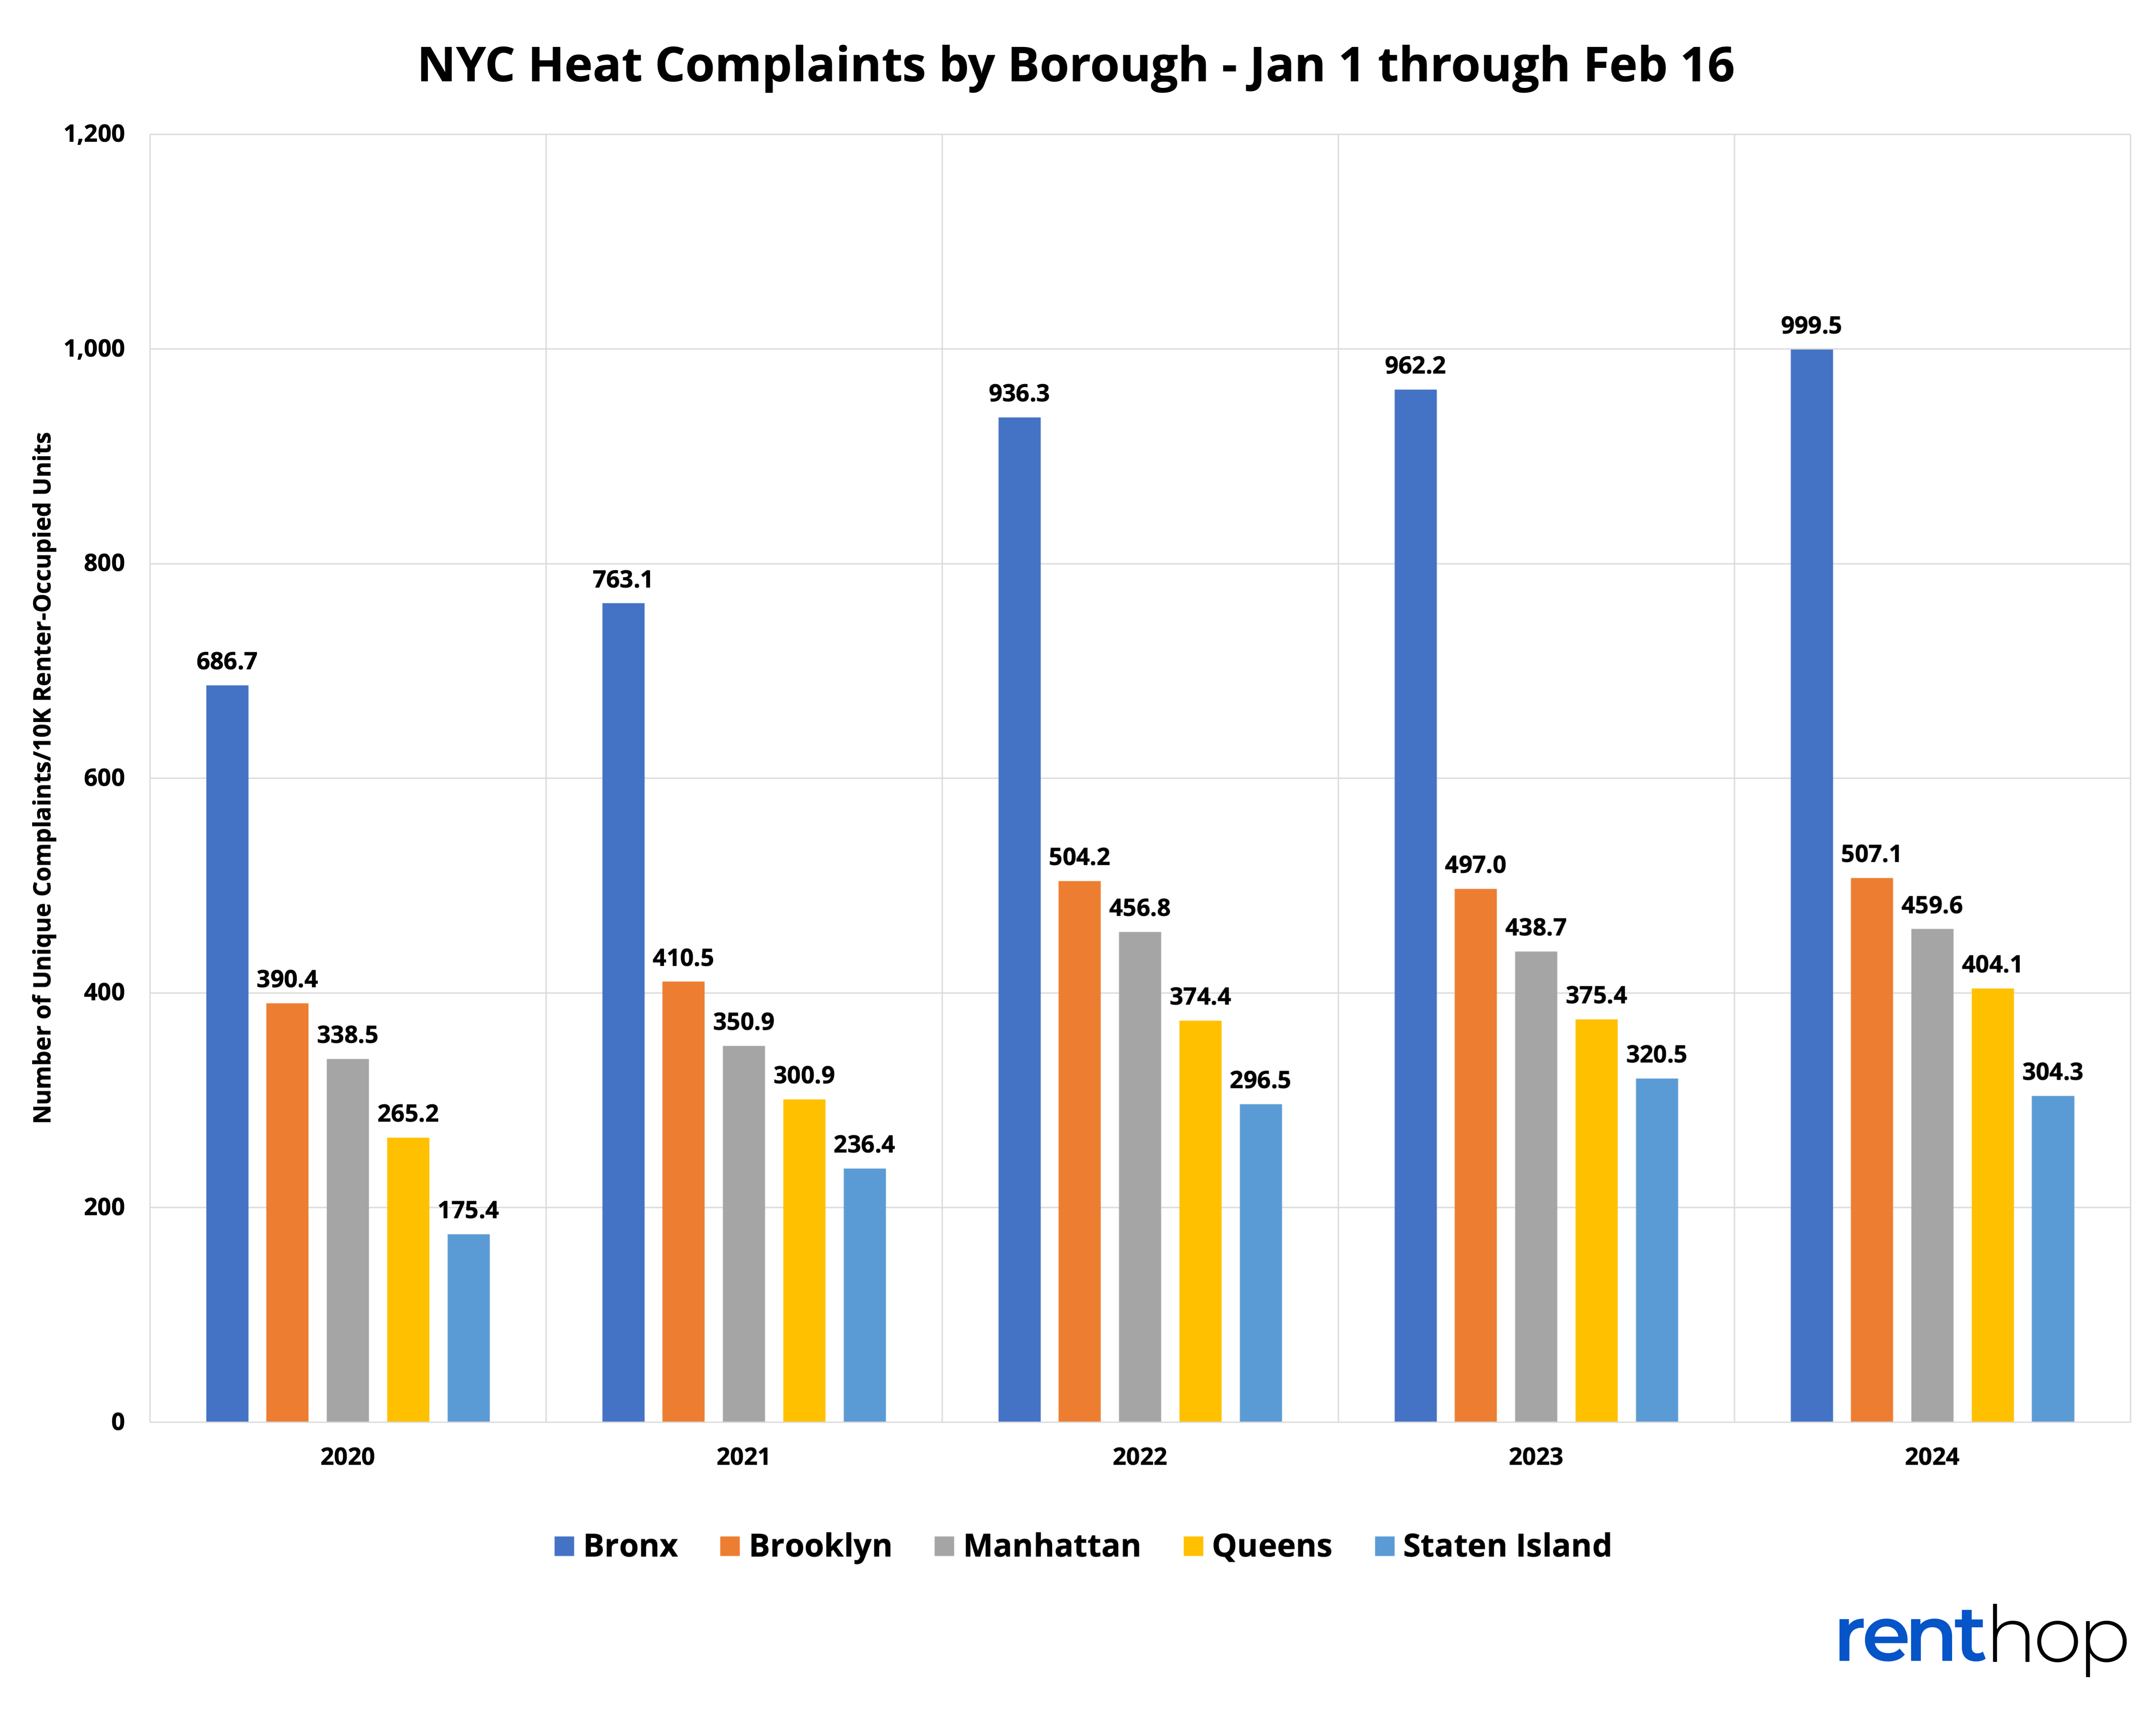
Figure 2
Mapping the 311 Heat Complaints by NYC Neighborhood
To fairly rank the neighborhoods, we further normalize the data by dividing the number of heat complaints by the number of renter-occupied units in a neighborhood retrieved via the 2021 American Community Survey (homeowners can control their heat and are therefore excluded from this study).
The map below illustrates how “cold” each NYC neighborhood is. The darker the shade, the more heat complaints per 10,000 renter-occupied units a neighborhood has seen this winter. Click on the neighborhood to learn more.
Neighborhoods in the Bronx received more heat complaints than the other boroughs. Out of the 20 coldest neighborhoods in New York City, 14, or 70%, are in the Bronx. Other areas of the city, like neighborhoods in Manhattan above Central Park and Central Brooklyn, receive frequent heat complaints as well.
These are the Coldest Neighborhoods in NYC
Figure 3 showcases the top 20 neighborhoods with the largest amount of normalized heat complaints this season, from October 1st to January 9th, 2023. 17 of the 20 neighborhoods are located in The Bronx.
Norwood took over first place this year, replacing Pelham Parkway. The neighborhood received 10.73% more complaints than last year, with 1,828.67 complaints per 10k renter-occupied units reported between October 1 and February 16, 2024. Overall, 16 out of the coldest 20 neighborhoods received more complaints this year than last year. These neighborhoods include Concourse Village (-9.58% YoY), East Tremont (-2.99%), and Bedford Park (-1.39%) in the Bronx.
Little Italy remains Manhattan’s coldest neighborhood despite 9.76% fewer complaints than last year. It’s worth noting that most buildings receiving complaints in Little Italy are older and smaller, built in the early 1900s and hosting fewer than sixteen residential units. As of February 16, the neighborhood had received 1,401.52 complaints per 10k renter-occupied units this heating season. Inwood ranks as the second coldest neighborhood in Manhattan, with a total of 1,294.12 unique complaints filed per 10k renter-occupied units, 30.78% worse than in the previous winter.
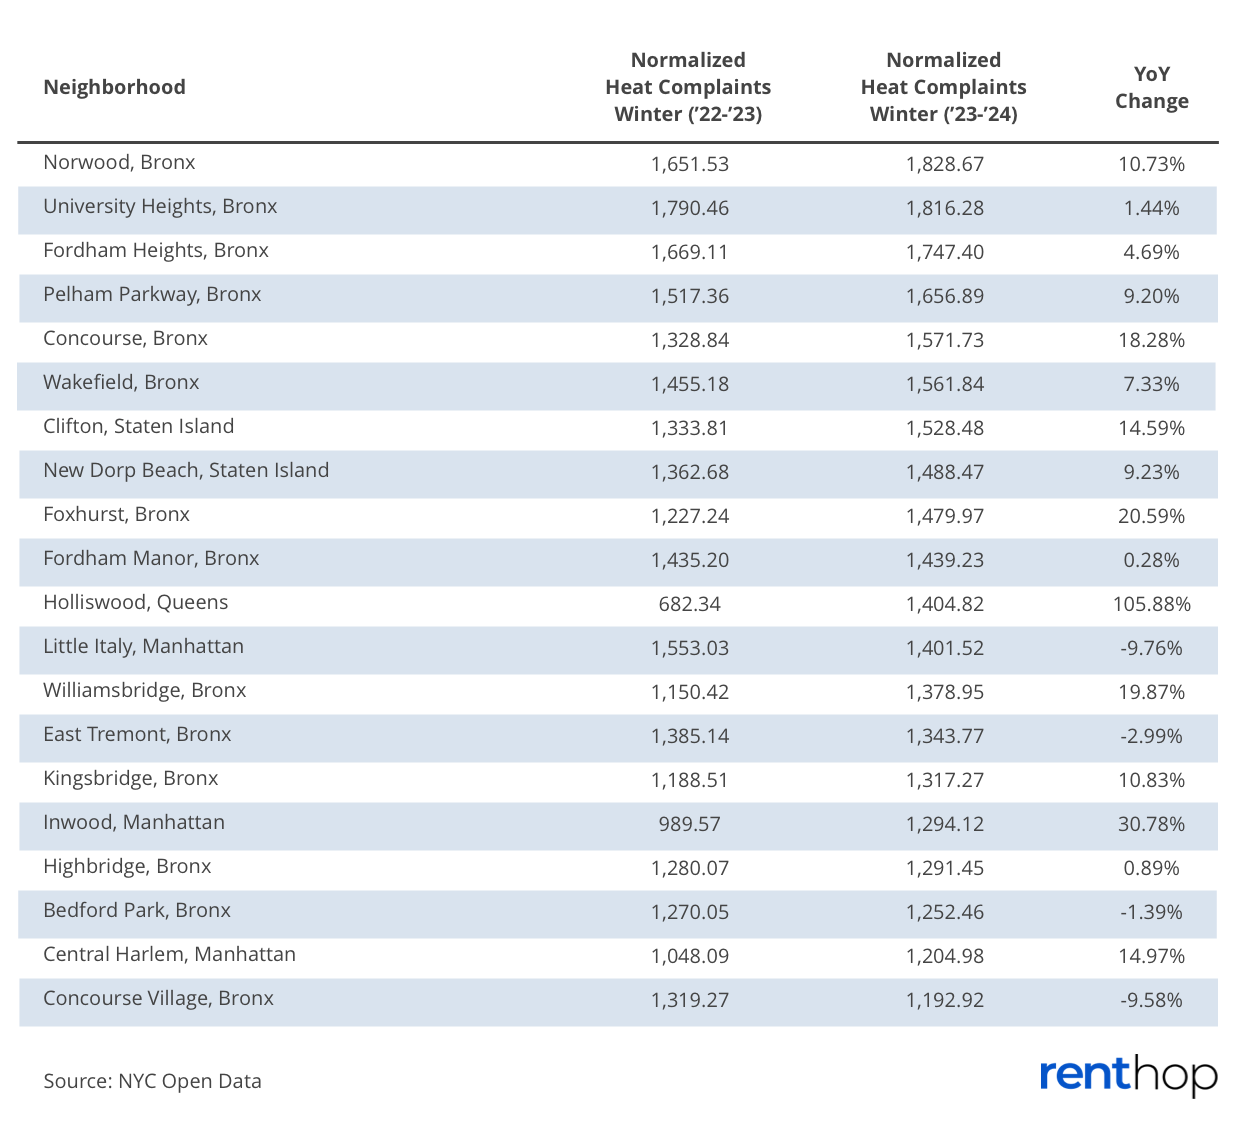
Figure 3
Winter Just Got Colder in These Neighborhoods
Figure 4 displays the neighborhoods with the greatest increase in heat complaints this year. Complaints in Huguenot, Staten Island shot up eight times year over year. Meanwhile, renters in Glen Oaks filed more complaints than in 2023. The neighborhood has received 167.17 complaints per 10k renter-occupied units this winter, 175% worse than a year ago.
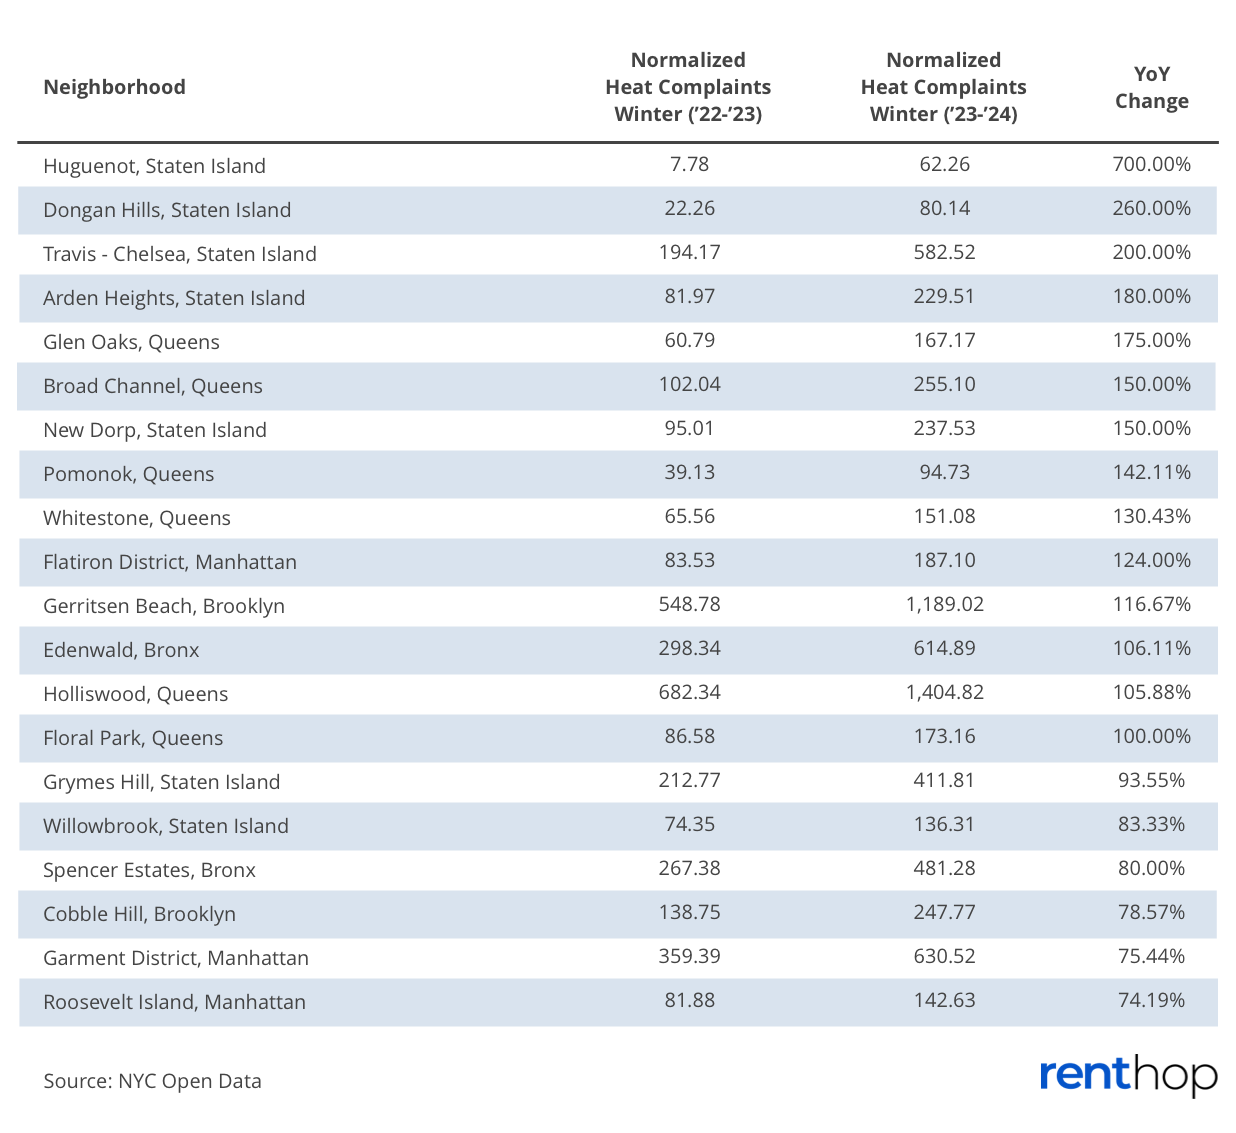
Figure 4
Buildings with Frequent Heat Complaints
While some neighborhoods receive more complaints than others, certain buildings have a high amount of complaints as well. The following table displays the 100 buildings across the city with the highest number of heat complaints this year. If you’re looking to sign a lease, make sure to check your building against this list to ensure you’ll stay warm in the winter. You can further explore the data by sorting the data by column or doing a quick search using the search bar.
The post Renters in the Bronx Continue to Suffer this Winter appeared first on Real Estate Data & Research.
]]>The post Best Cities for Single Young Professionals appeared first on Real Estate Data & Research.
]]>
For single young professionals in the U.S., finding the perfect city is like choosing a Netflix show – there are endless options, but deciding on one can feel overwhelming. You’ve got places like Austin, where the job market is as hot as the barbecue; Boston, where the dating scene requires as much strategy as a Red Sox game; or New York City, where the cost of a studio apartment requires a kidney sale on the black market.
It’s all about striking a balance between a paycheck that lets you live beyond a diet of instant noodles and a social life that doesn’t solely revolve around your cat (although we at RentHop really love our cats and would die to spend time with them day and night). To help you balance your career and love life, we set out to rank the 100 largest cities for single young professionals in the U.S.
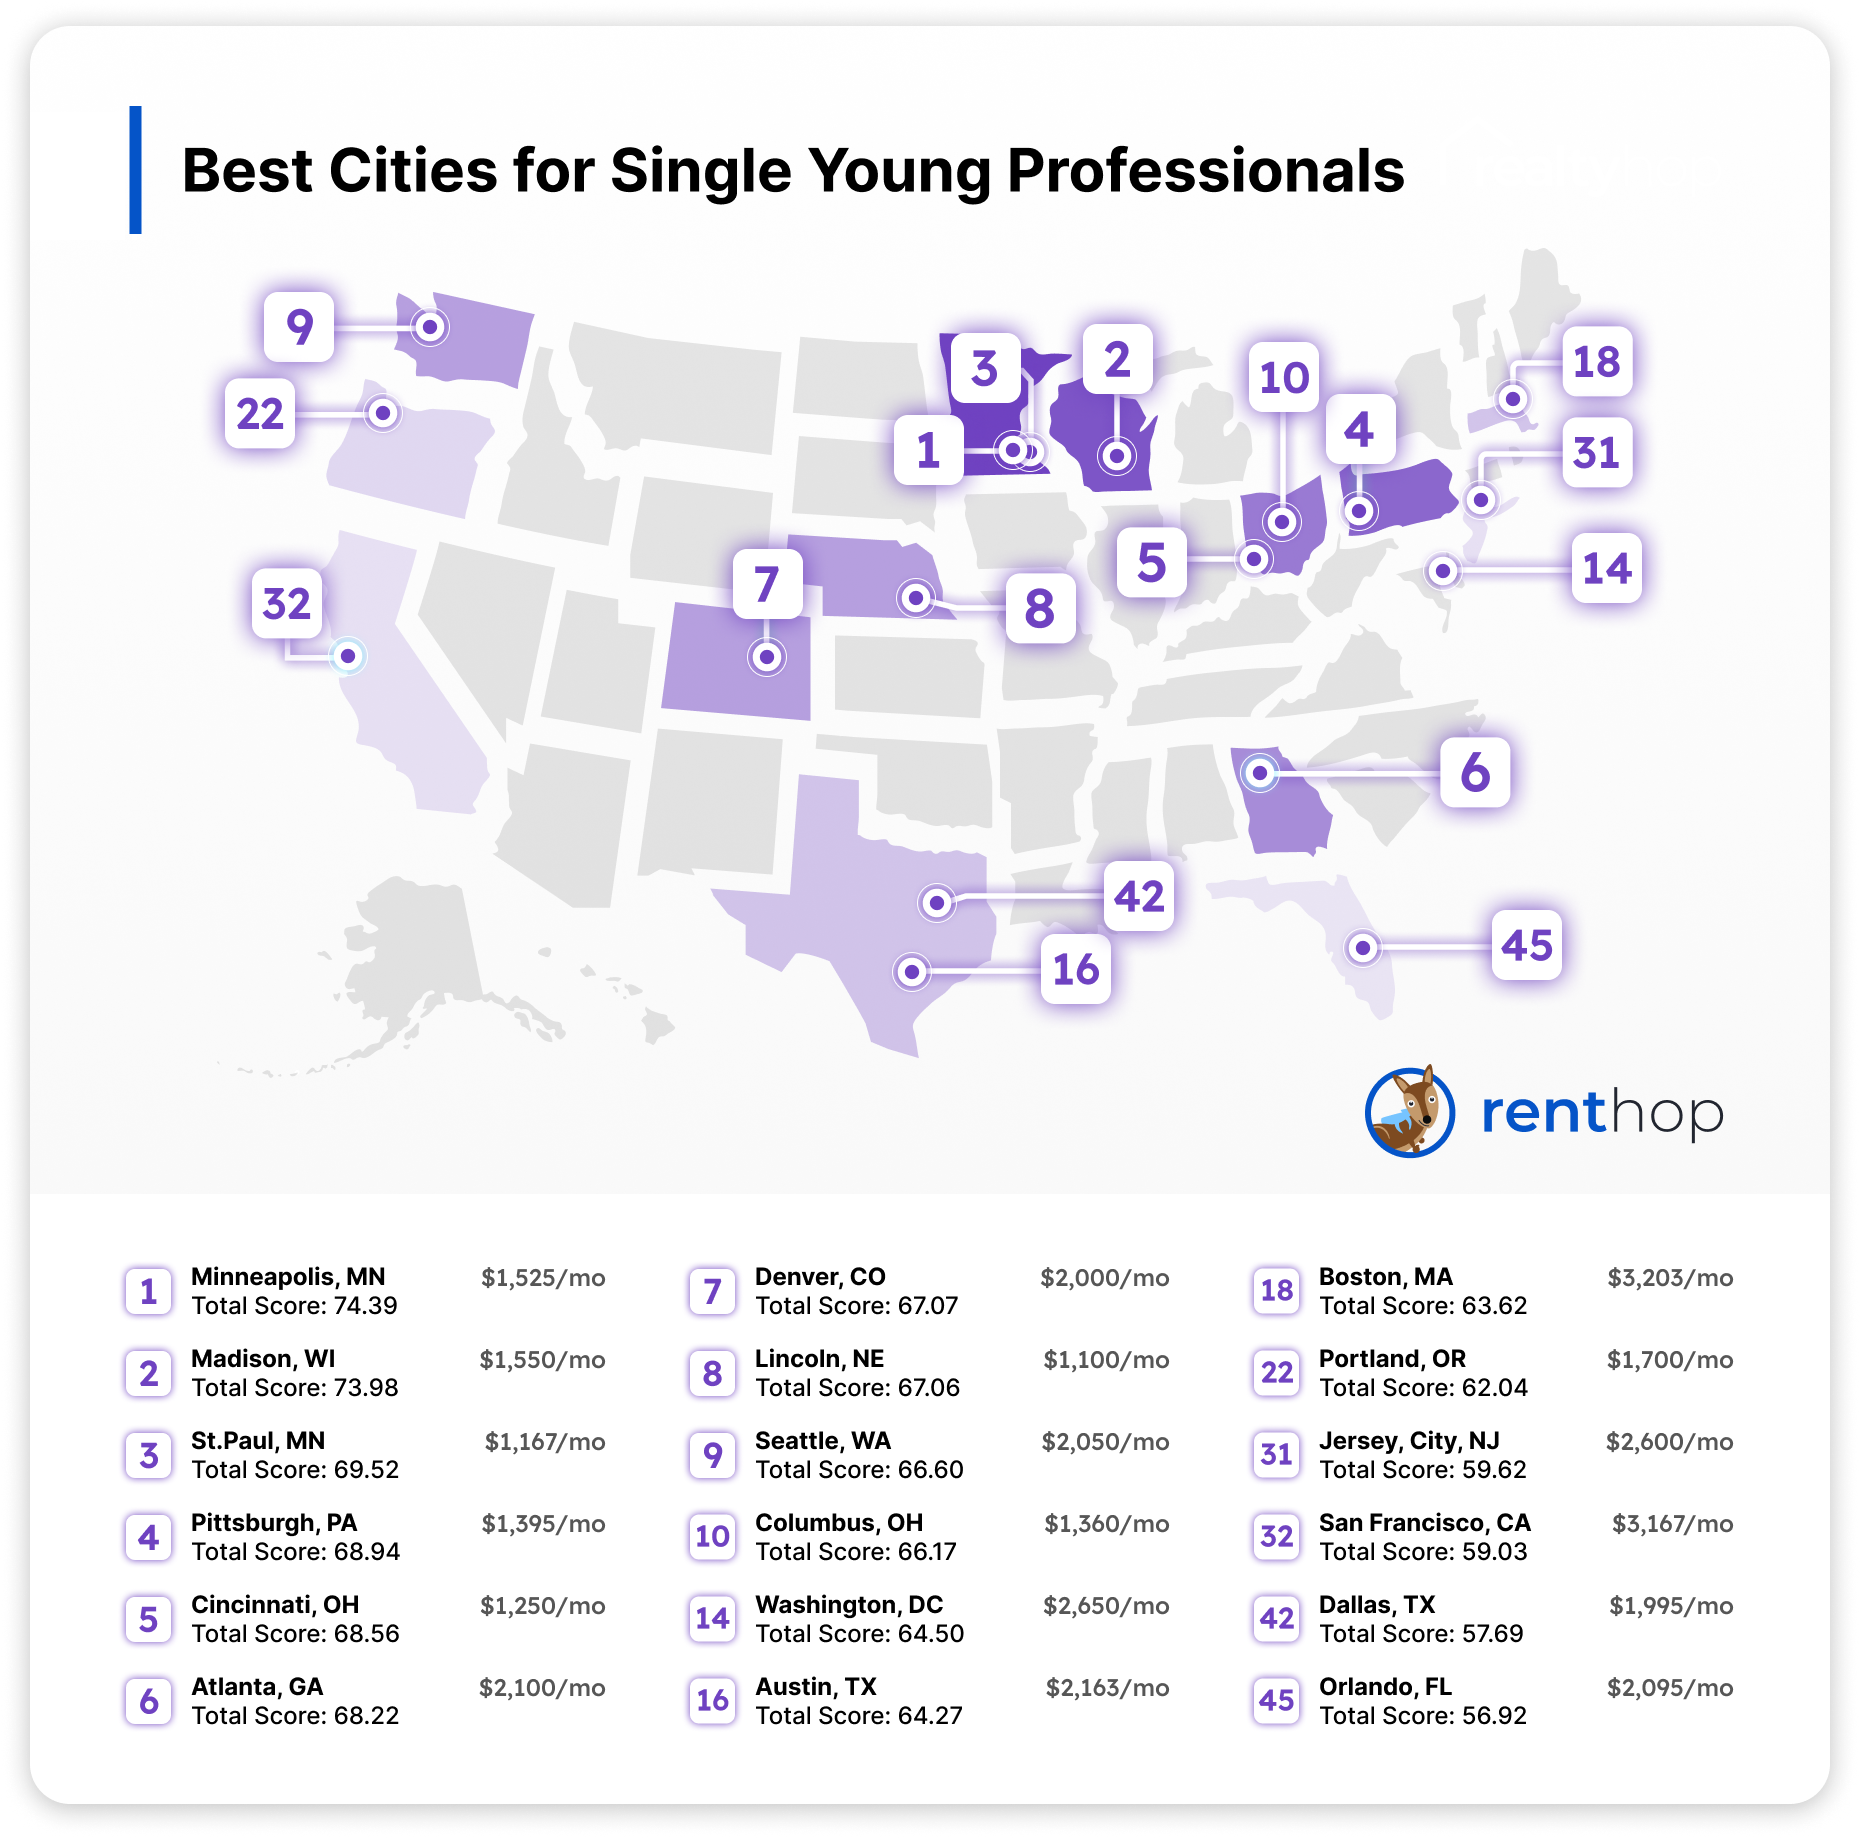
Here are our findings:
- Minneapolis is the best city for single young professionals. The city boasts a total score of 74.39, thanks to relatively affordable housing options (median rent at $1,525), a low unemployment rate, and over 30% of the young population.
- St. Paul ranks as the third-best city for single young professionals. The Twin Cities as a whole is a great hub for young professionals to find love and a successful career.
- New York City ranks as the worst city for single young professionals, scoring 34.73. The city has one of the most expensive rental markets in the world, making it less ideal for young professionals.
- Austin ranks as the best city for single young professionals in Texas and the 16th best for the U.S. The city enjoys a high dating score and a good job environment, with a 3% unemployment rate.
- San Francisco is California’s best city for single young professionals, thanks to a high career score. However, the city has very high living costs, with the current median rent at $3,167.
These Are the Top 10 Cities for Young People Looking for Success and Love
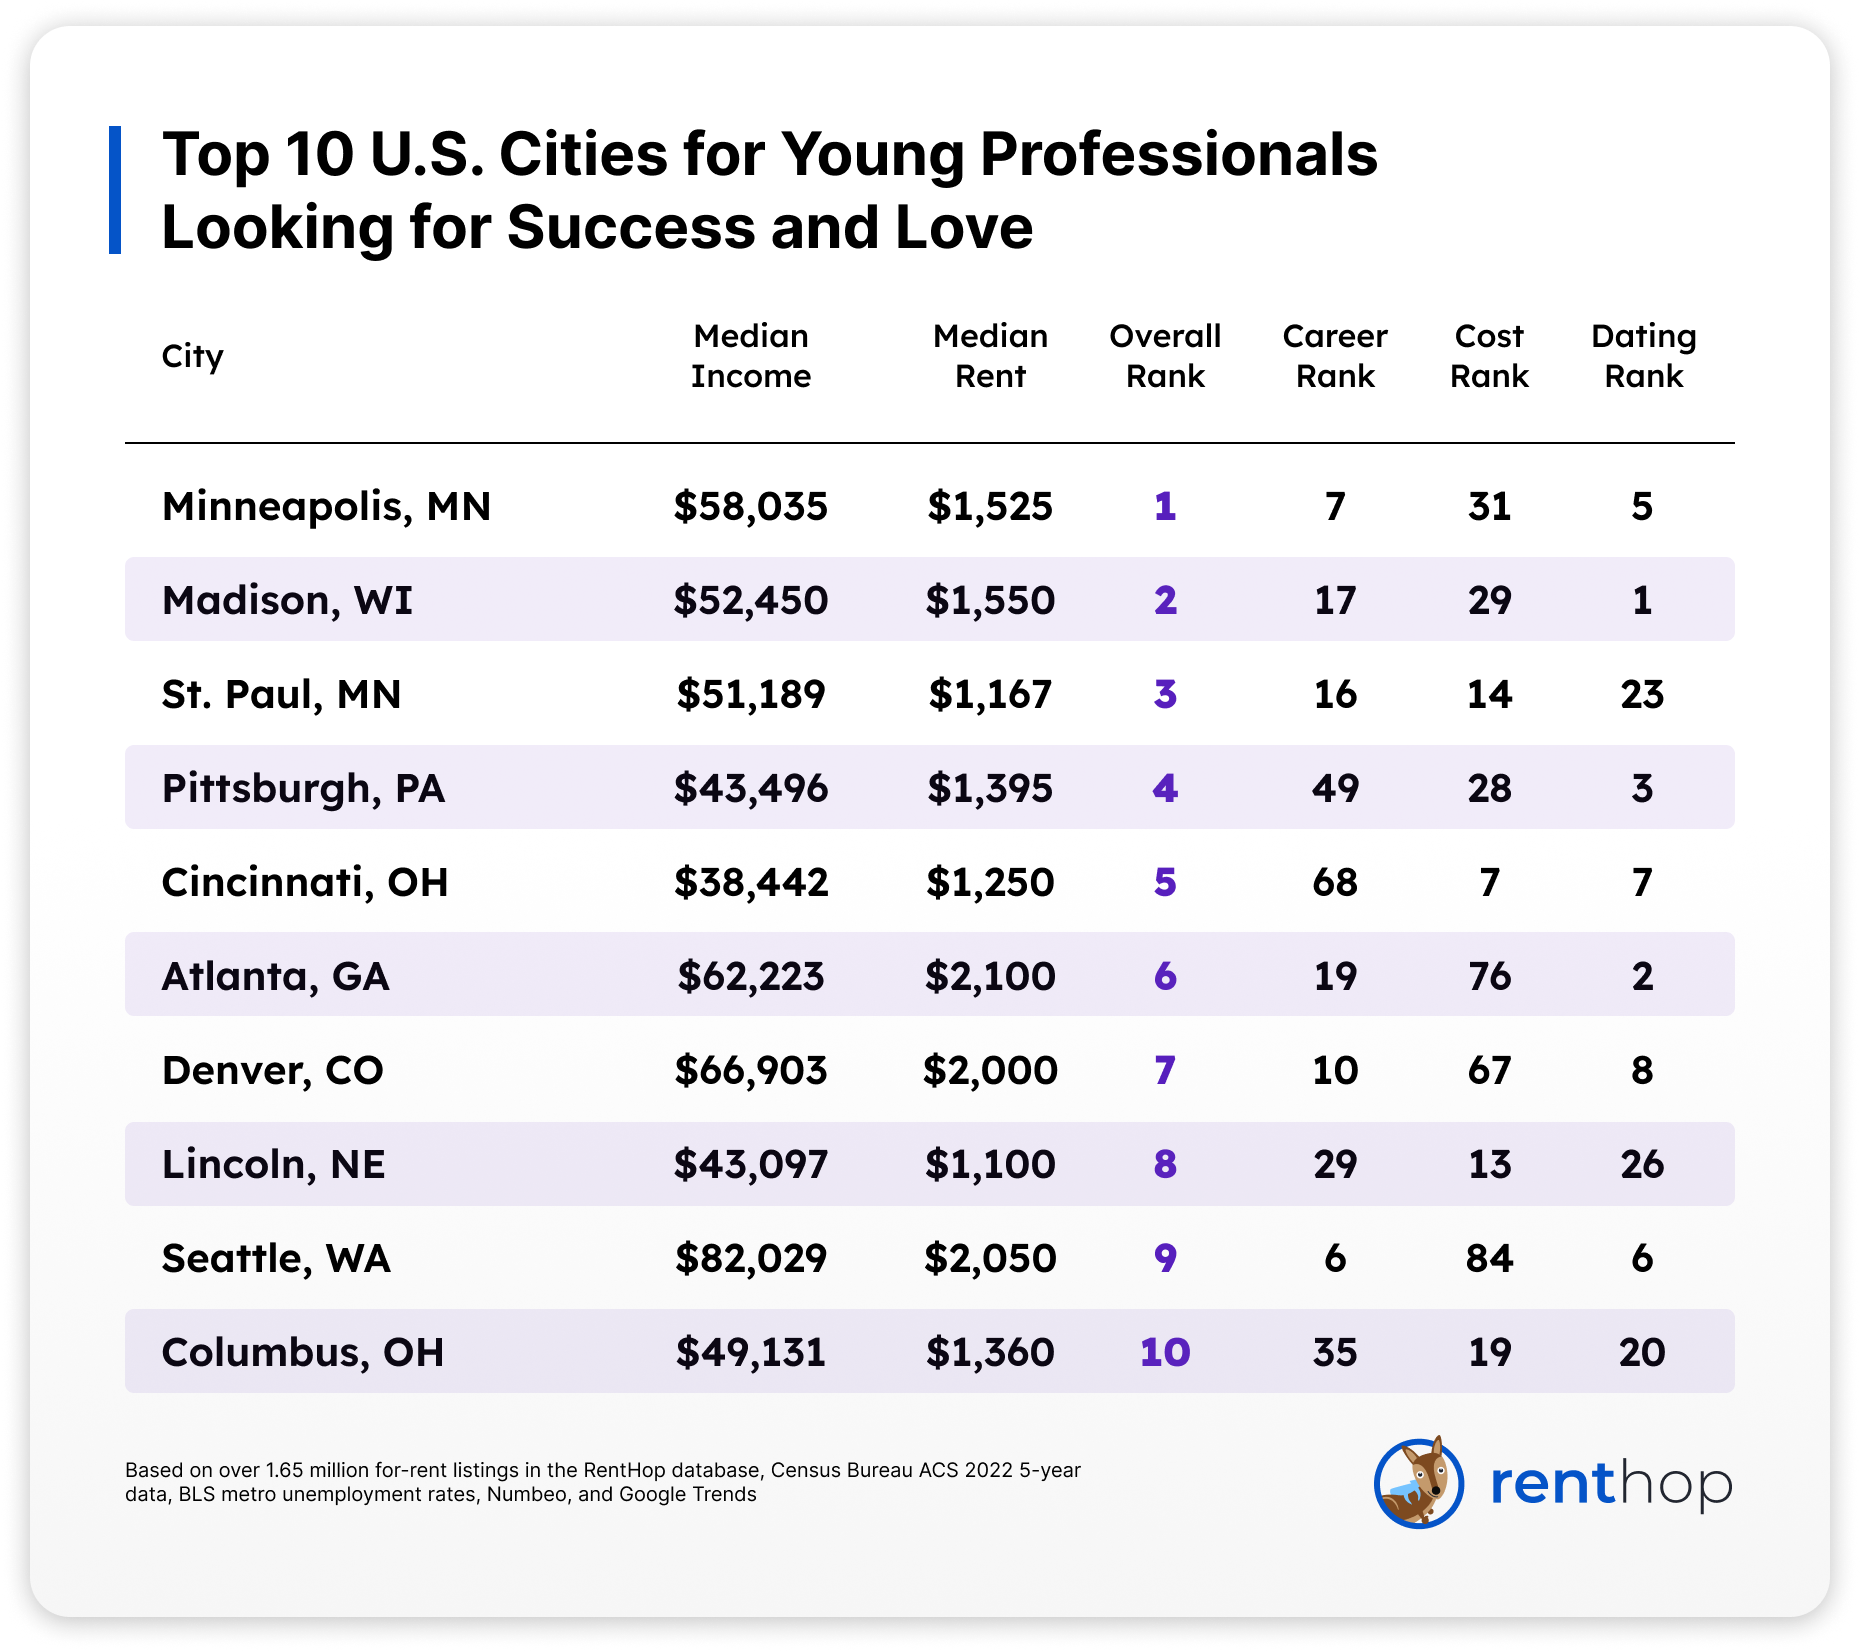
1. Minneapolis, MN
Minneapolis stands out as the best city for single young professionals. The city dazzles with a total score of 74.39 and is celebrated for its affordable living costs and a robust career landscape with a low 1.9% unemployment rate. Some useful information for young professionals looking to rent in Minneapolis – the median rent is currently $1,525 per month.
2. Madison, WI
With a total score of 73.98, Madison secures the title of the second-best city for young professionals looking for opportunities and companionship. The median rent currently sits at $1,550, making it an appealing option for those who just started their career. The city performs exceptionally well on the dating front, #1 in dating opportunities, thanks to a large young population. The University of Wisconsin is a major driver for the young population in the city – over 34% of the population in Madison are between 20 and 34 years of age, and the majority of the population (61.9%) are single.
3. St. Paul, MN
Similar to its Twin City counterpart, St. Paul is very favorable for 20- to 34-year-olds looking for a promising career and relationships. While the income levels are lower compared to Minneapolis, with a median income of $51,189, St. Paul is more affordable, therefore earning itself 85 points in the cost of living category. Renters can expect to spend an average of $1,167 a month on housing.
4. Pittsburgh, PA
Pittsburgh stands out as an affordable option for young professionals. The city ranks #28 in the cost of living category, with a median rent of $1,395. What makes Pittsburgh even more favorable is the dating opportunities – more than 32% of the population is between 20 and 34 years of age, and 68% of the population is single.
5. Cincinnati, OH
Cincinnati ranks as a Midwest gem with a total score of 68.56. Thanks to affordable groceries, dining options, and rental inventory, the city is the fifth most affordable city in our index this year. Renters can expect to spend an average of $1,250 a month on housing.
6. Atlanta, GA
Atlanta has experienced major growth in the past decade and has some of the highest concentrations of Fortune 500 companies across different industries. The city scores 68.22 in our rankings this year, with a relatively high median nonfamily household income of $62,223 and great dating opportunities. Around 31.5% of Atlantans are between 20 and 34 years old, and a whopping portion, 69.38% of its population, is single.
7. Denver, CO
Denver attracts Millennials and Gen Z thanks to the vibrant outdoor culture and entertainment options. The median nonfamily household income in the city has increased from $38,345 to $66,903 in the past decade. While the cost of living has also gone up, Denver remains accessible to young renters. The median rent in Denver currently sits at $2,000/month.
8. Lincoln, NE
Lincoln is another great option for young professionals who are looking for a more affordable place to live. The city shines with the lowest median rent, $1,100 per month, among the top 10 cities on our list, boasting a score of 85.14 in cost of living.
9. Seattle, WA
One of the fastest-growing tech hubs in the U.S., Seattle has attracted many young professionals in the past decade. Around 33% of its population are between the ages of 20 and 34, and combined with a lively scene of entertainment options and dating opportunities, the city ranks #6 in the dating opportunities category. While Seattle currently has a higher than national average unemployment rate, the high-paying tech jobs remain a key driver for young professionals prioritizing careers.
10. Columbus, OH
Rounding out the list is another Midwest city, Columbus. The city stands out as one of the more affordable places for young professionals, with a median rent of $1,360. It’s worth noting that Columbus is a great option for those looking to buy. On average, it takes just 4.21 years for a Columbus family to save up for a down payment, compared to 5.02 years in Cincinnati.
New York Ranks as the Worst City For Single Young Professionals
While New York City remains the largest city in the country by population, it ranks as the worst city for single young professionals. The city scores only 21.71, making it the worst in the cost of living category, as the median rent remains high at $4,000 monthly. This results in many young professionals splitting an apartment with roommates to reduce the overall financial burden. NYC also has a smaller population between 20 and 34 years old among the most populated cities, just 23.4%, compared to 33.82% in Boston.
Los Angeles, the second-largest U.S. city, takes the 81st place in our index this year. While LA is slightly more affordable housing-wise than New York for young professionals looking to rent, it remains one of the most expensive cities. The median rent currently sits at $2,750.
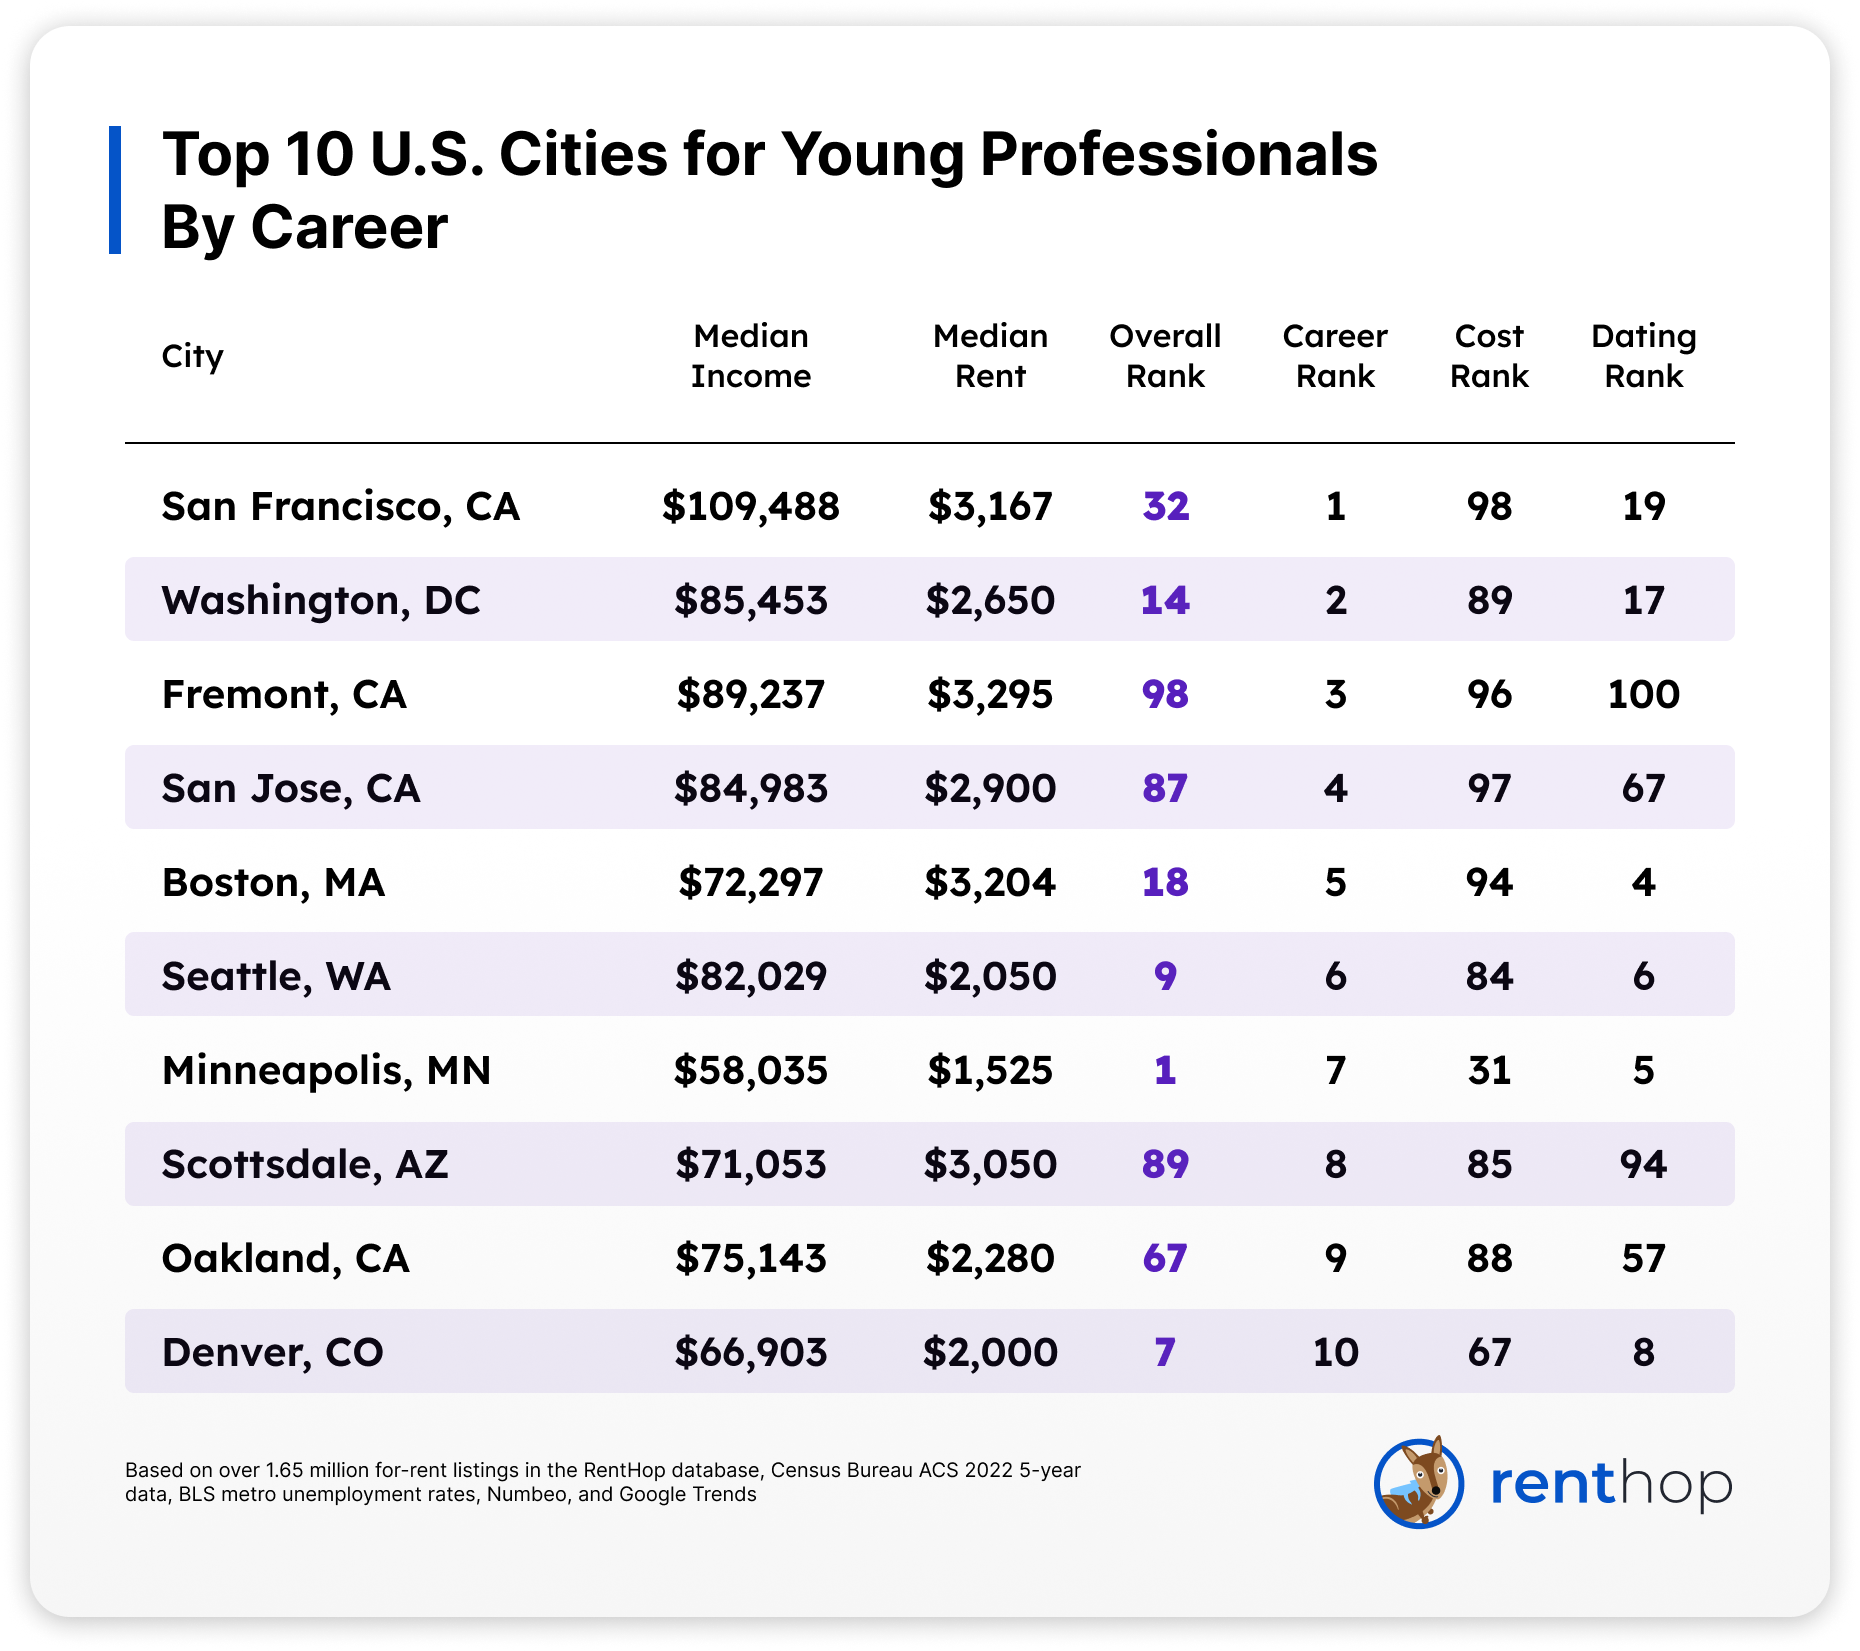
Top 10 Cities by Career Score
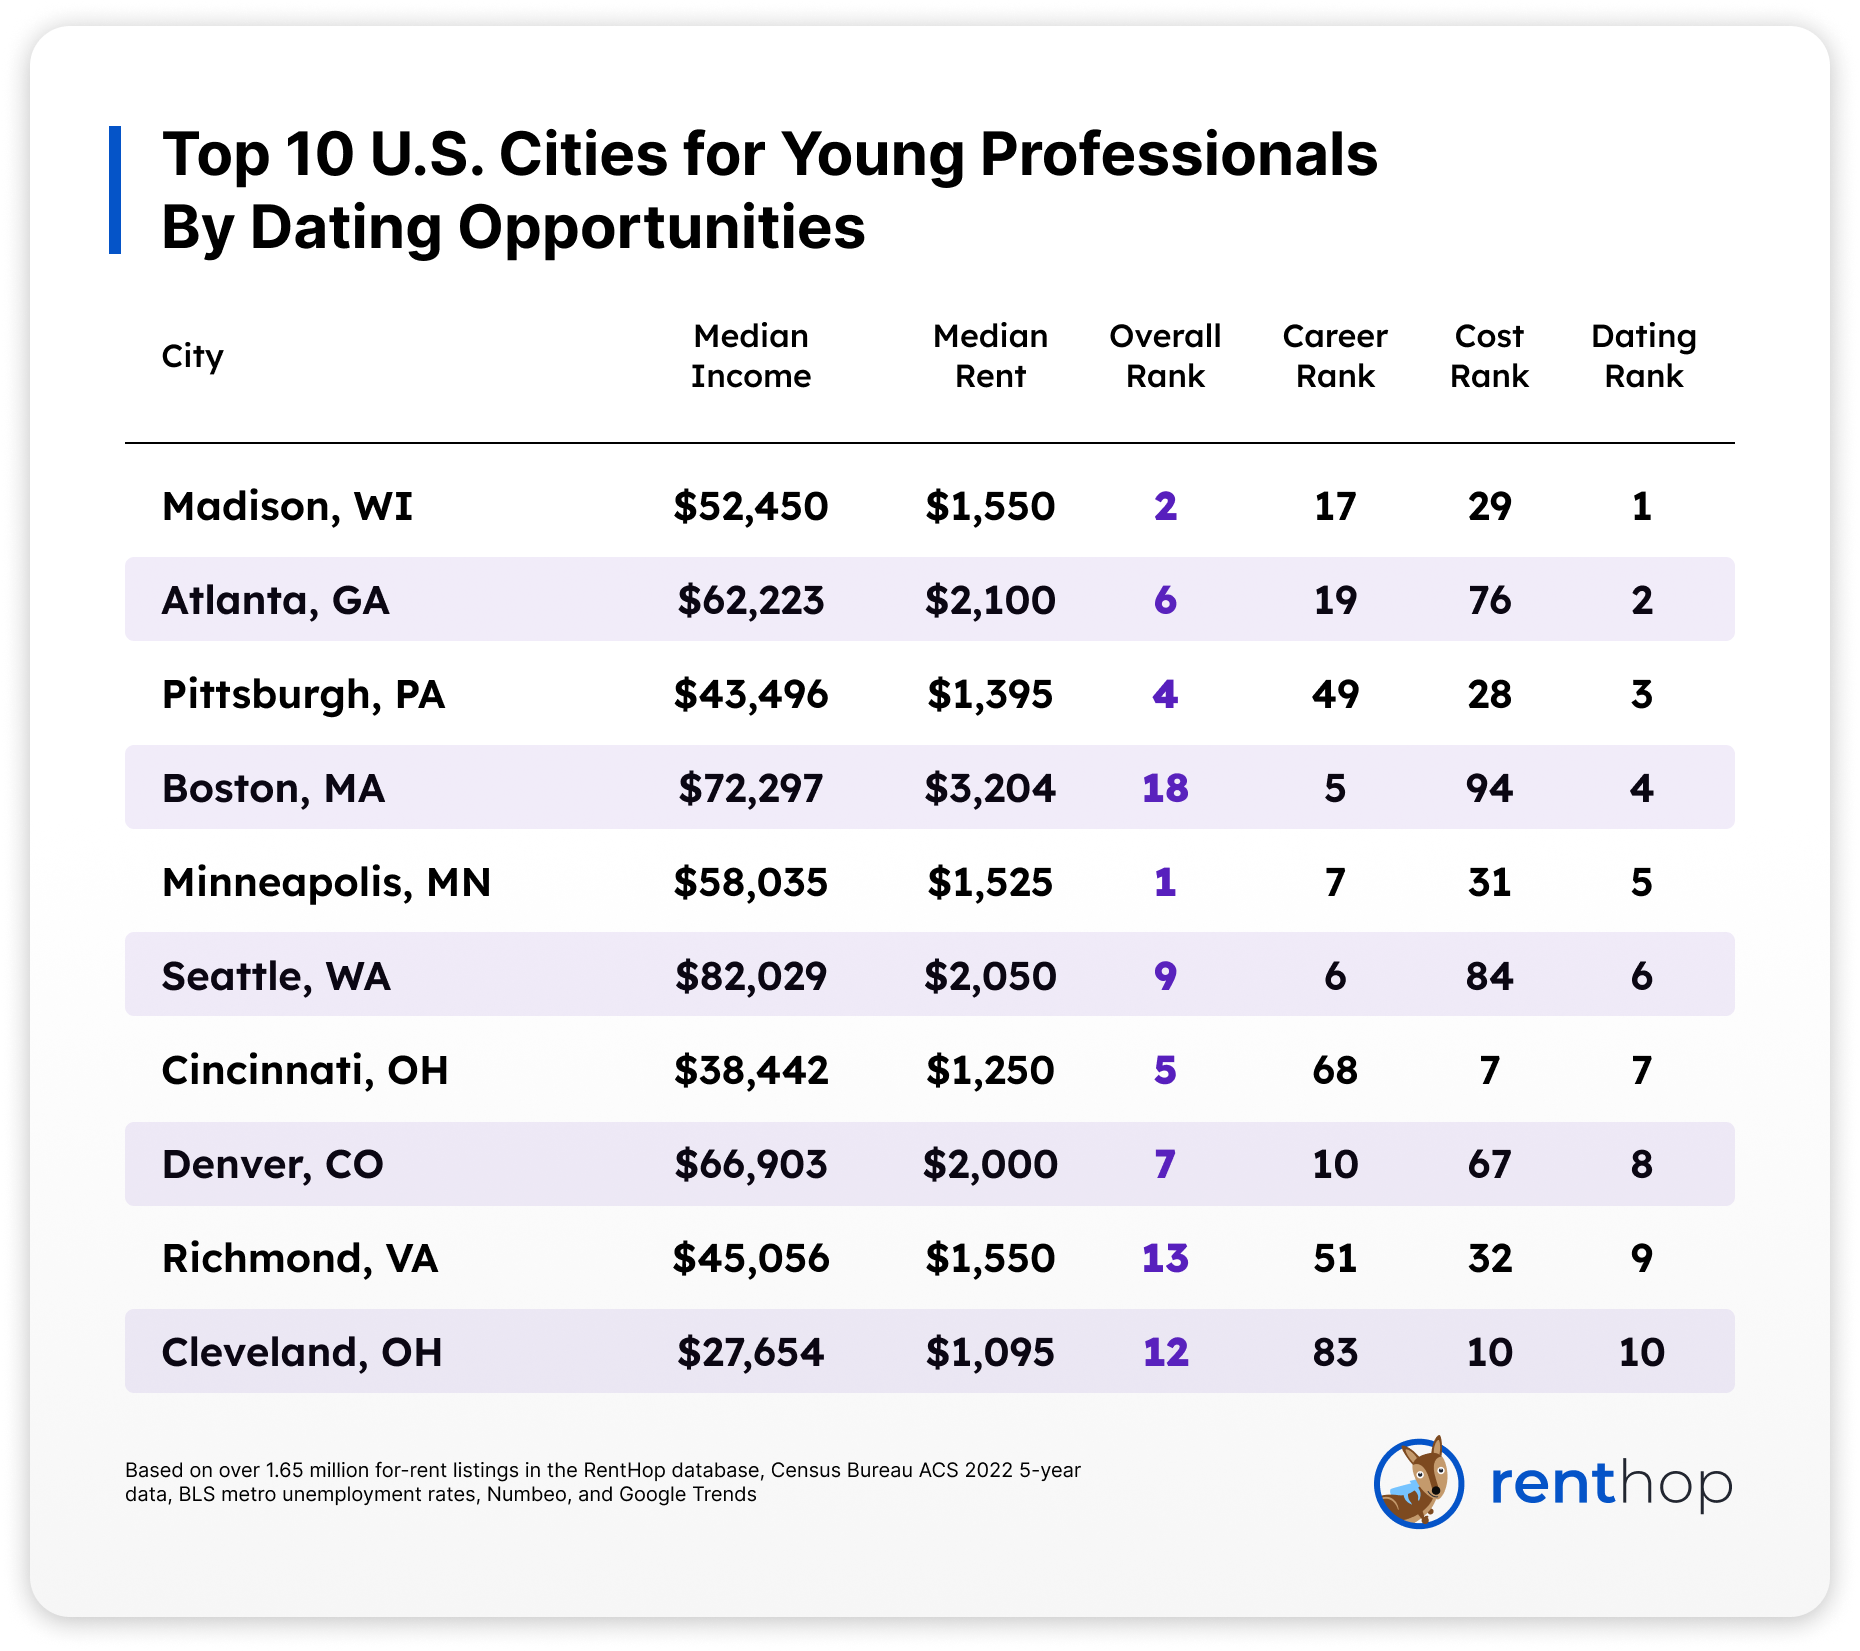
Top 10 Cities by Dating Opportunities
Methodology
To find the best cities for single young professionals, the RentHop team compared the top 100 most populated cities in the U.S. based on (1) career, (2) cost of living, and (3) dating opportunities. The index covers the following metrics:
Career Score (40 points)
- Job opportunities based on the most recent metro unemployment rates released by the BLS (16 points)
- Median Nonfamily Household Income released by the Census Bureau (24 points)
Cost of Living (40 points)
- Median rent, based on over 1.65 million for-rent listings in the RentHop database in the past 180 days (20 points)
- Cost of groceries using Numbeo data (12 points)
- Cost of dining out for two people using Numbeo data (8 points)
Dating Opportunities (20 points)
- Percentage of Population Between 20 and 34 years (8 points)
- Percentage of Single Population (8 points)
- Interest in Dating, measured by Google searches that include dating apps (2 points)
- Access to the Internet (2 points)
For more information, please email press@renthop.com.
Full Data
The post Best Cities for Single Young Professionals appeared first on Real Estate Data & Research.
]]>The post Boise Is the Best Portland Neighborhood for Coffee Lovers appeared first on Real Estate Data & Research.
]]>
Portland is famous for its laid-back lifestyle and a wide range of local coffee shops and roasters. Coffee. For locals and tourists alike, one can easily find a coffee house in Portland and spend the entire day working, reading, and people-watching. Access to good coffee can easily be one of the things people consider when looking for an apartment in Portland. We at RentHop love our morning coffee, too (lunch coffee, afternoon coffee time, anyone?), and to celebrate National Gourmet Coffee Day, we’ve made it our mission to help you find out which Portland neighborhood is best for coffee lovers. Let’s take a look!
The Best Portland Neighborhoods for Renters Who Love Coffee
To find out the best neighborhood for coffee lovers, we collected public data on coffee shops in Portland, including their name, business type, location (in latitude and longitude), and ratings. We then geocoded the coffee shop data using the Neighborhood Boundaries released by Portland OpenData. For renters, just their love for coffee is not enough. At the end of the day, being able to afford the rent is perhaps the most important consideration. Therefore, we calculated the median two-bedroom rent by each neighborhood and incorporated that into our coffee score.
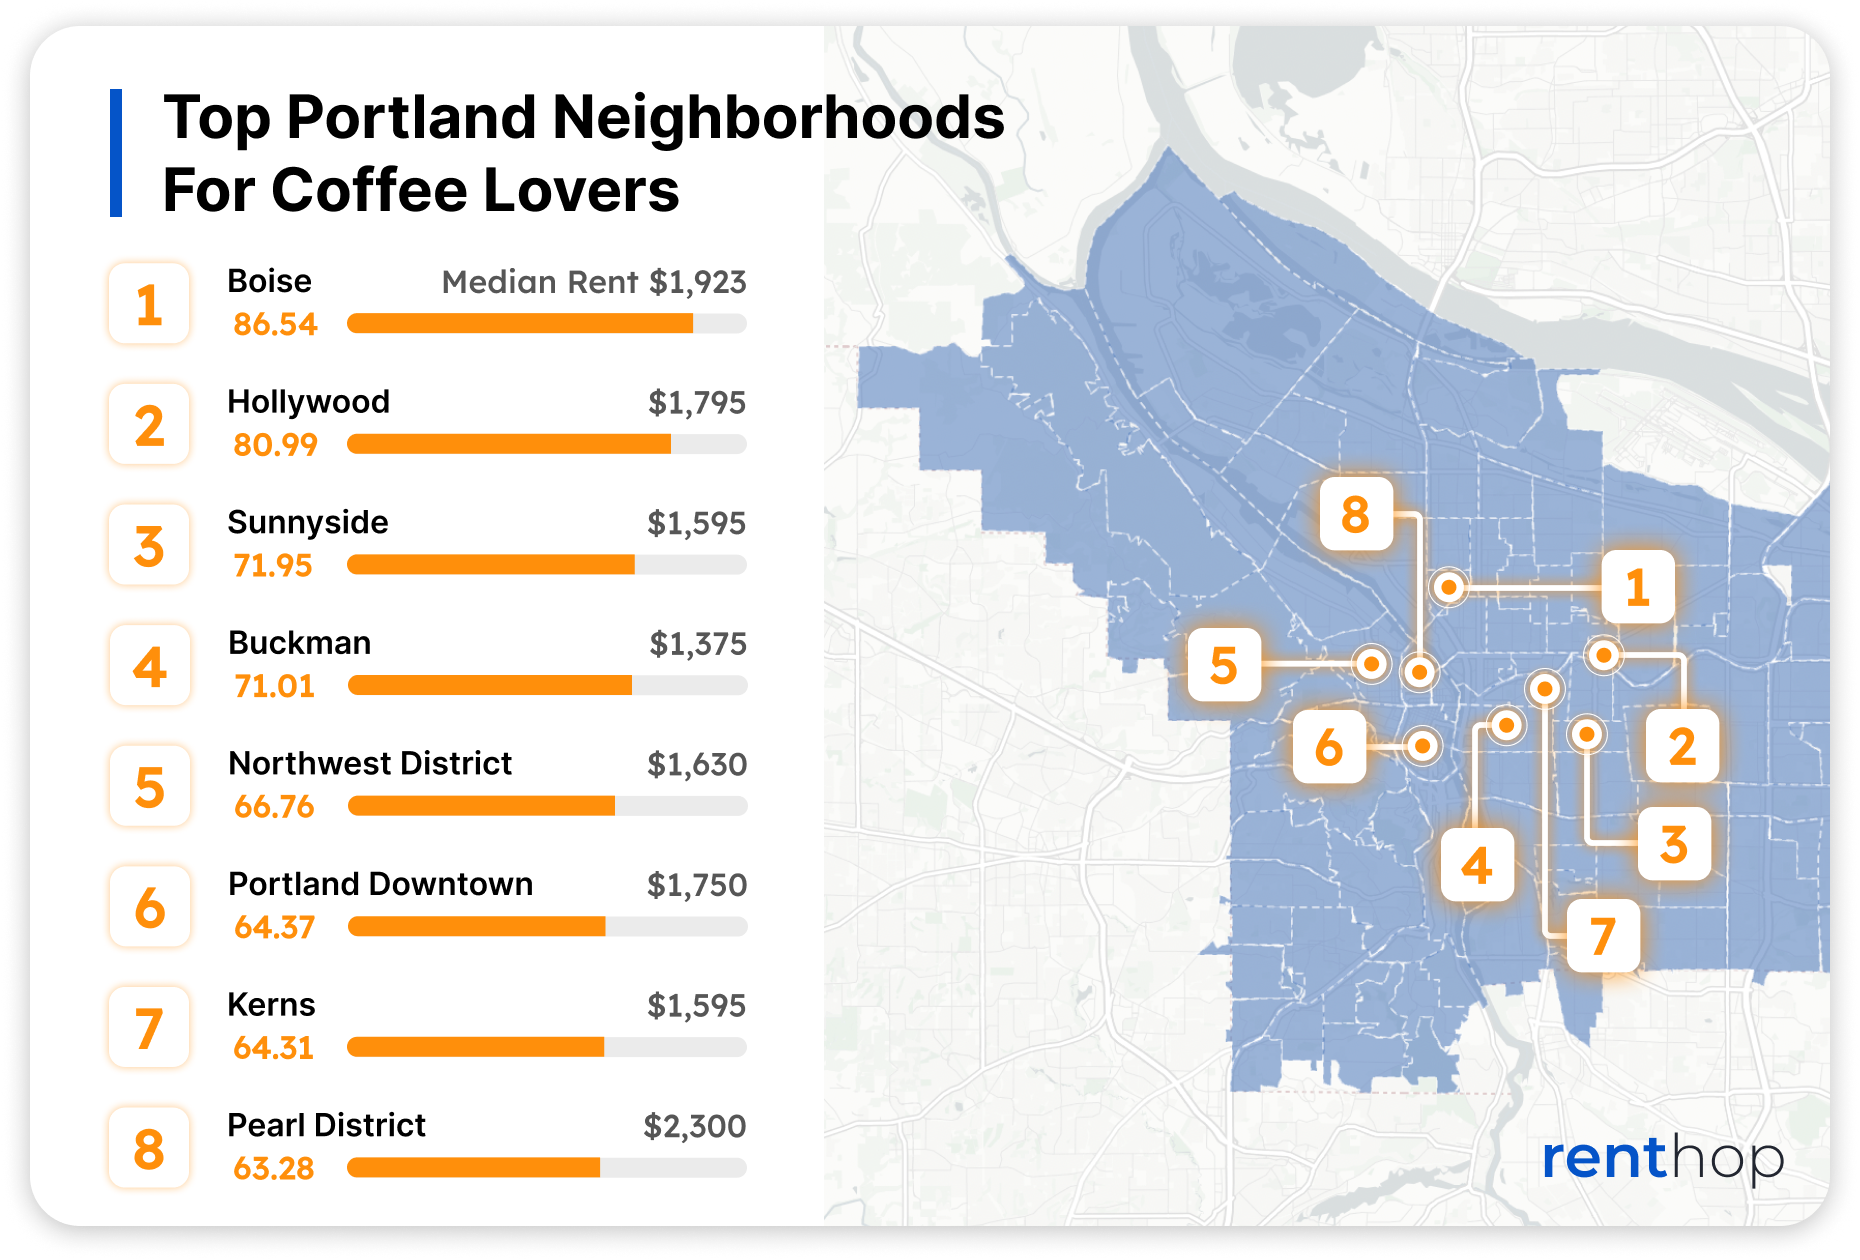
The neighborhoods with the highest density of coffee shops are largely in and surrounding Central Eastside. Topping our list is Boise, scoring an impressive 84.76. The small but vibrant neighborhood is home to a whopping number of coffee shops – 13 by raw count, or 15.99 per square mile, averaging 4.56 out of 5 in ratings.
Hollywood is the second-best coffee neighborhood in Portland, with 13.68 coffee shops per square mile. Coffee lovers benefit from the neighborhood’s relatively affordable rents, with the median rent currently at $1,795, 7.1% lower than Boise. Buckman is another prime area for coffee connoisseurs who are conscious of housing costs, securing the third spot on our list with a total score of 71.01. The area features 7.23 coffee shops per square mile with an average rating of 4.67, and the median rent is just under $1,375.
These Portland Neighborhoods Have the Highest Coffee Scores
- Boise
- Total Score: 86.54
- Coffee Shops per Square Mile: 15.99
- Average Rating: 4.56
- Median Rent: $1,923
- Hollywood
- Total Score: 80.99
- Coffee Shops per Square Mile: 13.68
- Average Rating: 4.48
- Median Rent: $1,795
- Sunnyside
- Total Score: 71.95
- Coffee Shops per Square Mile: 8.22
- Average Rating: 4.72
- Median Rent: $1,595
- Buckman
- Total Score: 71.01
- Coffee Shops per Square Mile: 7.23
- Average Rating: 4.67
- Median Rent: $1,375
- Northwest District
- Total Score: 66.76
- Coffee Shops per Square Mile: 6.79
- Average Rating: 4.62
- Median Rent: $1,630
- Portland Downtown
- Total Score: 64.37
- Coffee Shops per Square Mile: 6.25
- Average Rating: 4.63
- Median Rent: $1,750
- Kerns
- Total Score: 64.31
- Coffee Shops per Square Mile: 5.94
- Average Rating: 4.56
- Median Rent: $1,595
- Pearl District
- Total Score: 63.28
- Coffee Shops per Square Mile: 7.71
- Average Rating: 4.67
- Median Rent: $2,300
- Hosford-Abernethy
- Total Score: 60.92
- Coffee Shops per Square Mile: 3.79
- Average Rating: 4.69
- Median Rent: $1,545
- Humboldt
- Total Score: 60.67
- Coffee Shops per Square Mile: 6.24
- Average Rating: 4.51
- Median Rent: $1,995
These Neighborhoods Have the Most Coffee Shops
- Boise
- Coffee Shops per Square Mile: 15.99
- Average Rating: 4.56
- Median Rent: $1,923
- Hollywood
- Coffee Shops per Square Mile: 13.68
- Average Rating: 4.48
- Median Rent: $1,795
- Sunnyside
- Coffee Shops per Square Mile: 8.22
- Average Rating: 4.72
- Median Rent: $1,595
- Pearl District
- Coffee Shops per Square Mile: 7.71
- Average Rating: 4.67
- Median Rent: $2,300
- Buckman
- Coffee Shops per Square Mile: 7.23
- Average Rating: 4.67
- Median Rent: $1,375
These Neighborhoods Have the Best Coffee Shops, According to the Web
- Creston-Kenilworth
- Average Rating: 4.87
- Coffee Shops per Square Mile: 1.84
- Median Rent: $1,635
- St. Johns
- Average Rating: 4.77
- Coffee Shops per Square Mile: 0.31
- Median Rent: $1,595
- Concordia
- Average Rating: 4.75
- Coffee Shops per Square Mile: 2.96
- Median Rent: $1,995
- Ardenwald-Johnson Creek
- Average Rating: 4.75
- Coffee Shops per Square Mile: 1.1
- Median Rent: $1,595
- Rose City Park
- Average Rating: 4.73
- Coffee Shops per Square Mile: 2.46
- Median Rent: $1,595
Full Data
Methodology
This report ranks Portland neighborhoods by the coffee score, which factors in median rent, the number of coffee shops per square mile, and average coffee shop ratings (highest = 5). The median two-bedroom rent was calculated using two-bedroom rental listings created in the past 90 days, and the coffee shop data was gathered using the Google Places API. We included only the following business types in our analysis: art cafes, coffee shops, cafes, and espresso bars. For the purpose of this report, chain coffee stores with over 500 stores across the nation are removed from the analysis. We first cleaned up the rental and coffee data and then geocoded them using the shapefile released by Portland’s Open Data portal. Only neighborhoods with at least two coffee shops are included in the rankings. For more information, please email press@renthop.com.
The post Boise Is the Best Portland Neighborhood for Coffee Lovers appeared first on Real Estate Data & Research.
]]>The post Pike Place Market, Pioneer Square Rank As the Best Neighborhoods For Coffee Lovers appeared first on Real Estate Data & Research.
]]>
Seattle is often thought to be America’s coffee capital. But within Seattle, do you know which neighborhood is the best for coffee lovers? We at RentHop love our morning coffee, too (lunch coffee, afternoon coffee time, anyone?), and to celebrate National Gourmet Coffee Day, we’ve made it our mission to find the best Seattle neighborhood for renters who love coffee and, of course, low rent. Let’s take a look!
The Best Seattle Neighborhoods for Renters Who Love Coffee
To determine the best Seattle neighborhoods for coffee connoisseurs, the RentHop team gathered extensive data on local coffee shops, including their names, types, locations, and ratings. The median rent in each neighborhood is also factored in to derive a comprehensive “coffee score.”
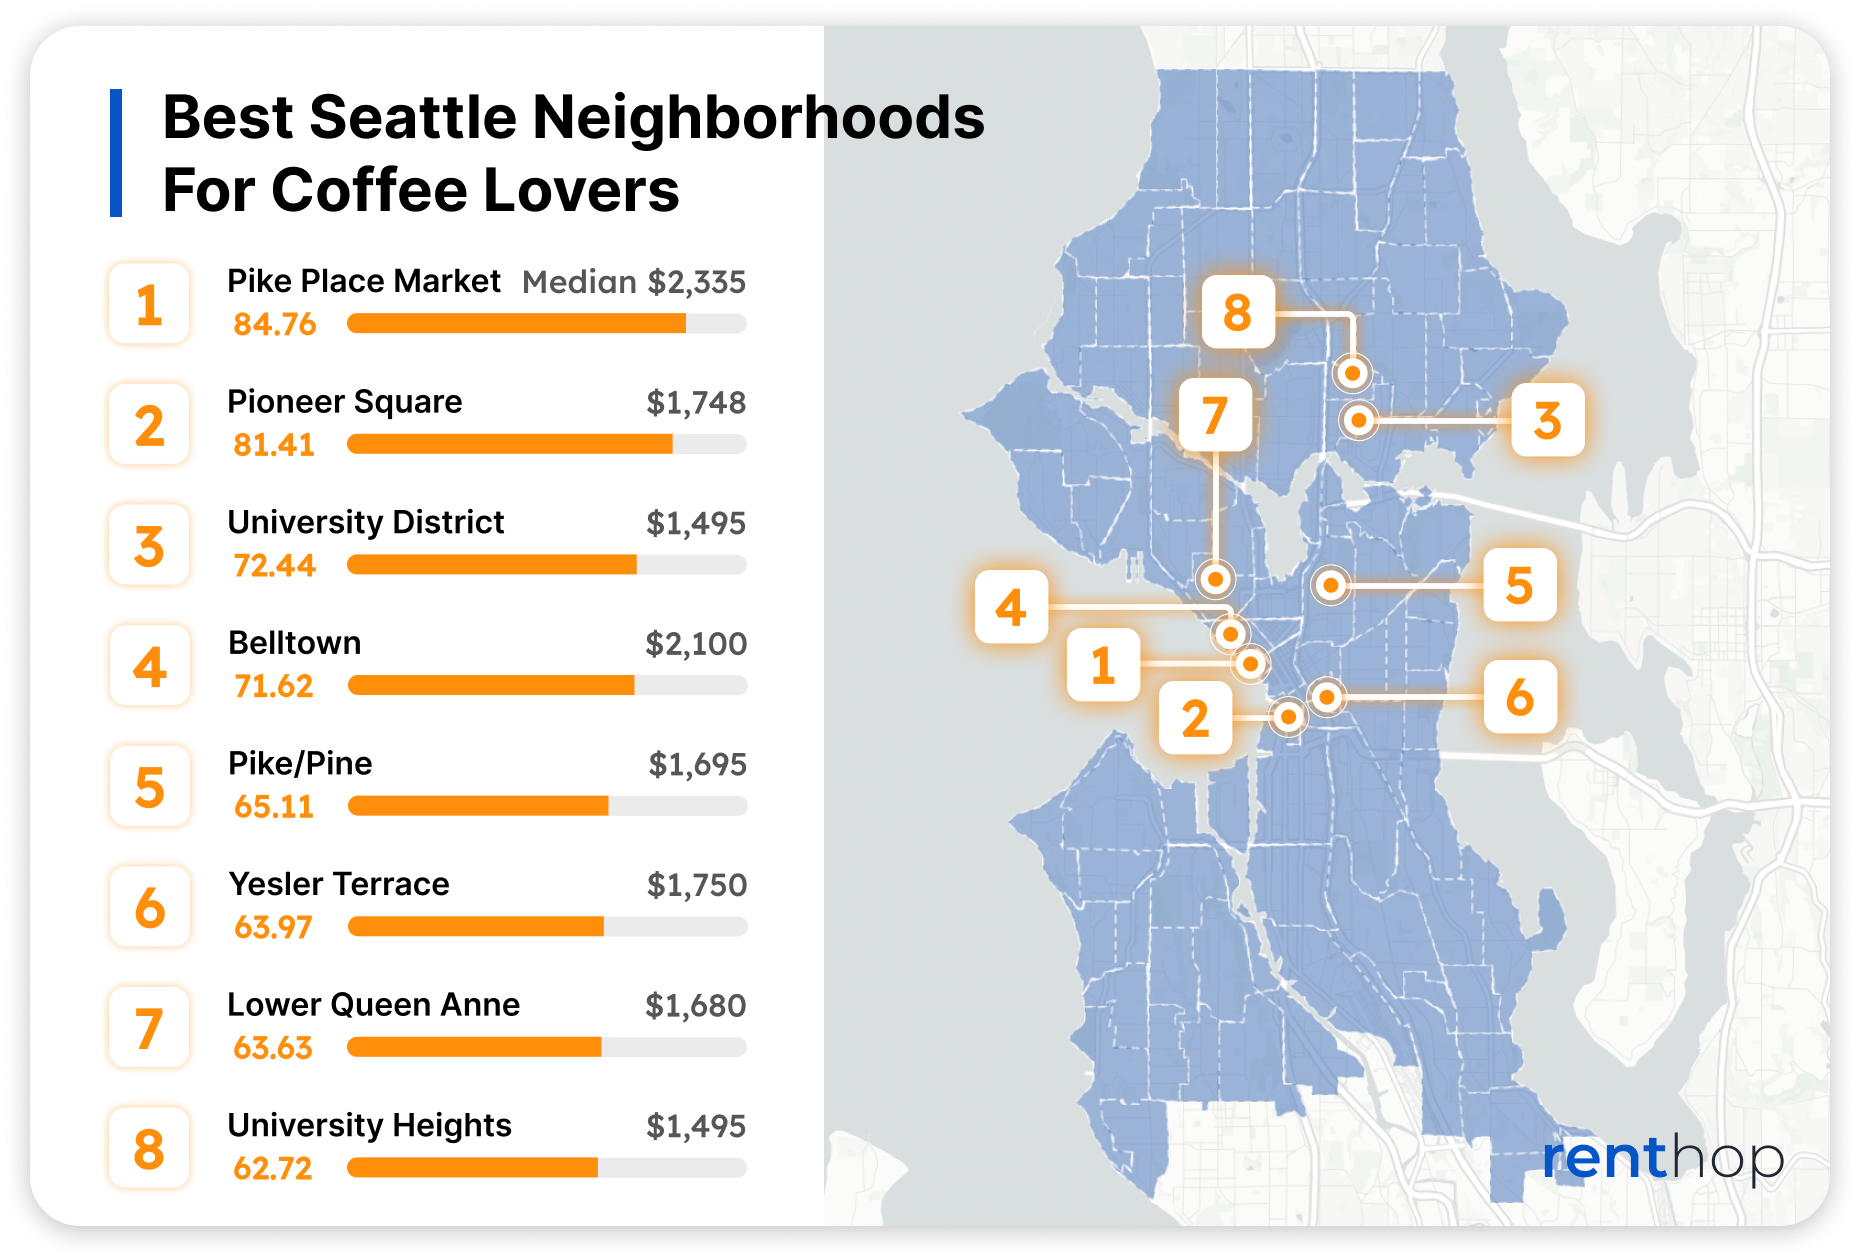
The neighborhoods with the highest density of coffee shops are largely located in the Downtown Area. Topping our list is Pike Place Market, scoring an impressive 84.76. The birthplace of the largest coffee chain in the nation, Pike Place Market, over the years, has cultivated an abundance of coffee culture and shops. The neighborhood has 6.63 coffee shops per square mile, averaging 4.55 in ratings.
Pioneer Square is the second-best coffee neighborhood in Seattle, with 5.15 coffee shops per square mile. Coffee lovers benefit from the neighborhood’s relatively affordable rents, with the median rent currently at $1,748, 33.6% lower than Pike Place Market. University District is another prime area for coffee-loving renters, securing the third spot on our list with a total score of 72.43. The area features 4.92 coffee shops per square mile, and the median rent is just under $1,500.
These Neighborhoods Have the Highest Coffee Scores
- Pike Place Market
- Total Score: 84.76
- Coffee shops per Square Mile: 6.63
- Average Coffee Shop Rating: 4.55
- Median Rent: $2,335
- Pioneer Square
- Total Score: 81.40
- Coffee Shops per Square Mile: 5.15
- Average Coffee Shop Rating: 4.56
- Median Rent: $1,748
- University District
- Total Score: 72.44
- Coffee Shops per Square Mile: 3.60
- Average Coffee Shop Rating: 4.43
- Median Rent: $1,495
- Belltown
- Total Score: 71.62
- Coffee Shops per Square Mile: 4.47
- Average Coffee Shop Rating: 4.39
- Median Rent: $2,100
- Pike/Pine
- Total Score: 65.11
- Coffee Shops per Square Mile: 2.40
- Average Coffee Shop Rating: 4.55
- Median Rent: $1,695
- Yesler Terrace
- Total Score: 63.97
- Coffee Shops per Square Mile: 2.42
- Average Coffee Shop Rating: 4.50
- Median Rent: $1,750
- Lower Queen Anne
- Total Score: 63.63
- Coffee Shops per Square Mile: 2.66
- Average Coffee Shop Rating: 4.33
- Median Rent: $1,680
- University Heights
- Total Score: 62.72
- Coffee Shops per Square Mile: 2.0
- Average Coffee Shop Rating: 4.43
- Median Rent: $1,495
- Roosevelt
- Total Score: 60.09
- Coffee Shops per Square Mile: 1.69
- Average Coffee Shop Rating: 4.67
- Median Rent: $1,950
- Fremont
- Total Score: 59.72
- Coffee Shops per Square Mile: 1.47
- Average Coffee Shop Rating: 4.71
- Median Rent: $1,900
These Neighborhoods Have the Most Coffee Shops
- Pike Place Market
- Coffee shops per Square Mile: 6.63
- Average Coffee Shop Rating: 4.55
- Median Rent: $2,335
- Central Business District
- Coffee shops per Square Mile: 6.01
- Average Coffee Shop Rating: 4.39
- Median Rent: $5,660
- Pioneer Square
- Coffee Shops per Square Mile: 5.15
- Average Coffee Shop Rating: 4.56
- Median Rent: $1,748
- Belltown
- Coffee Shops per Square Mile: 4.47
- Average Coffee Shop Rating: 4.39
- Median Rent: $2,100
- Denny Triangle
- Coffee Shops per Square Mile: 4.04
- Average Coffee Shop Rating: 4.39
- Median Rent: $3,495
These Neighborhoods Have the Best Coffee Shops, According to the Web
- South Beacon Hill
- Average Coffee Shop Rating: 5.0
- Coffee Shops per Square Mile: 0.13
- Median Rent: $2,825
- Licton Springs
- Average Coffee Shop Rating: 4.90
- Coffee Shops per Square Mile: 0.24
- Median Rent: $2,125
- Brighton
- Average Coffee Shop Rating: 4.85
- Coffee Shops per Square Mile: 0.28
- Median Rent: $2,200
- Dunlap
- Average Coffee Shop Rating: 4.80
- Coffee Shops per Square Mile: 0.26
- Median Rent: $2,073
- West Woodland
- Average Coffee Shop Rating: 4.73
- Coffee Shops per Square Mile: 0.70
- Median Rent: $1,923
Full Data
Methodology
This report ranks Seattle neighborhoods by median rent, the number of coffee shops per square mile, and average coffee shop ratings (highest = 5). The median two-bedroom rent was calculated using two-bedroom rental listings created in the past 90 days, and the coffee shop data was gathered using the Google Places API. We included only the following business types in our analysis: art cafes, coffee shops, cafes, and espresso bars. For the purpose of this report, chain coffee stores with over 500 stores across the nation are removed from the analysis. We first cleaned up the rental and coffee data and then geocoded them using the shapefile released by the Seattle Open Data portal. Only neighborhoods with at least two coffee shops are included in the rankings. For more information, please email press@renthop.com.
The post Pike Place Market, Pioneer Square Rank As the Best Neighborhoods For Coffee Lovers appeared first on Real Estate Data & Research.
]]>The post Longwood Is the Best Boston Neighborhood For Coffee Lovers appeared first on Real Estate Data & Research.
]]>
If you’ve ever lived in Boston, you know that “Boston runs on Dunkin,” and it’s not just a funny and memorable marketing campaign by the national chain for the Boston Marathon. There are over 40 Dunkin’ in the City of Boston alone. But there are plenty of local and gourmet options, as well. To celebrate National Gourmet Coffee Day, we at RentHop have made it our mission to help you find out which Boston neighborhood is best for coffee lovers. Let’s take a look!
Longwood, Chinatown, and Downtown Are Great For Renters Who Love Coffee
To find out the best neighborhood for coffee lovers, we collected public data on coffee shops in Boston, including their names, business types, locations (in latitude and longitude), and ratings. We then geocoded the coffee shop data using the official neighborhood boundaries released by Analyze Boston. For renters, just their love for coffee is not enough. At the end of the day, being able to afford the rent is perhaps the most important consideration. Therefore, we calculated the median two-bedroom rent by each neighborhood and incorporated that into our coffee score.
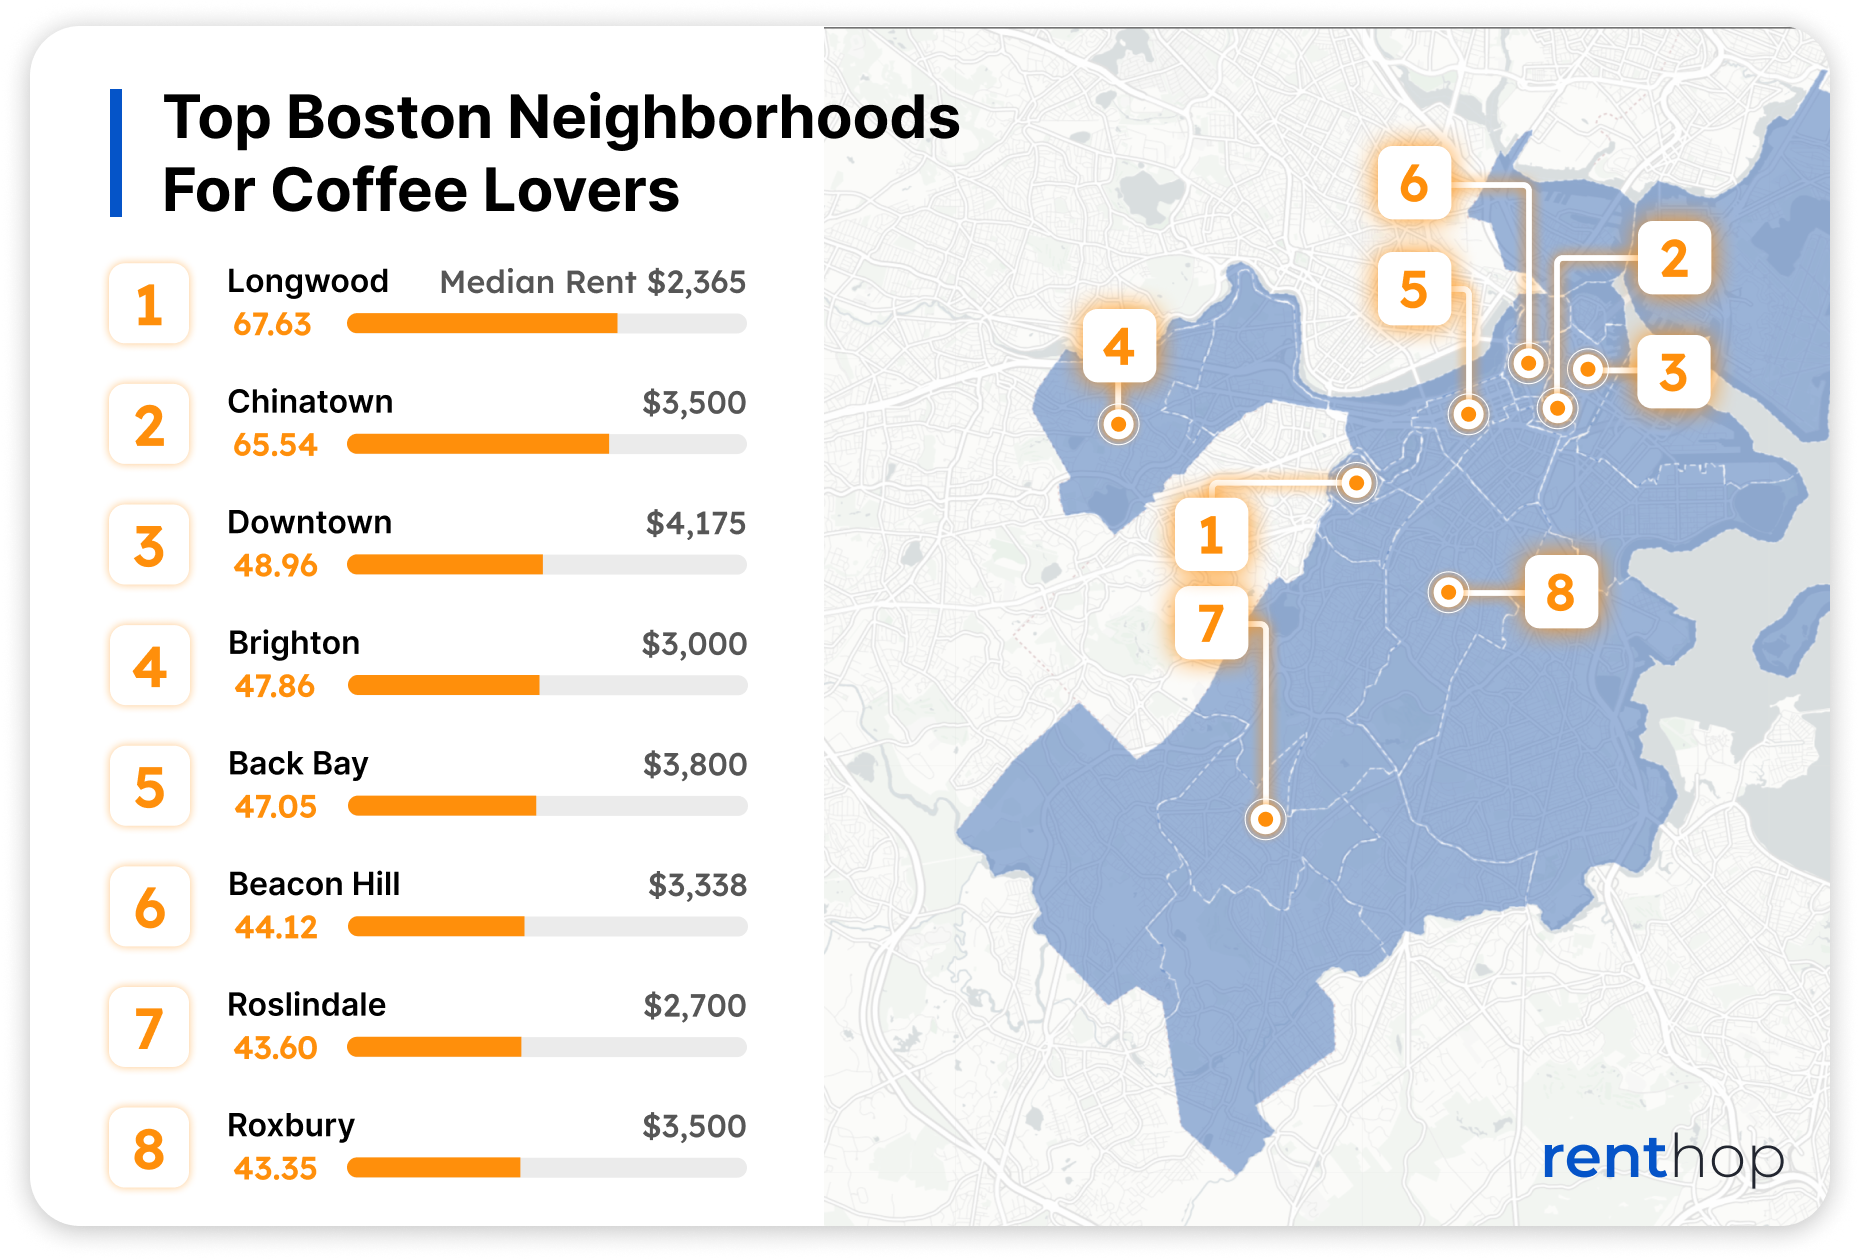
Longwood ranks as the best coffee neighborhood in Boston. The neighborhood has 1.89 coffee shops per square mile with good ratings, averaging 4.48. Despite the low density, it stands out as one of the more affordable neighborhoods for renters. Chinatown outshines all other Boston neighborhoods with an impressive 4.52 coffee shops per square mile. The median rent, however, currently sits at $3,552, making it less attractive for renters who are mindful of not only how their coffee tastes but how much they have to spend on housing each month.
Despite having one of the highest median rents in the city, Downtown ranks as the third best neighborhood for coffee lovers thanks to the density of coffee shops, 3.23/sq mi, and good ratings averaging 4.42. It’s worth noting that by raw count, Downtown has the most number of coffee shops.
Top 10 Boston Neighborhoods for Coffee Lovers
- Longwood
- Total Score: 67.63
- Coffee Shops per Square Mile: 1.89
- Average Rating: 4.48
- Median Rent: $2,495
- Chinatown
- Total Score: 65.54
- Coffee Shops per Square Mile: 4.52
- Average Rating: 4.15
- Median Rent: $3,500
- Downtown
- Total Score: 48.96
- Coffee Shops per Square Mile: 3.24
- Average Rating: 4.42
- Median Rent: $4,175
- Brighton
- Total Score: 47.86
- Coffee Shops per Square Mile: 0.37
- Average Rating: 4.58
- Median Rent: $3,000
- Back Bay
- Total Score: 47.05
- Coffee Shops per Square Mile: 2.52
- Average Rating: 4.33
- Median Rent: $3,800
These Neighborhoods Have the Most Coffee Shops
- Chinatown
- Coffee Shops per Square Mile: 4.52
- Average Rating: 4.15
- Median Rent: $3,500
- Downtown
- Coffee Shops per Square Mile: 3.24
- Average Rating: 4.42
- Median Rent: $4,175
- Back Bay
- Coffee Shops per Square Mile: 2.52
- Average Rating: 4.33
- Median Rent: $3,800
- Longwood
- Coffee Shops per Square Mile: 1.89
- Average Rating: 4.48
- Median Rent: $2,495
- Beacon Hill
- Coffee Shops per Square Mile: 1.31
- Average Rating: 4.32
- Median Rent: $3,338
Chinatown remains the epicenter of coffee culture in Boston, with the highest density of coffee shops. Meanwhile, Beacon Hill rounded up our top five with 1.31 coffee shops per square mile.
These Neighborhoods Have the Best Coffee Shops, According to the Web
- Roxbury
- Average Rating: 4.85
- Coffee Shops per Square Mile: 0.11
- Median Rent: $3,500
- Brighton
- Average Rating: 4.58
- Coffee Shops per Square Mile: 0.37
- Median Rent: $3,000
- South Boston Waterfront
- Average Rating: 4.56
- Coffee Shops per Square Mile: 0.38
- Median Rent: $4,200
- Mission Hill
- Average Rating: 4.55
- Coffee Shops per Square Mile: 0.34
- Median Rent: $4,800
- Longwood
- Average Rating: 4.48
- Coffee Shops per Square Mile: 1.89
- Median Rent: $2,495
Full Data
Methodology
This report ranks Boston neighborhoods by median rent, the number of coffee shops per square mile, and average coffee shop ratings (highest = 5). The median two-bedroom rent was calculated using two-bedroom rental listings created in the past 90 days, and the coffee shop data was gathered using the Google Places API. We included only the following business types in our analysis: art cafes, coffee shops, cafes, and espresso bars. For the purpose of this report, chain coffee stores with over 500 stores across the nation are removed from the analysis. Only neighborhoods with at least two coffee shops are included in the rankings. For more information, please email press@renthop.com.
The post Longwood Is the Best Boston Neighborhood For Coffee Lovers appeared first on Real Estate Data & Research.
]]>The post Bushwick Is the Best NYC Neighborhood For Coffee Lovers appeared first on Real Estate Data & Research.
]]>
For many coffee lovers, a nice cup of coffee really sets the mood for the day, so access to good coffee can easily be one of the things people consider when looking for an apartment. We at RentHop love our morning coffee, too (lunch coffee, afternoon coffee time, anyone?), and to celebrate National Gourmet Coffee Day, we’ve made it our mission to help you find out which neighborhood is best for coffee lovers. Let’s take a look!
The Best NYC Neighborhoods for Renters Who Love Coffee
To find out the best neighborhood for coffee lovers, we collected public data on coffee shops in New York City, including their name, business type, location (in latitude and longitude), and ratings. We then geocoded the coffee shop data using the Neighborhood Tabulation Areas released by NYC OpenData. For renters, just their love for coffee is not enough. At the end of the day, being able to afford the rent is perhaps the most important consideration. Therefore, we calculated the median two-bedroom rent by each neighborhood and incorporated that into our coffee score.
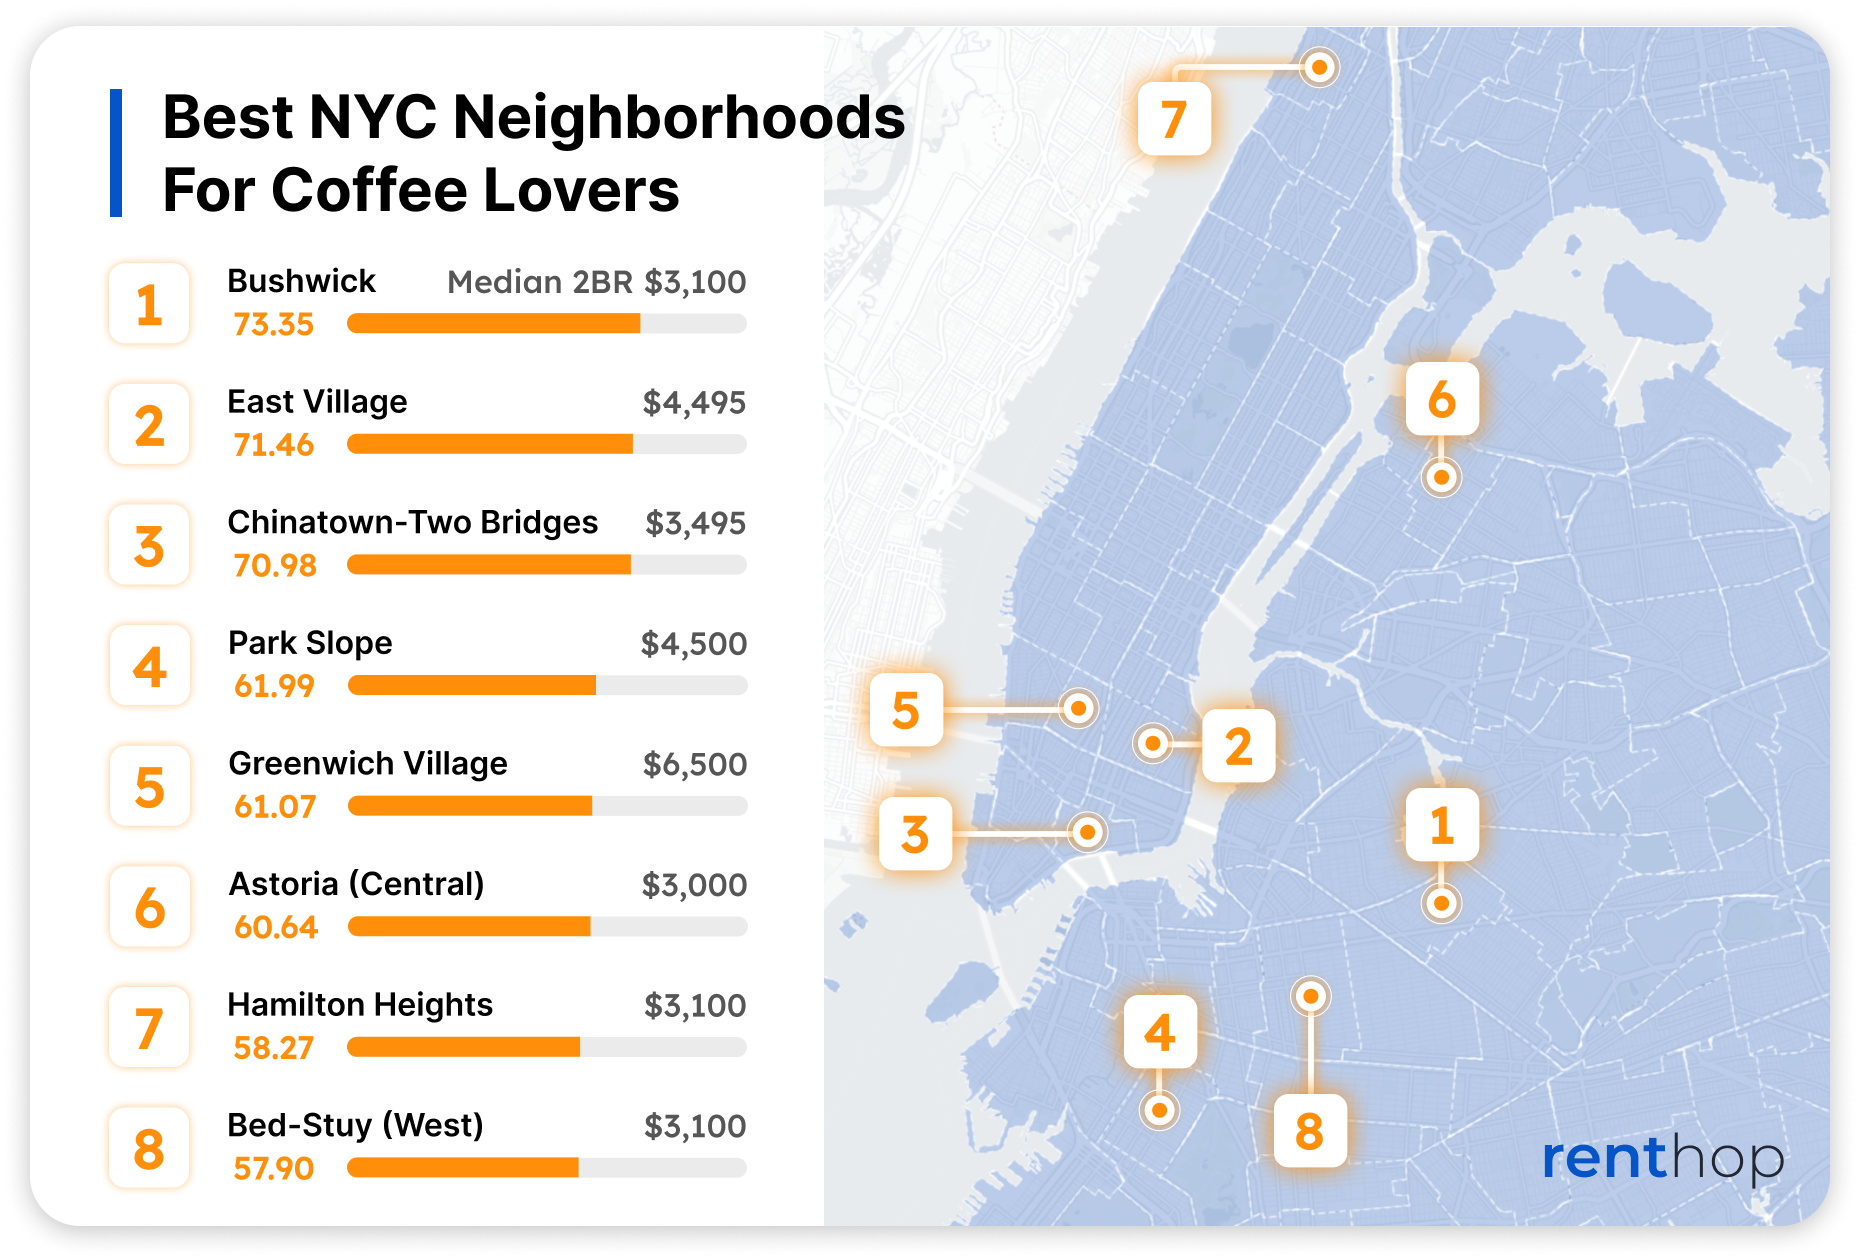
Top on our list is Bushwick (West), the western part of the commonly known neighborhood Bushwick, with a total score of 73.35. The neighborhood aggregates 4.59 coffee shops per square mile, with the median two-bedroom rent currently at $3,100. Western Bushwick has undergone major changes in recent years with multi-family housing developments and commercial corridors. The growth brought in more residents and, therefore, more coffee shops. The Bushwick (West) coffee shops average a rating of 4.65 out of 5 on Google Maps. Meanwhile, we observed a stark difference between the west and east parts of Bushwick. Eastern Bushwick claims the #45 place in our rankings with only 1.11 coffee shops per square mile.
East Village ranks as the second-best NYC neighborhood for renters who love coffee. While the median two-bedroom rent is higher than many outer-borough neighborhoods, at $4,495 per month, East Village has 6 coffee shops per square mile, the second most in Manhattan behind Greenwich Village. The average rating of coffee shops here is 4.54.
Neighborhoods with the Highest Coffee Scores
- Bushwick (West)
- Total Score: 73.35
- Coffee Shops Per Square Mile: 4.59
- Average Rating: 4.65
- Median 2BR Rent: $3,100
- East Village
- Total Score: 71.46
- Coffee Shops Per Square Mile: 6
- Average Rating: 4.54
- Median 2BR Rent: $4,495
- Chinatown-Two Bridges
- Total Score: 70.98
- Coffee Shops Per Square Mile: 4.94
- Average Rating: 4.5
- Median 2BR Rent: $3,495
- Park Slope
- Total Score: 61.11
- Coffee Shops Per Square Mile: 4.11
- Average Rating: 4.6
- Median 2BR Rent: $4,500
- Greenwich Village
- Total Score: 61.07
- Coffee Shops Per Square Mile: 6.84
- Average Rating: 4.32
- Median 2BR Rent: $6,500
- Astoria (Central)
- Total Score: 60.64
- Coffee Shops Per Square Mile: 2.33
- Average Rating: 4.65
- Median 2BR Rent: $3,000
- Hamilton Heights-Sugar Hill
- Total Score: 58.27
- Coffee Shops Per Square Mile: 1.94
- Average Rating: 4.62
- Median 2BR Rent: $2,950
- Bedford-Stuyvesant (West)
- Total Score: 57.9
- Coffee Shops Per Square Mile: 2.46
- Average Rating: 4.5
- Median 2BR Rent: $3,250
- Bensonhurst
- Total Score: 57.55
- Coffee Shops Per Square Mile: 1.38
- Average Rating: 4.47
- Median 2BR Rent: $2,250
- Sunset Park (East)-Borough Park (West)
- Total Score: 56.85
- Coffee Shops Per Square Mile: 1.98
- Average Rating: 4.41
- Median 2BR Rent: $2,800
These Neighborhoods Have the Most Coffee Shops
- Greenwich Village
- Coffee Shops Per Square Mile: 6.84
- Average Rating: 4.32
- Median 2BR Rent: $6,500
- East Village
- Coffee Shops Per Square Mile: 6
- Average Rating: 4.54
- Median 2BR Rent: $4,495
- Midtown-Times Square
- Coffee Shops Per Square Mile: 5.38
- Average Rating: 4.34
- Median 2BR Rent: $6,595
- SoHo-Little Italy-Hudson Square
- Coffee Shops Per Square Mile: 5.21
- Average Rating: 4.45
- Median 2BR Rent: $6,150
- Midtown South-Flatiron-Union Square
- Coffee Shops Per Square Mile: 5.05
- Average Rating: 4.35
- Median 2BR Rent: $8,000
These Neighborhoods Have the Best Coffee Shops, According to the Web
- Wakefield-Woodlawn
- Average Rating: 4.73
- Coffee Shops Per Square Mile: 0.2
- Median 2BR Rent: $2,400
- Whitestone-Beechhurst
- Average Rating: 4.73
- Coffee Shops Per Square Mile: 0.34
- Median 2BR Rent: $2,400
- Brighton Beach
- Average Rating: 4.72
- Coffee Shops Per Square Mile: 0.95
- Median 2BR Rent: $2,650
- Soundview-Bruckner-Bronx River
- Average Rating: 4.7
- Coffee Shops Per Square Mile: 0.24
- Median 2BR Rent: $2,400
- Sunset Park (West)
- Average Rating: 4.68
- Coffee Shops Per Square Mile: 1.13
- Median 2BR Rent: $3,400
Full Data
Methodology
This report ranks NYC neighborhoods by median rent, the number of coffee shops per square mile, and average coffee shop ratings (highest = 5). The median two-bedroom rent was calculated using two-bedroom rental listings created in the past 90 days, and neighborhoods without any rental listings are excluded from this report. The coffee shop data was gathered using the Google Places API. We included only the following business types in our analysis: art cafes, coffee shops, cafes, and espresso bars. For the purpose of this report, chain coffee stores with over 500 stores across the nation are removed from the analysis. We first cleaned up the rental and coffee data and then geocoded them using the NYC Neighborhood Tabulation Areas, which is publicly available via NYC OpenData. Only neighborhoods with at least two coffee shops are in the rankings. For more information, please email press@renthop.com.
The post Bushwick Is the Best NYC Neighborhood For Coffee Lovers appeared first on Real Estate Data & Research.
]]>The post Single Women Spend 124% More of Their Income on Rent Than Men in Major Cities in the U.S. appeared first on Real Estate Data & Research.
]]>Each year, RentHop updates the Singles Index to calculate the housing burden – the percentage of income a single renter has to allocate each month to rent a studio home – in the largest cities in the country. In our third annual edition, we further broke down the data this year to understand single renters’ struggles. Using the median nonfamily income and nonfamily household income by sex data released by the U.S. Census Bureau, we found that:
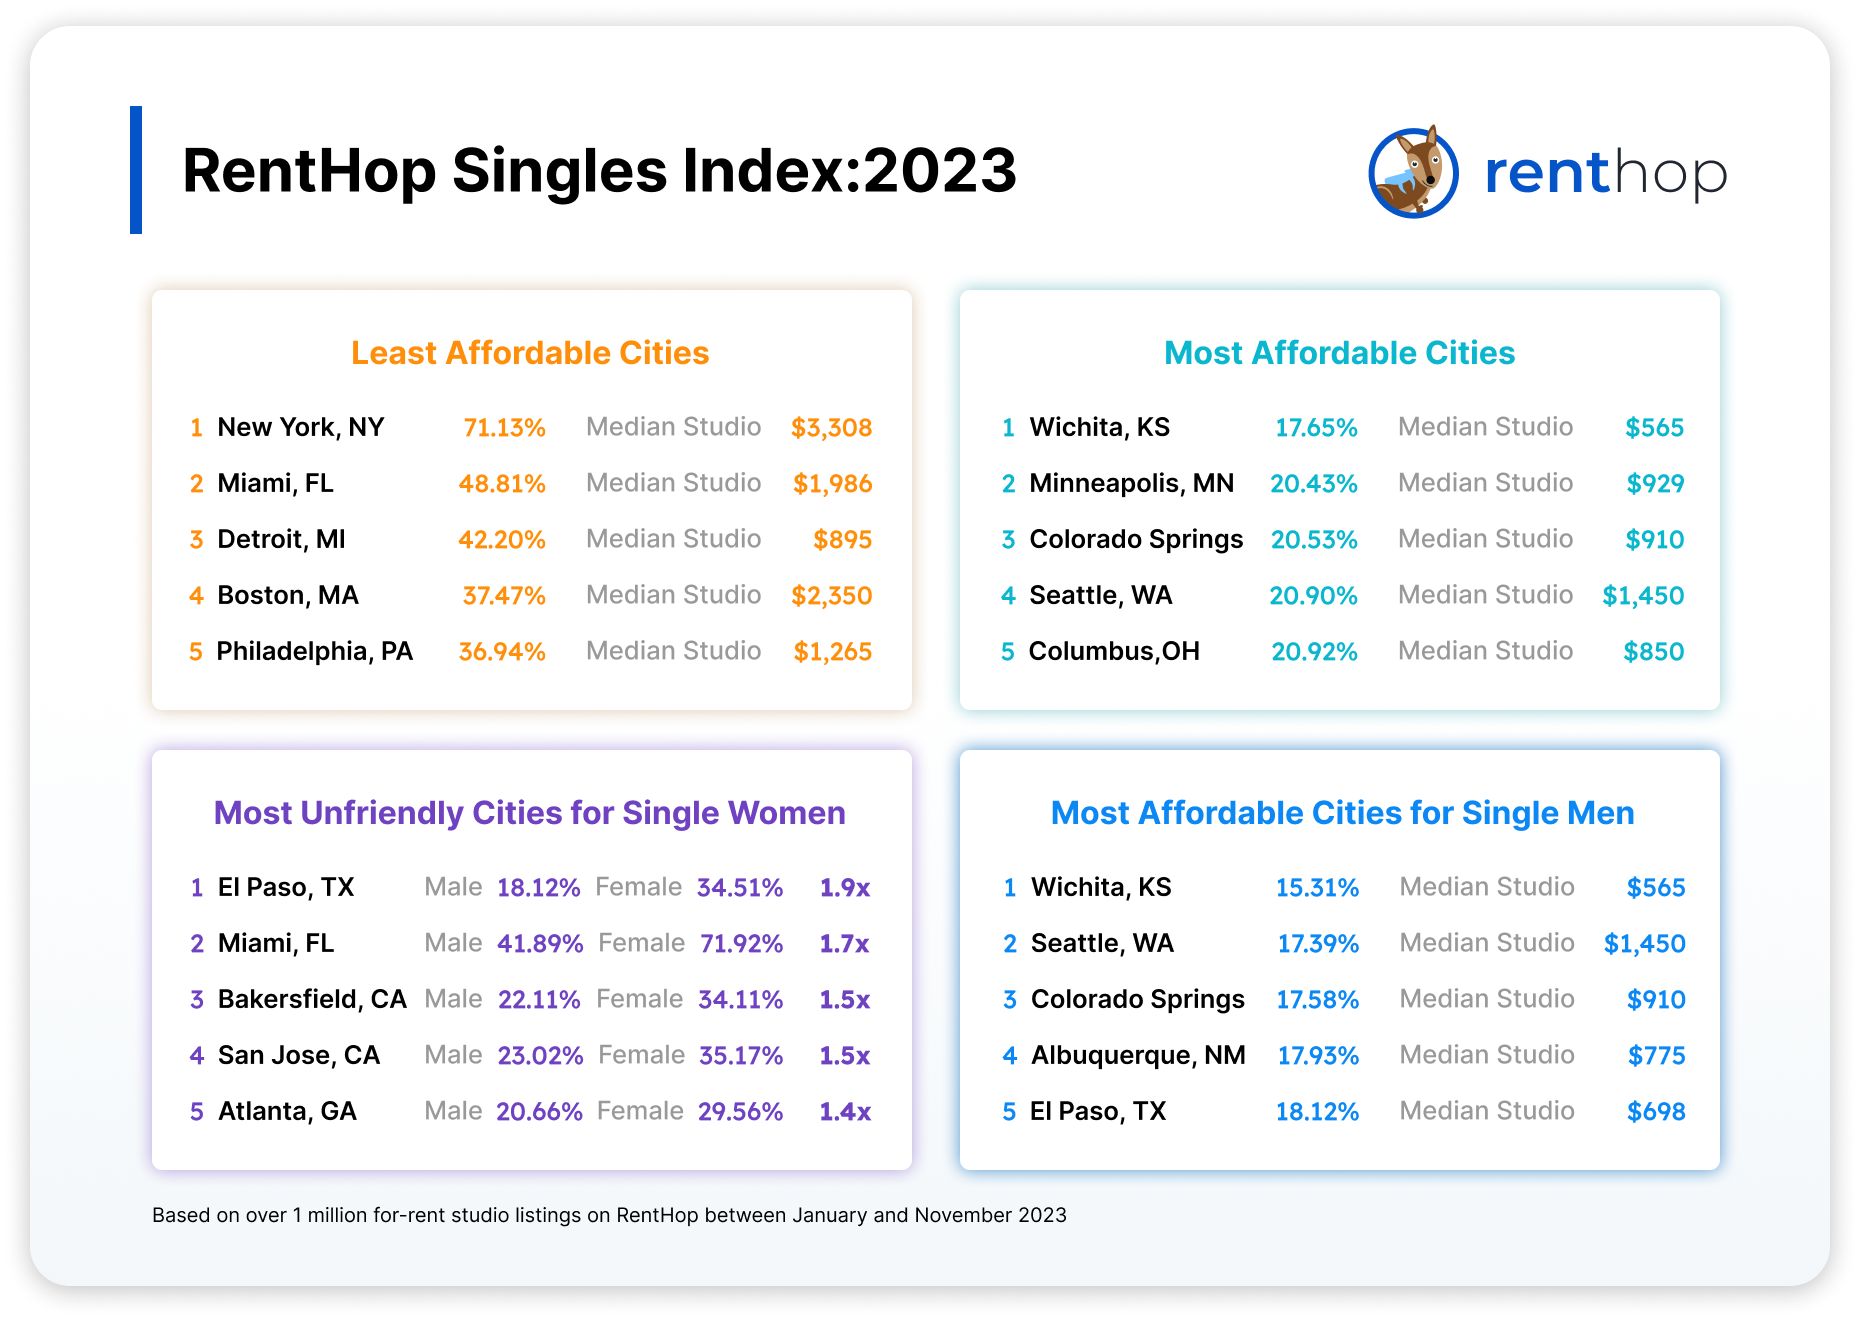
- New York, NY is the least affordable city for single renters. A single renter would have to spend 71.13% of their income on a studio unit.
- New York is also the least affordable city when breaking down the data by sex. Female renters must allocate 79.42% of their annual income vs. 60.99% for single men.
- Meanwhile, Wichita, KS is the most affordable city. With a median studio rent of $565 per month, a single renter only needs to spend 17.65% of their income on rent.
- Single female renters in El Paso, TX would have to spend 1.9 times more of their income to live alone than men. For male renters, the monthly burden is 18.12%, whereas for women, it is 34.51% of their income.
- Arlington, TX is the only city where single women would spend a smaller portion of their annual income on a studio apartment than men. Rent cost as % of Singles Income comes out to be 28.18% for women vs. 28.28% for men.
- While California has some of the smallest gender wage gaps in the country, San Jose has the fourth-highest housing cost gap among all the cities. Single female renters would have to spend 35.17% of their annual income on a studio home, whereas single men would only need to spend 23.02%.
Least Affordable Cities for Singles
1. New York, NY
It is no surprise to those living in New York City that studios are unaffordable for most. The median studio rent in the past year has risen over 9%, reaching $3,308 monthly. Based on a median nonfamily household income of $55,810, a single renter looking to rent a studio would have to spend 71.13% of their income on rent. However, a single renter can reduce their monthly burden by over $600 by having a roommate.
2. Miami, FL
Despite the median studio rent being 4.06% cheaper than last year, Miami remains the second most unaffordable city for single renters. Given the median nonfamily income of $48,826 and $1,986 for a studio, a single person would need to spend 48.81% of their annual income on rent alone.
3. Detroit, MI
Detroit is the third most unaffordable city for singles in the country. While housing costs are relatively low in the city compared to other major cities, the below-average income makes renting a studio challenging for most. With a median studio rent of $895 a month and a median nonfamily income of $25,449, singles in Detroit are required to spend 42.20% of their income to live alone.
4. Boston, MA
Boston is filled with high-income job opportunities, and it has one of the highest median nonfamily incomes, $75,252, in the nation. Even so, the city continues to grapple with expensive housing costs. With a median studio rent of $2,049, singles would have to spend 37.47% of their annual income on housing, meaning it is still unaffordable for renters to rent a studio apartment.
5. Philadelphia, PA
Philly is the fifth least affordable city for singles in America, with rent commanding 36.94% of an average single person’s annual income. On the bright side, studio homes in Philadelphia only saw a slight 1.16% increase in median rent in the past year, currently at $1,264.50.
Most Affordable Cities for Singles
1. Wichita, KS
Wichita is the most affordable U.S. city for singles. The city has the lowest median studio rent, $565 per month, among all 50 cities included in the index. With a median nonfamily income of $38,412, a single renter can expect to spend just 17.65% of their annual income on rent.
2. Minneapolis, MN
Thanks to relatively high nonfamily income and cheap housing, Minneapolis ranks as the second most affordable city for single renters. Given a median studio rent of less than $1,000 each month, singles can expect to allocate a reasonable 20.43% of their annual income toward housing costs. It is worth noting that Minneapolis is the second most friendly city for single female renters.
3. Colorado Springs, CO
Compared to the high housing costs in Denver, studio homes in Colorado Springs are much more affordable for renters, with a median of $910 monthly. Based on a median nonfamily income of $53,185, single renters can expect to spend 20.53% on renting a studio, taking the place on our affordability list.
4. Seattle, WA
Seattle is the fourth most affordable city in the country for singles. Strong income levels boost the average single renter’s ability to live alone despite expensive housing costs. Given a median nonfamily income of $83,237 and a median studio rent of $1,450, singles would only need to spend 20.90% of their income per year on renting a studio. It is the only city among the most affordable markets with a median studio rent exceeding $1K per month.
5. Columbus, OH
Columbus closes out our 2023 rankings as the fifth most affordable city for singles. Median studio rent rose only 0.12% year-over-year. With a median nonfamily income of $48,759, an average single renter in Columbus would only need to spend 20.92% of their annual income on a studio home. Meanwhile, the city ranks as the third most affordable market for single women.
Housing Burden Among Singles, Broken Down by Sex
Many single renters feel the effects of strenuous economic conditions when considering the gender wage gap. According to Pew Research, the gap barely narrowed in 2022 – for every dollar men earned, women earned only 82 cents. Translating to housing, the gap means it is harder for women to buy or even rent a home independently.
Our analysis indicates that across the top 50 U.S. cities, single women, on average, would have to spend 1.24 times more of their annual income on renting a studio than their male counterparts. Given the high rental prices and relatively low single income, New York City, Detroit, Miami, and Boston remain the top four unaffordable cities for single men and women. We see a different story, however, when ranking the cities by the housing burden gap.
El Paso is the Most Unfriendly City for Single Female Renters
The list below highlights the 10 U.S. cities with the worst housing burden gap among single renters. In El Paso, TX, single women would have to spend 34.51% of their income on housing if they wished to rent a studio home and live alone, over the commonly known 30% standard for housing affordability. Meanwhile, single men would only need to spend 18.12% of their income to do so.
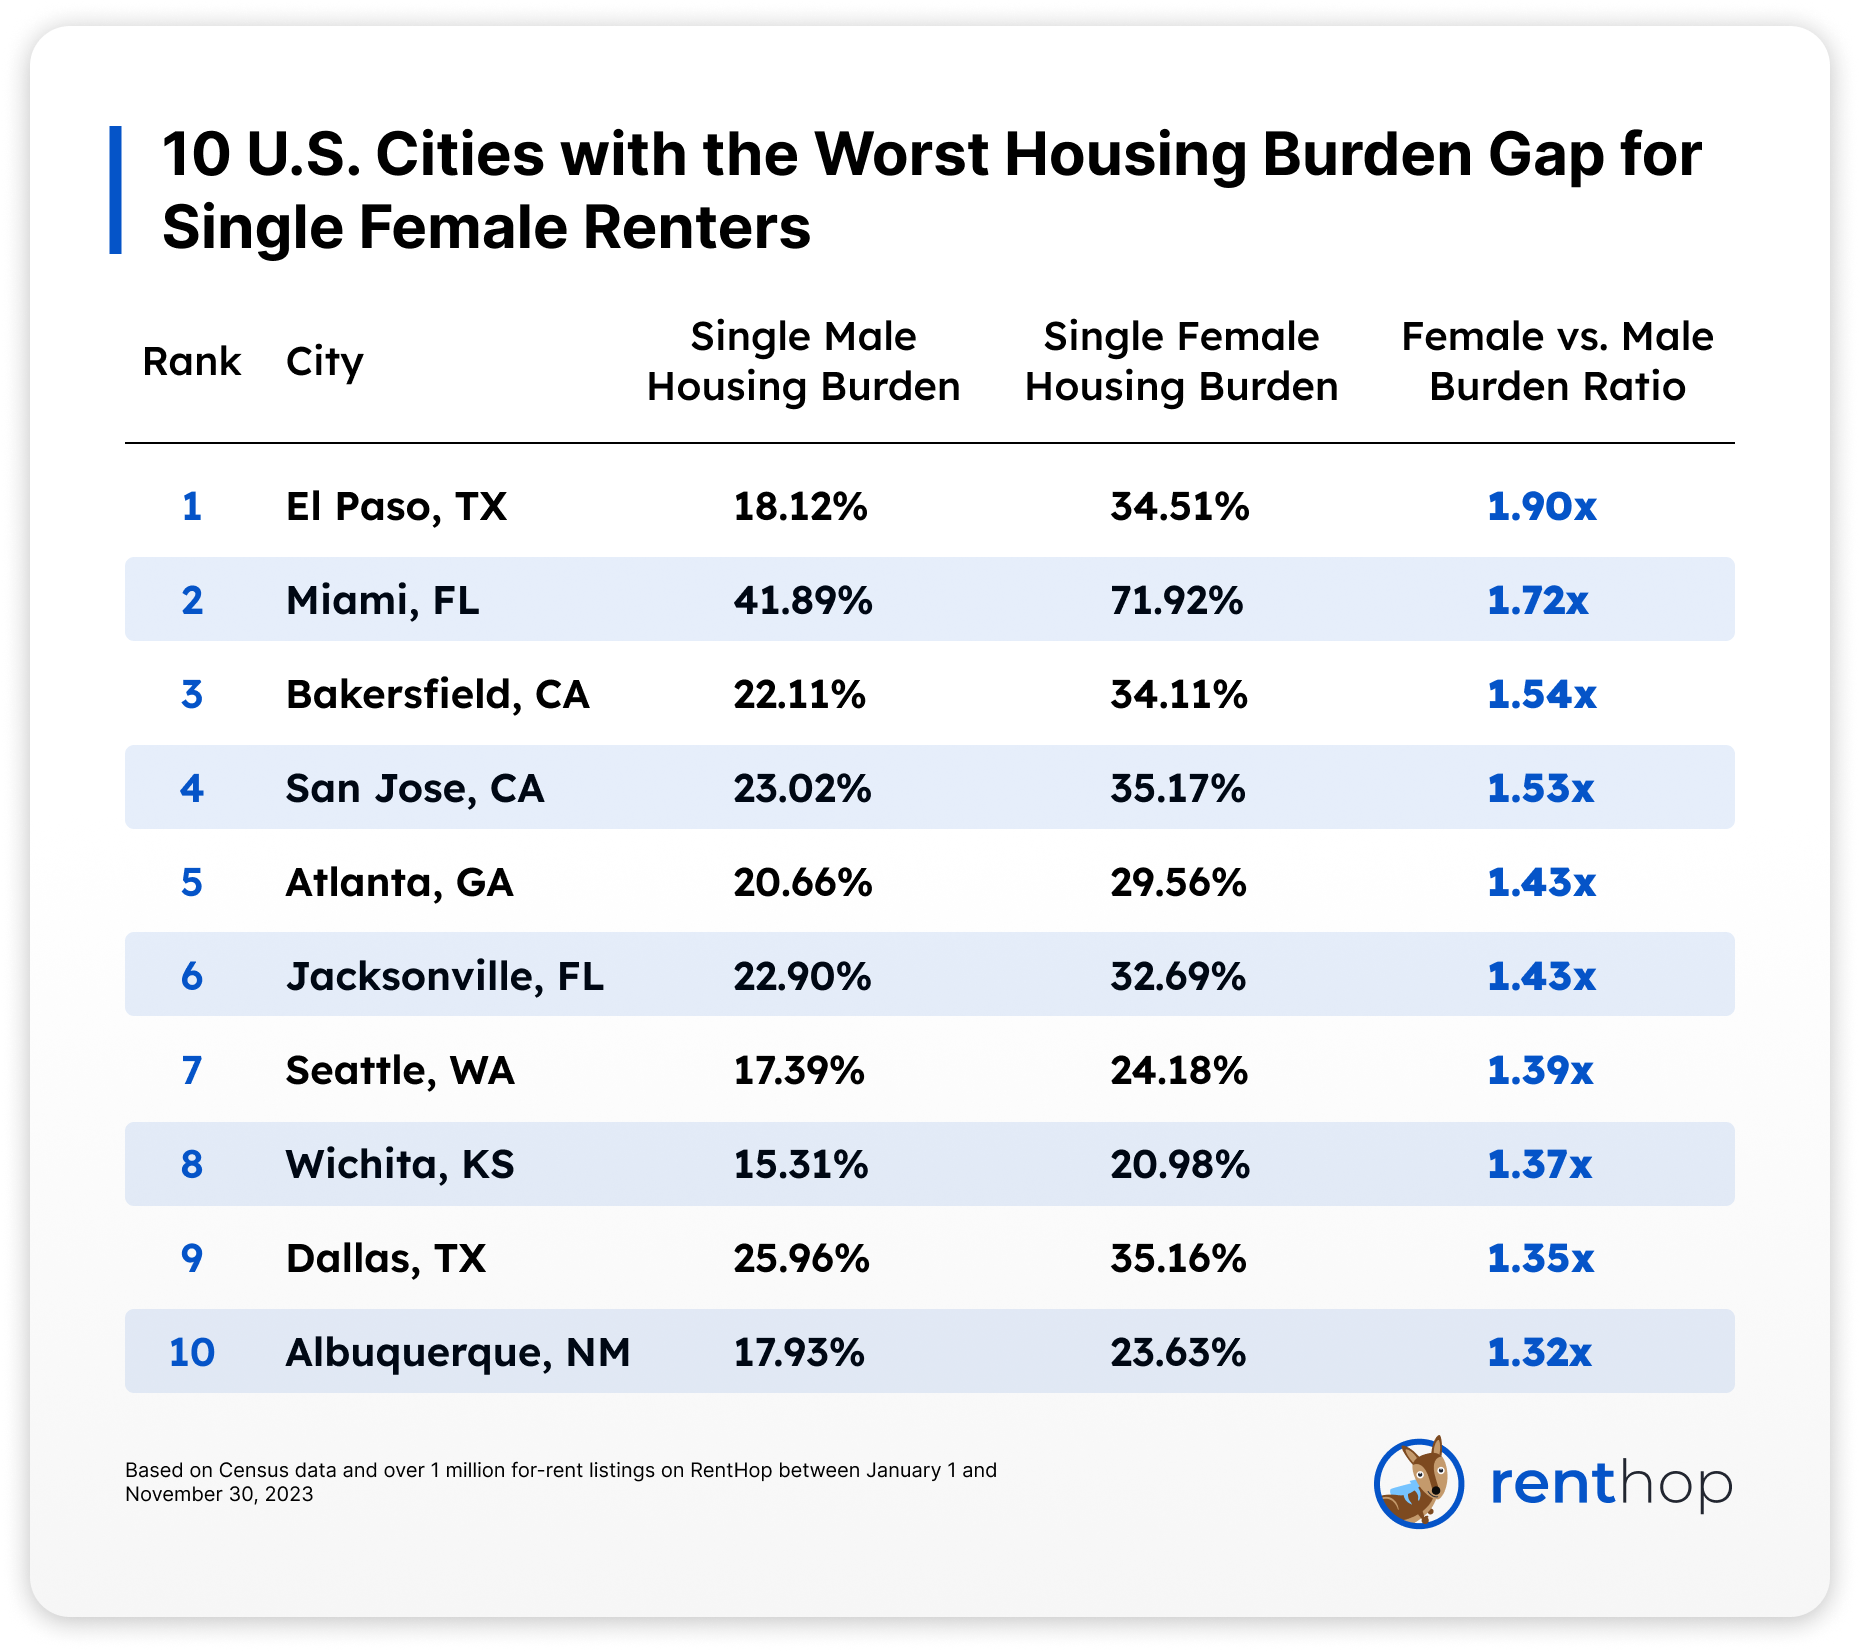
While California has a smaller gender pay gap at the state level compared to many other states, two of its cities, San Jose and Bakersfield, are ranked as some of the most unfriendly cities for single women to rent a studio in. In San Jose, the median studio rent is $2,049. This means that a single female renter making the median nonfamily household income of $69,915 would have to spend 35.17% of their annual income on rent. Single men, on the other hand, would spend only 23.02% of their income on a studio home with a median income of $106,818.
Indeed, studio homes are cheaper to rent in Bakersfield, but single women tend to make much less than in many other California cities, making it challenging for them to live alone. The housing burden for single females is 34.11%, whereas for single men, it is 22.11%, way below the housing affordability standard.
Methodology
The RentHop Singles Index analyzes both proprietary and ACS Census data to provide a snapshot of housing affordability for single-income households across the 50 most populous cities in the country. To compile our housing price data, we pulled every listing for a studio apartment advertised on RentHop from January 1 to November 30, 2023. In theory, a single person can rent a larger space, but we chose this unit type to represent the minimum space in which one can live alone.
To calculate the index, the following statistics were used:
1) Median non-family household income from the U.S. Census
2) Median advertised prices for the “studio” unit type via RentHop data
3) Year-over-year price changes for the “studio” unit type based on RentHop data
4) Population count by city from the U.S. Census
This year, the income factor is updated to median nonfamily household income. Median values are less likely to be skewed by outliers and, therefore, more representative of the income distribution and what typical single Americans make.
For more information on our methodology or to contact our data team, please email press@renthop.com.
Full Data
You can learn more about our index this year using the two interactive tables below. The first table includes overall rankings and housing burden, and the second one further breaks down the data by sex.
Housing Burden by Sex
The post Single Women Spend 124% More of Their Income on Rent Than Men in Major Cities in the U.S. appeared first on Real Estate Data & Research.
]]>The post The RentHop College Rent Report: October 2023 appeared first on Real Estate Data & Research.
]]>Key Findings:
- New York University has the most expensive off-campus housing among the 150 largest U.S. colleges. The median rent around the campus is $4,800 per month.
- That’s six times higher than the median rent, $800/month, around Ball State University in Muncie, IN.
- Off-campus housing is generally more expensive in coastal cities than schools in the Midwest and South.
- In places like New York and Los Angeles, it’s practically impossible for students to live on their own. Most would need multiple roommates to make off-campus housing an affordable option.
The 10 Schools Where It’s Most Expensive to Live Off-Campus
The list below highlights the most expensive colleges for off-campus housing. Not surprisingly, most of these schools are located in coastal cities with higher living costs. The median rent around New York University is $4,800, six times higher than the median rental cost around Ball State University in Muncie, IN. Housing around these schools is so expensive that it is nearly impossible for most students to live alone. Most students will need multiple roommates to make rent somewhat affordable.
Meanwhile, many schools in the LA metro within the University of California system also rank as some of the most expensive colleges for off-campus housing. At UC Irvine, students can expect to spend $3,975 monthly living off-campus. Rental units around UC San Diego, while slightly cheaper, still require a monthly commitment of $3,495.
The 10 Most Expensive Colleges for Off-Campus Housing
- New York University (New York, NY) – $4,800/month median rent
- Columbia University in the City of New York (New York, NY) – $4,102/month
- University of California Irvine (Irvine, CA) – $3,975/month
- University of California Santa Barbara (Santa Barbara, CA) – $3,895/month
- University of California Los Angeles (Los Angeles, CA) – $3,699/month
- University of Miami (Coral Gables, FL) – $3,650/month
- Harvard University (Cambridge, MA) – $3,600/month
- Stanford University (Stanford, CA) – $3,595/month
- Boston University (Boston, MA) – $3,500/month
- University of California San Diego (San Diego, CA) – $3,495/month
The 10 Schools Where It’s Most Affordable to Live Off-Campus
Contrary to what we see in coastal cities, housing around colleges in the Midwest and parts of the South is generally more affordable. At Ball State University, students can find housing for as little as $800/month. Meanwhile, those attending Michigan State University can expect to allocate around $975 a month on off-campus housing, less than half of what students at the University of Michigan–Ann Arbor would need to spend, $2,100/month.
The 10 Most Affordable Colleges for Off-Campus Housing
- Ball State University (Muncie, IN) – $800/month median rent
- Clemson University (Clemson, SC) – $835/month
- Iowa State University (Ames, IA) – $870/month
- University of Iowa (Iowa City, IA) – $875/month
- Sam Houston State University (Huntsville, TX) – $902/month
- West Virginia University (Morgantown, WV) – $912.50/month
- Kent State University (Kent, OH) – $922.50/month
- University of Missouri (Columbia, MO) – $927.50/month
- University of Nebraska–Lincoln (Lincoln, NE) – $970/month
- Michigan State University (East Lansing, MI) – $975/month
The U.S. Has a Student Housing Affordability Crisis
America’s student housing affordability crisis has worsened in the past few years. Rental prices across the country have increased significantly over the past few years since the pandemic due to dwindling supply and population shift. Such drastic rent growth forced students to compete with more renters for lower-priced units. In cities like New York, Boston, Los Angeles, and Miami, it is practically impossible for an average college student to rent a one-bedroom apartment on their own. Renting with roommates is the only way to secure housing.
Rising interest rates also intensified the student housing crisis. As mortgage rates go up, more renters delay their home purchase and stay renting, and supply struggles to catch up with the demand.
Affording Off-Campus Housing
High school students, undergraduate underclassmen, potential graduate students, and family members who will help their students with college finances can all consider a school’s off-campus housing costs. Paying for housing while in school can be expensive, and students should budget for this additional cost. Students can work a job on or off campus or acquire an additional loan to cover the upfront housing costs. Additional loans must be repaid with interest, and students should be mindful of their post-graduate expenses as they head into the workforce.
Methodology
The RentHop College Rent Report analyzes rental data from over one million active off-campus rental listings located near U.S. college campuses over the three months prior to publication. To produce the ranking, the median price for all listings within 2 miles of the center of campus was taken and ranked from most expensive to least. If there were not enough listings within 2 miles of the campus, we then expanded the radius to ensure that enough listings were included. In denser and more developed cities, the radius was reduced accordingly to reflect housing availability around the campus.
The following listing types were used to calculate the median rent price: apartment, house, townhouse, and triplex. Values refer to the median of all bedroom types, i.e., not just a one-bedroom or two-bedroom off-campus apartment.
For more information on our methodology or to contact our data team, please email press@renthop.com.
Full Data
Here are two images of the schools ranked by median rent for easy sharing. You can also search by city or college using the interactive data table at the bottom of the report.
 (Click on the image to zoom in) (Click on the image to zoom in) |
 (Click on the image to zoom in) (Click on the image to zoom in) |
Interactive Data Table
Entries in the interactive data table are ordered by enrollment population.
The post The RentHop College Rent Report: October 2023 appeared first on Real Estate Data & Research.
]]>The post Two-Bedroom Rents Continue Increasing Across DC Metro Stops appeared first on Real Estate Data & Research.
]]>The DC Metrorail transit system accommodates a majority of renters on their commutes, and many renters will pay more in rent to live closer to work. Each year, RentHop reports shifts in rental prices along major DC subway stops. This year, we discovered that:
- The median rent for a two-bedroom increased 3.12% to $2,594.
- Rental prices increased across most stops city-wide, increasing year over year at 71 subway stops.
- Prices decreased at 27 subway stations; that’s 26 more drops than last year.
- The median rental price for two-bedroom apartments increased by at least 7% at major subway stops like Union Station ($3,500, YoY +9.39%) and Dupont Circle ($3,750, YoY +7.14%).
- Large rental buildings, like 1200 N Herndon Street, by developer EQR increased rental prices near stations like Clarendon and Virginia Square – GMU by over 10%.
DC Metro Median Rent Map, with YoY Price Fluctuations
To calculate the median rent for the map above, we analyzed RentHop’s rental data for unfurnished two-bedroom apartments from May 1 through July 31, 2022, & 2023, and WMATA GIS data for Metrorail stops from DC.gov.
To get accurate prices near the Metro stops, we looked first at non-duplicated listings within 0.5 miles (800 meters) of a metro stop and calculated the median if there were 20 unique data points. If not, the radius from the stop was increased, and the data were resampled to ensure enough unique listings were used when calculating the median.
Rents Remain High for DC Renters
Renters continue to face an expensive rental market with increasing prices along most subway stops. Two-bedroom apartments rose by 3.12% yearly, and the median rental price is now $2,594. While rents are higher, they are increasing slower than the post-pandemic rush we reported in our 2022 study. Of the city’s 98 subway stops, 71 witnessed prices increase this year. Fewer stops witnessed price increases than last year, where 89 of the 91 subway stations increased in price.
Some areas became more affordable for renters this year. This year, two-bedroom rental prices decreased across 27 stations, which is 185% more than last year. Some of those stations, like Smithsonian, reside near the National Mall. Every station witnessed rental prices fluctuate.
The Following Stops Witnessed the Largest Rental Increases for Two-Bedroom Apartments
- Clarendon (Orange, Silver) – $3,419, YoY +12.08%
- Virginia Square – GMU (Orange, Silver) – $3,350, YoY +11.67%
- Union Station (Red) – $3,500, YoY +9.39%
- Court House (Orange, Silver) – $3,400, YoY +8.94%
- Tysons (Silver) – $2,500, YoY +8.70%
- Morgan Boulevard (Blue, Orange, Silver) – $1,995, YoY +7.84%
- Spring Hill (Silver) – $2,750, YoY +7.63%
- Crystal City (Blue, Yellow) – $3,027, YoY +7.55%
- Woodley Park-Zoo/Adams Morgan (Red) – $3,500, YoY +7.53%
- Van Ness – UDC (Red) – $3,333, YoY +7.52%
New Developments Drive Up Rental Prices
The two subway stops with the sharpest increase in rental prices, Clarendon and Virginia Square-GMU, now host apartment complexes with above-average rental prices. Developers Equity Residential opened luxury apartment complexes that increased rents in the area.
With two-bedroom apartments at 901 N. Nelson Street now asking up to $3,735, the median rental price increased. A similar situation occurred with EQR’s new development at 1200 N Herndon St., driving up rental prices for the entire area.
Optimize Your Savings by Increasing Your Commute
Would you ride an extra subway stop to save over $1,000? Our team observed the most significant price differences between stops across the city to find where renters can score the best deal. Stark price decreases can be due to traveling across the water and neighborhoods, a price increase at one stop compared to a decrease at the neighboring stop, or a combination of factors.
Consider the Following Options to Maximize your Savings
- Save $1,403 by moving to Anacostia ($1,700) from Navy Yard – Ballpark ($3,103) – Green Line.
- Save $1,002 by moving from NoMa – Gallaudet U ($3,325) to Rhode Island Ave – Brentwood ($2,323) – Red Line.
- Save $1,000 by moving from Stadium – Armory ($2,900) to Minnesota Ave ($1,900) – Orange Line.
The post Two-Bedroom Rents Continue Increasing Across DC Metro Stops appeared first on Real Estate Data & Research.
]]>The post The Madness of Boston Move-In Day appeared first on Real Estate Data & Research.
]]>Viewing the Madness Through Heat Maps
We looked at the data provided by the City of Boston for street occupancy permits. For this study, we used publicly available data on Boston’s moving truck permits, made available on Boston’s open data hub. The data provides us with the issued moving truck permits for dates up to September 15, 2023. For this map, we focused exclusively on the expiration dates of the moving truck permits (which generally coincide with the actual moving dates) instead of the permit issuance dates. You can only apply online for a permit if your moving date is at least two weeks away and no more than a month away. However, because we are looking at when these moving permits expire, additional permits may be registered between now and your move-in day, so long as potential movers fit the above criteria.
The map above closely examines the daily number of issued moving truck permits from August 1, 2023, to September 15, 2023. This map will be a great tool for those looking to check out if their neighborhood will be particularly affected by students and all of their “baggage” during specific dates. By looking more specifically at the individual dates, we see that the following dates have higher spikes than others. This is due to permits ending on those dates. The top six dates for 2023, where permits will expire or have expired, are:
- September 1, 2023: 1,113 permits are due to expire.
- August 31, 2023: 692 permits are due to expire.
- September 2, 2023: 280 permits are due to expire.
- August 30, 2023: 261 permits are due to expire.
- August 26, 2022: 191 permits are due to expire.
A Deeper Look at Boston Moving Patterns
From the data provided, it is safe to say that there is a relationship between the number of issued permits and the move-in period for new and returning students in Boston. Overall, this summer has been quieter than last year. This may be related to several colleges becoming more selective, such as Boston University, which reduced the number of new enrollments for 2023 by over 3,000. Looking at the number of issued moving truck permits back from January 2019 to September 2023, this is how the numbers are divided.
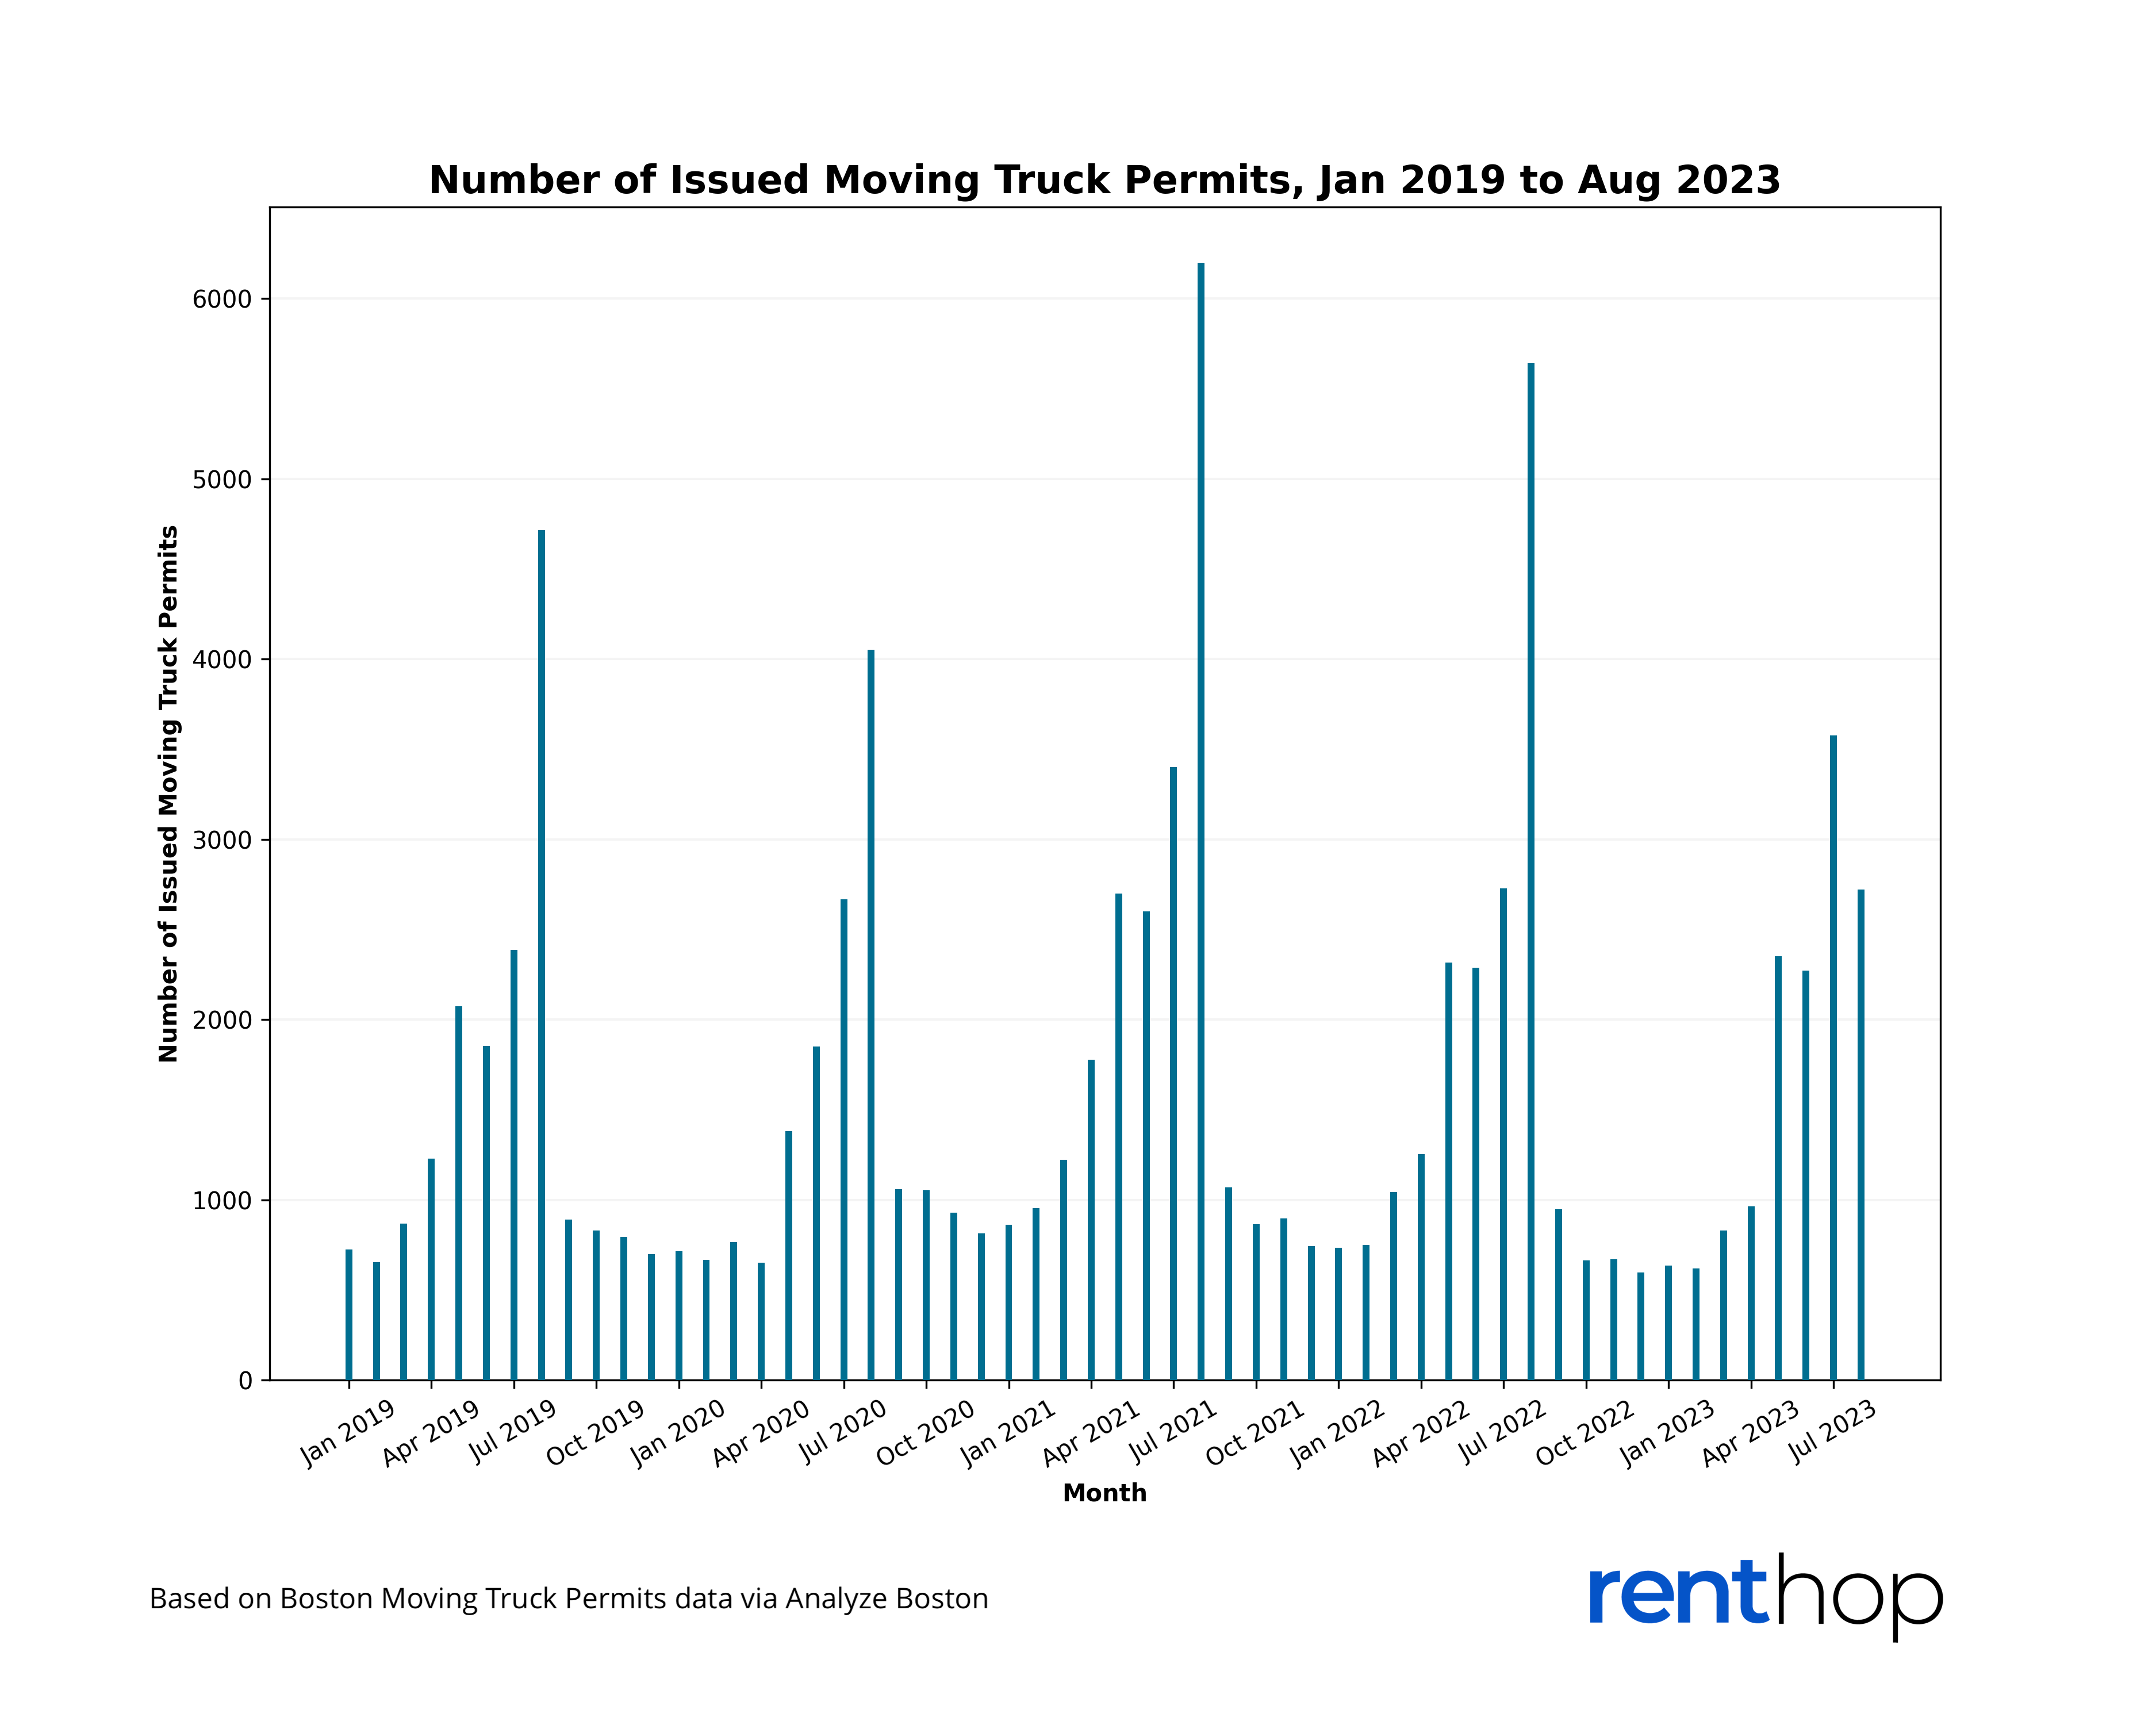
Top 10 Months With Highest Number of Issued Permits
| Month | Number of Issued Permits | |
| 1 | August, 2021 | 6,198 |
| 2 | August, 2022 | 5,642 |
| 3 | August, 2019 | 4,714 |
| 4 | August, 2020 | 4,051 |
| 5 | July, 2023 | 3,576 |
| 6 | July, 2021 | 3,400 |
| 7 | July, 2022 | 2,728 |
| 8 | August, 2023 | 2,722 |
| 9 | May, 2021 | 2,700 |
| 10 | July, 2020 | 2,668 |
The table above looks at the number of expired moving truck permits in the past five years. August 2021 ranks the highest, with 6,198 issued permits. August remains the top month with the most issued permits, with August occupying five out of the ten spots for the top ten months.
So which areas are the worst to commute in around the move-in period? For you to know which area to avoid, we took a deeper look at the zip codes attached to the issued moving truck permits as well. Knowing which zip codes are the busiest might help you plan ahead if you’re one of those affected by the move-in period when commuting to work, the gym, etc. We ranked the top ten busiest zip codes based on the number of issued permits.
Top 10 Zip Codes With Highest Number of Issued Permits
| Zip Code | Permit Count | |
| 1 | 02127 (South Boston) | 434 |
| 2 | 02116 (Back Bay) | 273 |
| 3 | 02135 (Brighton) | 263 |
| 4 | 02118 (South End) | 230 |
| 5 | 02113 (North End) | 229 |
| 6 | 02114 (West End) | 203 |
| 7 | 02130 (Jamaica Plain) | 162 |
| 8 | 02115 (Fenway – East Fens – Longwood) | 154 |
| 9 | 02134 (Allston) | 145 |
| 10 | 02129 (Charleston) | 122 |
The zip code with the highest number of issued permits this year is again 02127 (South Boston), with a total of 434 issued permits between August and September 2023. Following 02127, we have the zip codes 02116 (Back Bay), 02135 (Brighton), and 02118 (South End). We still see that a lot of the zip codes with the highest number of issued permits are in popular neighborhoods for students to live in.
Survival Guide: How to Dodge the Madness
1. Check when close by universities and schools have their move-in day
If you have a school or university near where you live, you probably already know there will be more traffic than usual around the move-in period. But exactly when is the move-in dates for your local university or school? It might be worth checking the academic calendar to ensure you mark the dates that your area will be busier than usual. Here are just a couple of move-in dates for Boston schools and universities coming up in the next couple of weeks, based on the academic calendar for 2023.
- Boston University: Wednesday, August 30, 2023, to Monday, September 4, 2023
- Northeastern University: Sunday, August 27, 2023, to Tuesday, September 5, 2023
- Boston College: Thursday, August 24, 2023, to Sunday, August 27, 2023
- Emerson College: Saturday, August 26, 2023, Monday, August 28, 2023, Thursday, August 31, 2023, to Friday, September 1, 2023
- Suffolk University: Saturday, September 2, 2023, to Sunday, September 3, 2023
- Berklee College of Music: Saturday, August 26, 2023
2. Map out alternate routes by using the map
Check the embedded map to find alternative routes to the gym, the store, or work. Take a minute to map out some paths other than your normal route if you can see from the map that it might be rather busy. No one wants to get stuck in the middle of a traffic jam or behind a big moving truck on a narrow road. Research the route before heading out to save yourself from a headache.
3. Plan around potential delays
Despite all your best efforts and planning, delays and annoyances will be impossible to avoid. Especially in a city as close-quartered as most of Boston is, a single vehicle being out of place or stopped for too long can cause some major issues. As a result, you should give yourself more time every day to account for the potential delays. While you might miss out on the delays, you planned for and be very early to work or class, that is better than not giving yourself that extra time and hitting a delay, making yourself very late.
4. Accept the fact and don’t panic or get angry
While this tip isn’t so much about helping you avoid the madness that is Boston Move-In Day, it can make it much more manageable for you. There is a high chance of your commute or drive being disrupted somehow due to the moving trucks. Instead of thinking you will get through without a hitch and then getting upset or angry when you get stopped, expect and accept that it is likely to happen. Simply expecting to be disrupted by the madness will make it less bad when it occurs, and if it doesn’t, you will feel like you just hit the jackpot.
5. Take advantage of the chaos with “Allston Christmas”
While many will avoid this area at all costs, some deliberately look to go to these areas around move-in day. The reasoning for this is “Allston Christmas.” For those unfamiliar, Allston Christmas is the period around move-in day when many people move in and out of apartments. While most furniture will make it into a U-Haul or an apartment, there are always some just left on the street, free for anyone to take. So instead of treating this whole ordeal as a disturbance, treat it as an opportunity. There is a good chance you can find some pretty cool things simply lying on the sidewalk or in the street.
The post The Madness of Boston Move-In Day appeared first on Real Estate Data & Research.
]]>