With the New York primaries behind us and the Republican field thinned to just one, there's only one contest left to watch. Hillary certainly doesn't plan to go down without a fight and that's just what Bernie is giving her. Although Ms. Clinton currently holds a five-fold margin over Mr. Sanders across New York City in documented donations, she's barely holding him off in terms of donors and votes. It's been no secret that Hillary has deep pocketed friends, but will that be enough?
Find your neighborhood and ZIP Code on the map below to see if you're in Hillary Country or Bernie's Land.
To create the map, we took the FEC’s disclosure reports detailing individual contributions to candidates. The data from most recent national filing on April 22, 2016, detailed over 2.5 million documented contributions, totaling over $700 million for all candidates’ campaigns. To make this data more usable, we cleaned it up a bit first, grouping together line items from people with the same name, from the same zip code and with the same occupation, effectively removing duplicated entries for the same person.
It’s important to note that data is not required to be collected about individuals that give less than $200 during the entire election cycle. This can mean that donors who previously contributed are only now breaking that $200 threshold and becoming documented, while others may not be documented at all. A quick look at the FEC.gov site shows that their contributions amounts are actually neck and neck across the country, with Sanders actually leading by almost $2 million.
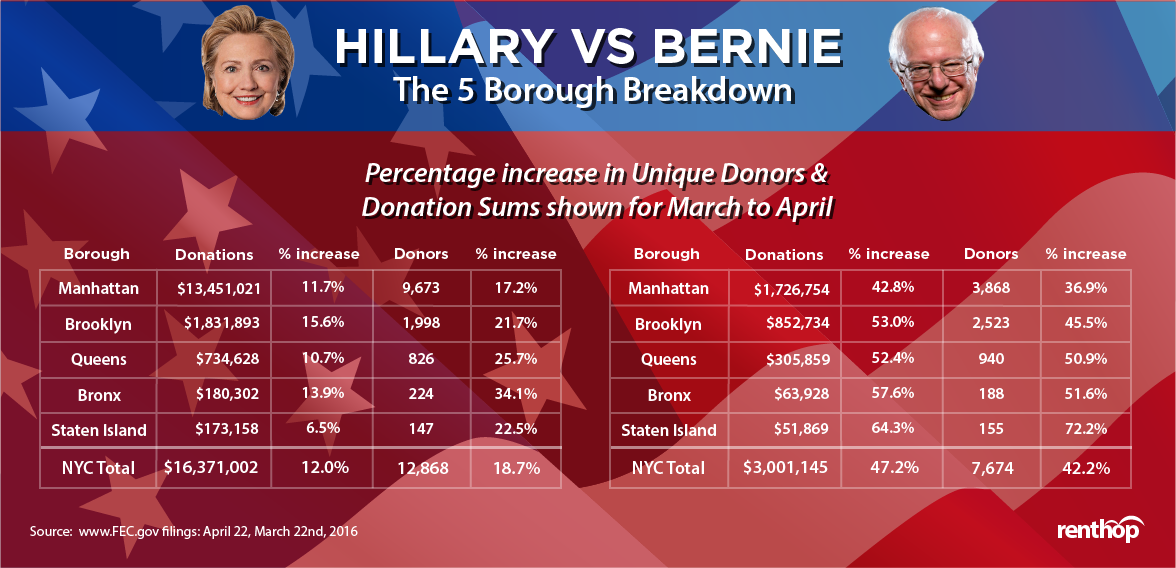
It's quite clear that Hillary still holds a wide margin in donations over Bernie in every borough, but that gap has narrowed considerably in every borough except Manhattan. In Manhttan, where the majority of Hillary's New York City donations have come from, she has an 800% lead in contributions. While Bernie saw a 42% increase in donations in Manhattan, Hillary only saw an 11.7% increase, indicating a clear momentum shift. Bernie experienced a 47.2% increase in donations across the five borough area, while Hillary saw just 12% in new money.
Looking at donor counts, Bernie has actually surpassed Hillary in most boroughs with help from his 42.2% increase in donors. Since this donor count represents the count of unique donors, repeated donations, regardless of the size, are only tallied as one donor. Many would say the donor count is a much better metric of support for the candidate and is more closely related to votes and vote counts, as each is person would only be counted once. Bernie holds a strong lead over Hillary in Brooklyn, with over 20% more donors, and also hold marginal leads in Queens and Staten Island. He trails slightly in the Bronx, by a handful of donors.
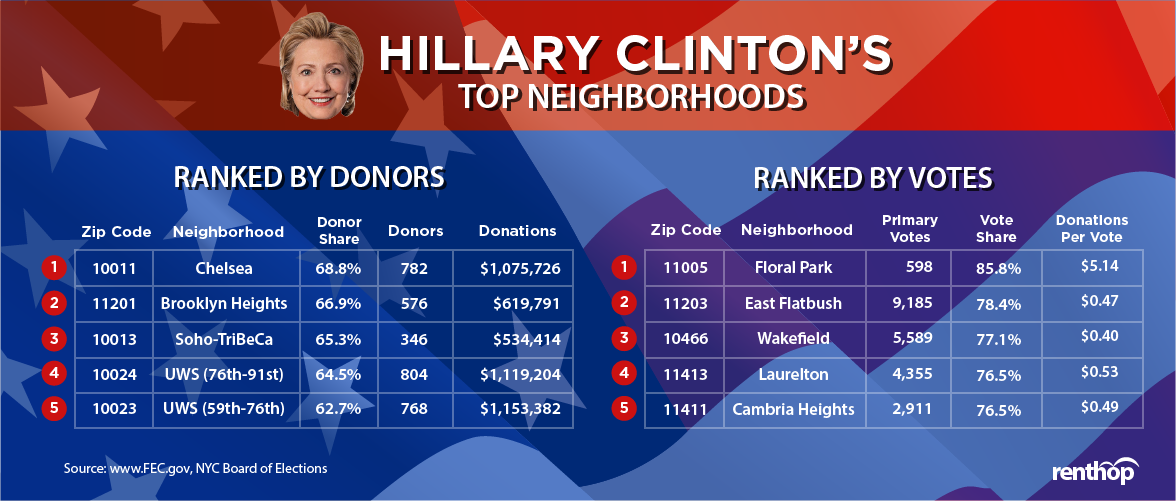
Hillary is still the major player in NYC, especially in the neighborhood of her daughter's namesake (Chelsea) where she has nearly 70% of the overall donor share and about $1.08 million in donations. The Upper West Side also dished out enough dough to buy a nice Condo in each ZIP Code. Looking at her best performing neighborhoods by donor, she simply dominated the outer boroughs. Referencing the donations collected in those areas, we can see that despite collectng very little money, she still got the vote. It seems quite possible that she leveraged the cash collected in Manhattan to gain influence in Queens.
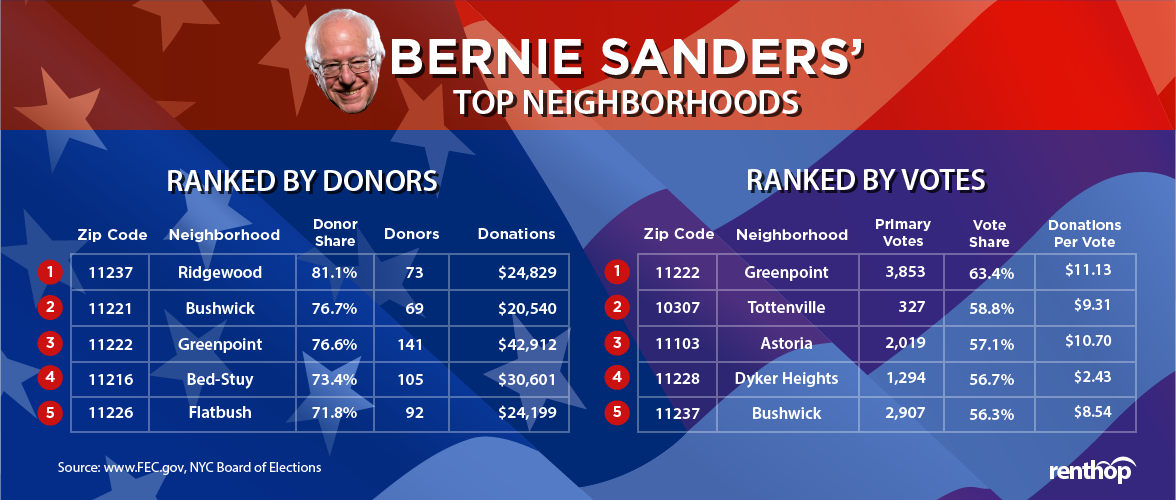
Bernie's donor breakdown tells a more balanced story. Bernie performed best with voters and donors in similar areas, while Hillary's money and votes seemed to come from different places. In neighborhoods where he had the largest share of donors, he still only raked in ten's of thousands instead of Hillary's millions. All of Bernie's best-performing neighborhoods are in Brooklyn, Considering the fraction of donations raised, he held his ground against Hillary. Check out the "Primary Voters" option on the interactive map to see exactly how they stacked up.
If you’re in the market for a new apartment, or were just influenced to move because of this study, be sure to check out the extensive selection of New York City apartments for rent.
RentHop, it’s like apartment hunting.. but smarter.
"2016 Presidential Campaign Finance, Contributor Data Download, All Candidates", FEC.gov, Pulled on May 4, 2016, http://fec.gov/disclosurep/PDownload.do.
"Unofficial Election Night Results", BOARD OF ELECTIONS IN THE CITY OF NEW YORK, Pulled on May 4, 2016, https://enrweb.boenyc.us/index.html