Public safety is a topic commonly talked about in San Francisco. Most recently it was brought up for discussion again due to the number of violent crimes the residents were seeing in the Embarcadero district, which is one of the city’s most scenic and attraction filled areas. While the city has been known for its high crime rate, the crime rate has actually been on the decline. According to the FBI Uniform Crime Reporting (UCR) program, San Francisco saw 62.3 crimes per 1,000 population for the year 2018, 9.4% lower than in 2017. Nonetheless, the city is still one of the most dangerous cities in the U.S., especially when it comes to property crimes.
If you’re curious, we’ve provided further breakdowns on the criminal activities involving property crimes within San Francisco, using data provided by the San Francisco Police Department. Here are our key findings:
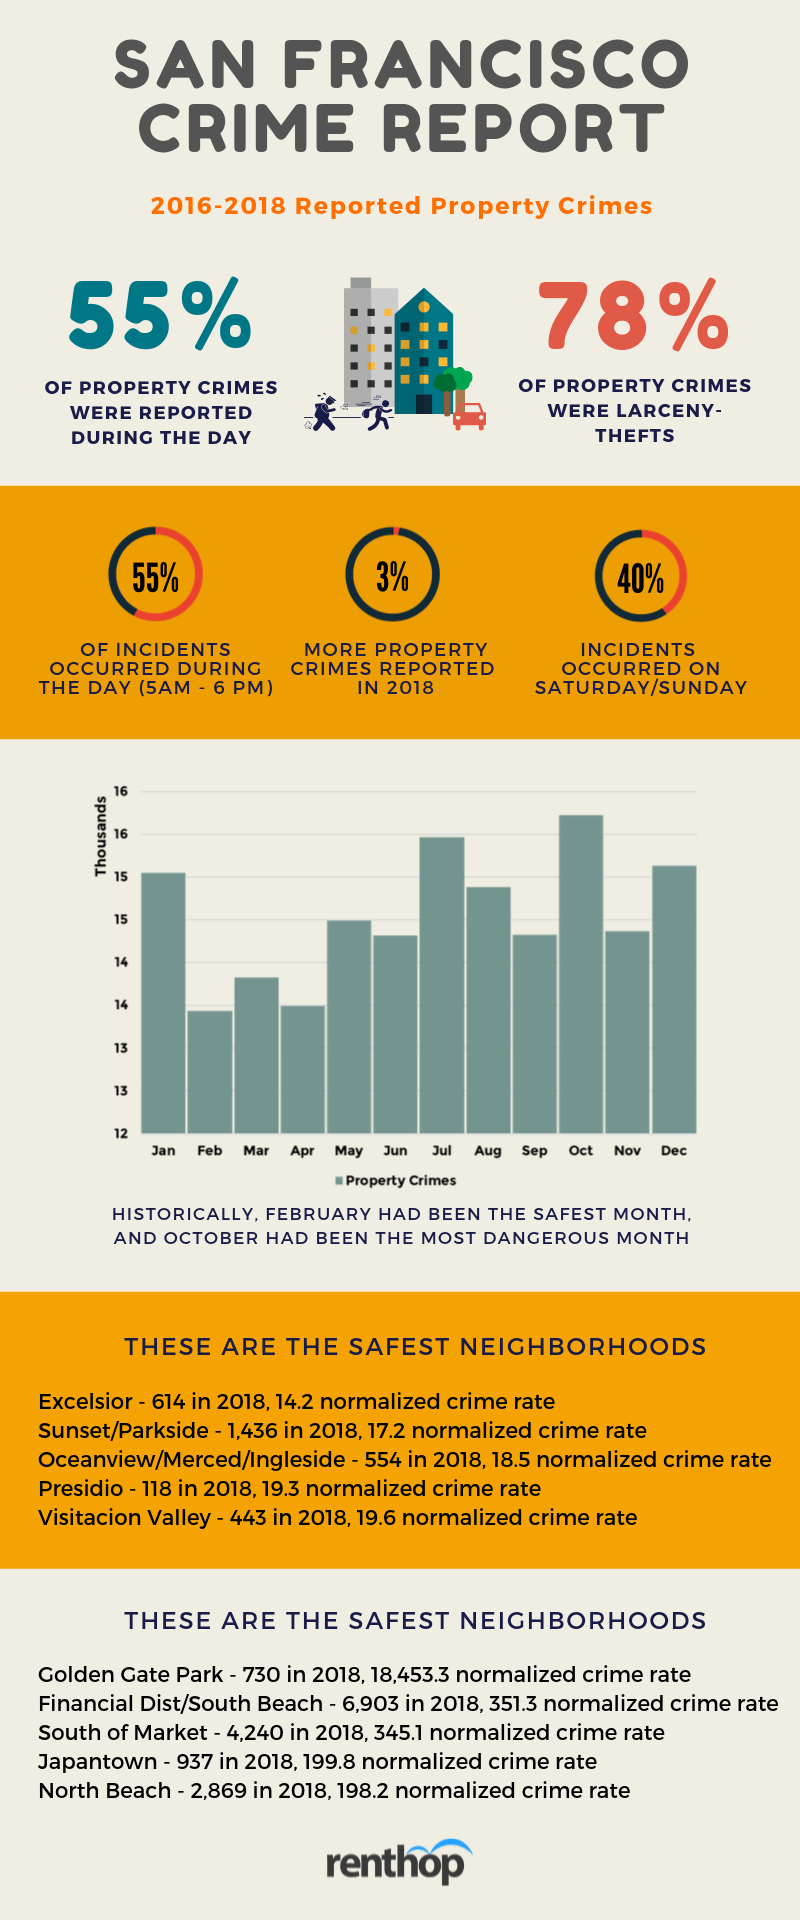
- According to the data released by the San Francisco Police Department, the total crime incidents involving property crimes went up 3%.
- Excelsior is currently the safest neighborhood in San Francisco with a total of 614 property crimes reported in 2018, at a 14.24 normalized crime rate.
- Golden Gate Park, with 730 property crimes reported in 2018 has a normalized crime rate of 18453.33, making it the most dangerous neighborhood in San Francisco.
- The neighborhood of Lincoln Park experienced the biggest spike in reported property crimes, from 21 in 2017 to 104 in 2018. That’s over a 395% increase.
Crimes in San Francisco – Where Does Your Neighborhood Stand?
The interactive map below shows the number of crimes reported by neighborhoods. The darker the shade, the more crimes reported from 2016 to 2018. Note that, in order to rank impartially, we normalized the crime data by the population count in each neighborhood. Why did we do that? Hypothetically, neighborhoods with denser populations might see more criminal activities and normalization allows us to fairly compare the number of crimes from different neighborhoods.
Visually, we can tell that South San Francisco is safer compared to other parts of the city. While there is correlation between crime rates and proximity to the city center, Golden Gate Park which is located outside of the general San Francisco downtown area has one of the highest normalized crime rates for the city. Other neighborhoods with a darker shade include Financial District/ South Beach, South of Market, Japantown, North Beach, and Lincoln Park. Neighborhoods with the lightest shades, aka, the safest, include Excelsior, Sunset/ Parkside, Oceanview/ Merced/ Ingleside, and Presidio. You can learn more about each neighborhood by clicking on them, to reset, simply click the ‘reset’ button located on the upper left corner.
Is it truly the Golden City?
Typically, the volume of crime has been directly correlated to the size of a city’s population. Over the years, San Francisco has experienced a slow growth rate in their population. The city is currently home to an estimated population of over 800,000 people. In 2018, the SFPD recorded a total of 61,800 property crimes, that’s 3.4% more than in the previous year. Certainly, for some neighborhoods, things got worse.
Property Crime Volume Went Up in These Neighborhoods
- Lincoln Park – 21 property crimes in 2017, 104 in 2018, +395%
- Presidio – 46 property crimes in 2017, 118 in 2018, +157%
- Treasure Island – 82 property crimes in 2017, 163 in 2018, +99%
- Visitacion Valley – 317 property crimes in 2017, 443 in 2018, +40%
- Seacliff – 55 violent crimes in 2017, 76 in 2018, +38%
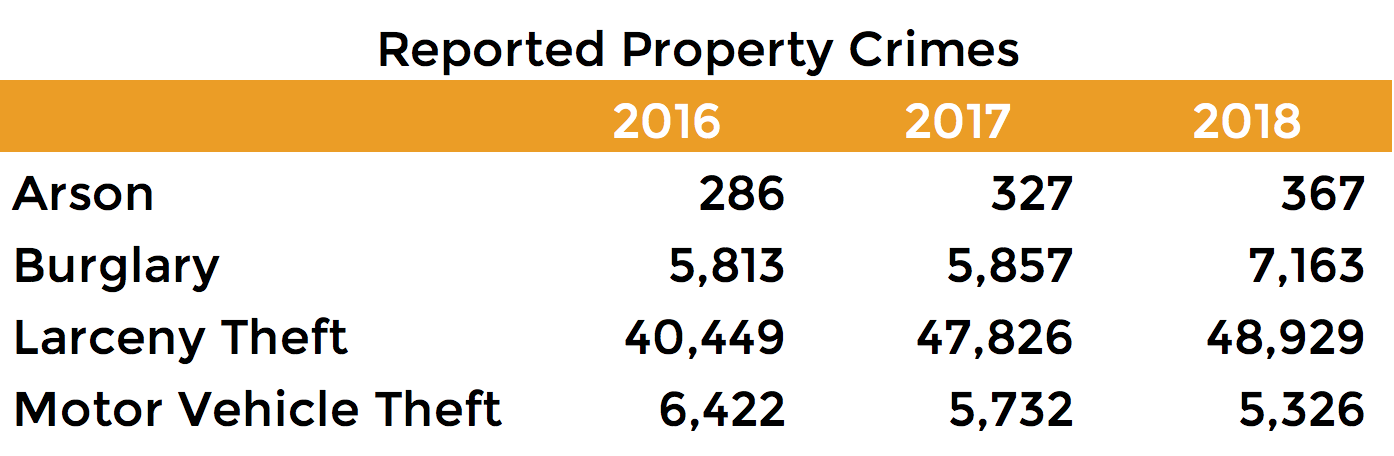
Given that overall rise in property crimes, it’s no wonder that incidents involving arson, burglary, and larceny – theft have all risen as well. Specifically, burglaries increased over 22% from 5,857 cases reported in 2017 to a total of 7,163 cases reported in 2018. The only type of incidents that have dropped since 2017 were motor vehicle thefts which dropped 7.1% to only 5,326 reported in 2018. The graphs below summarize our findings.
What You Need to Know to Stay Safe
In addition to analyzing the reported crimes by geographical location, we also took a closer look at when crimes were reported. We broke down reported crimes by day of the week, month, and time of the day. This next infographic, meant to be shared with your friends and family, will allow you to easily view our findings.
Methodology
To better understand crimes in San Francisco, we pulled the crime data made public by the San Francisco Police Department. Any crimes reported after May 2018 were pulled from here. We limited our scope to only property crimes as San Francisco has one of the highest property rates in the U.S. Currently, the SFPD categorizes its reported property crimes into the following main categories: arson, burglary, larceny-theft, and motor vehicle thefts. For analysis purposes, we first removed potential duplicates based on time, date, crime codes, and location, and then geocoded each reported crime to corresponding neighborhoods by using the coordinates which were included in the open data portal. The neighborhood boundaries are based on the Analysis Neighborhood boundaries provided by DataSF.


