Oscar Wilde once said, “it’s an odd thing but anyone who disappears is said to be in San Francisco.” Indeed, with the weather, view, and diversity, San Francisco is one of the most beautiful cities in the U.S. But then, every city has a dark side, and San Francisco is no exception. San Francisco, as small as it is, is covered by poop – dog and human poop. According to the San Francisco Department of Animal, there are around 120,000 dogs in San Francisco, making it one of the most dog-friendly cities. In addition to our furry friends, there are over 7,000 homeless individuals in San Francisco. Sounds a lot better than New York and Los Angeles, you might say. But the lack of shelters and a better system is putting the city in danger.
Last year, our sister site RealtyHop took a look at the number of animal/human waste violations made to the SF 311 and found that in 2017, San Francisco residents reported over 20,800 poop sightings, that’s over 450 per square mile! It was so bad that the city government finally launched the Poop Patrol program to proactively mitigate the crisis last year. Is the “shituation” finally under control?
Some of Our Key Findings this Year Include:
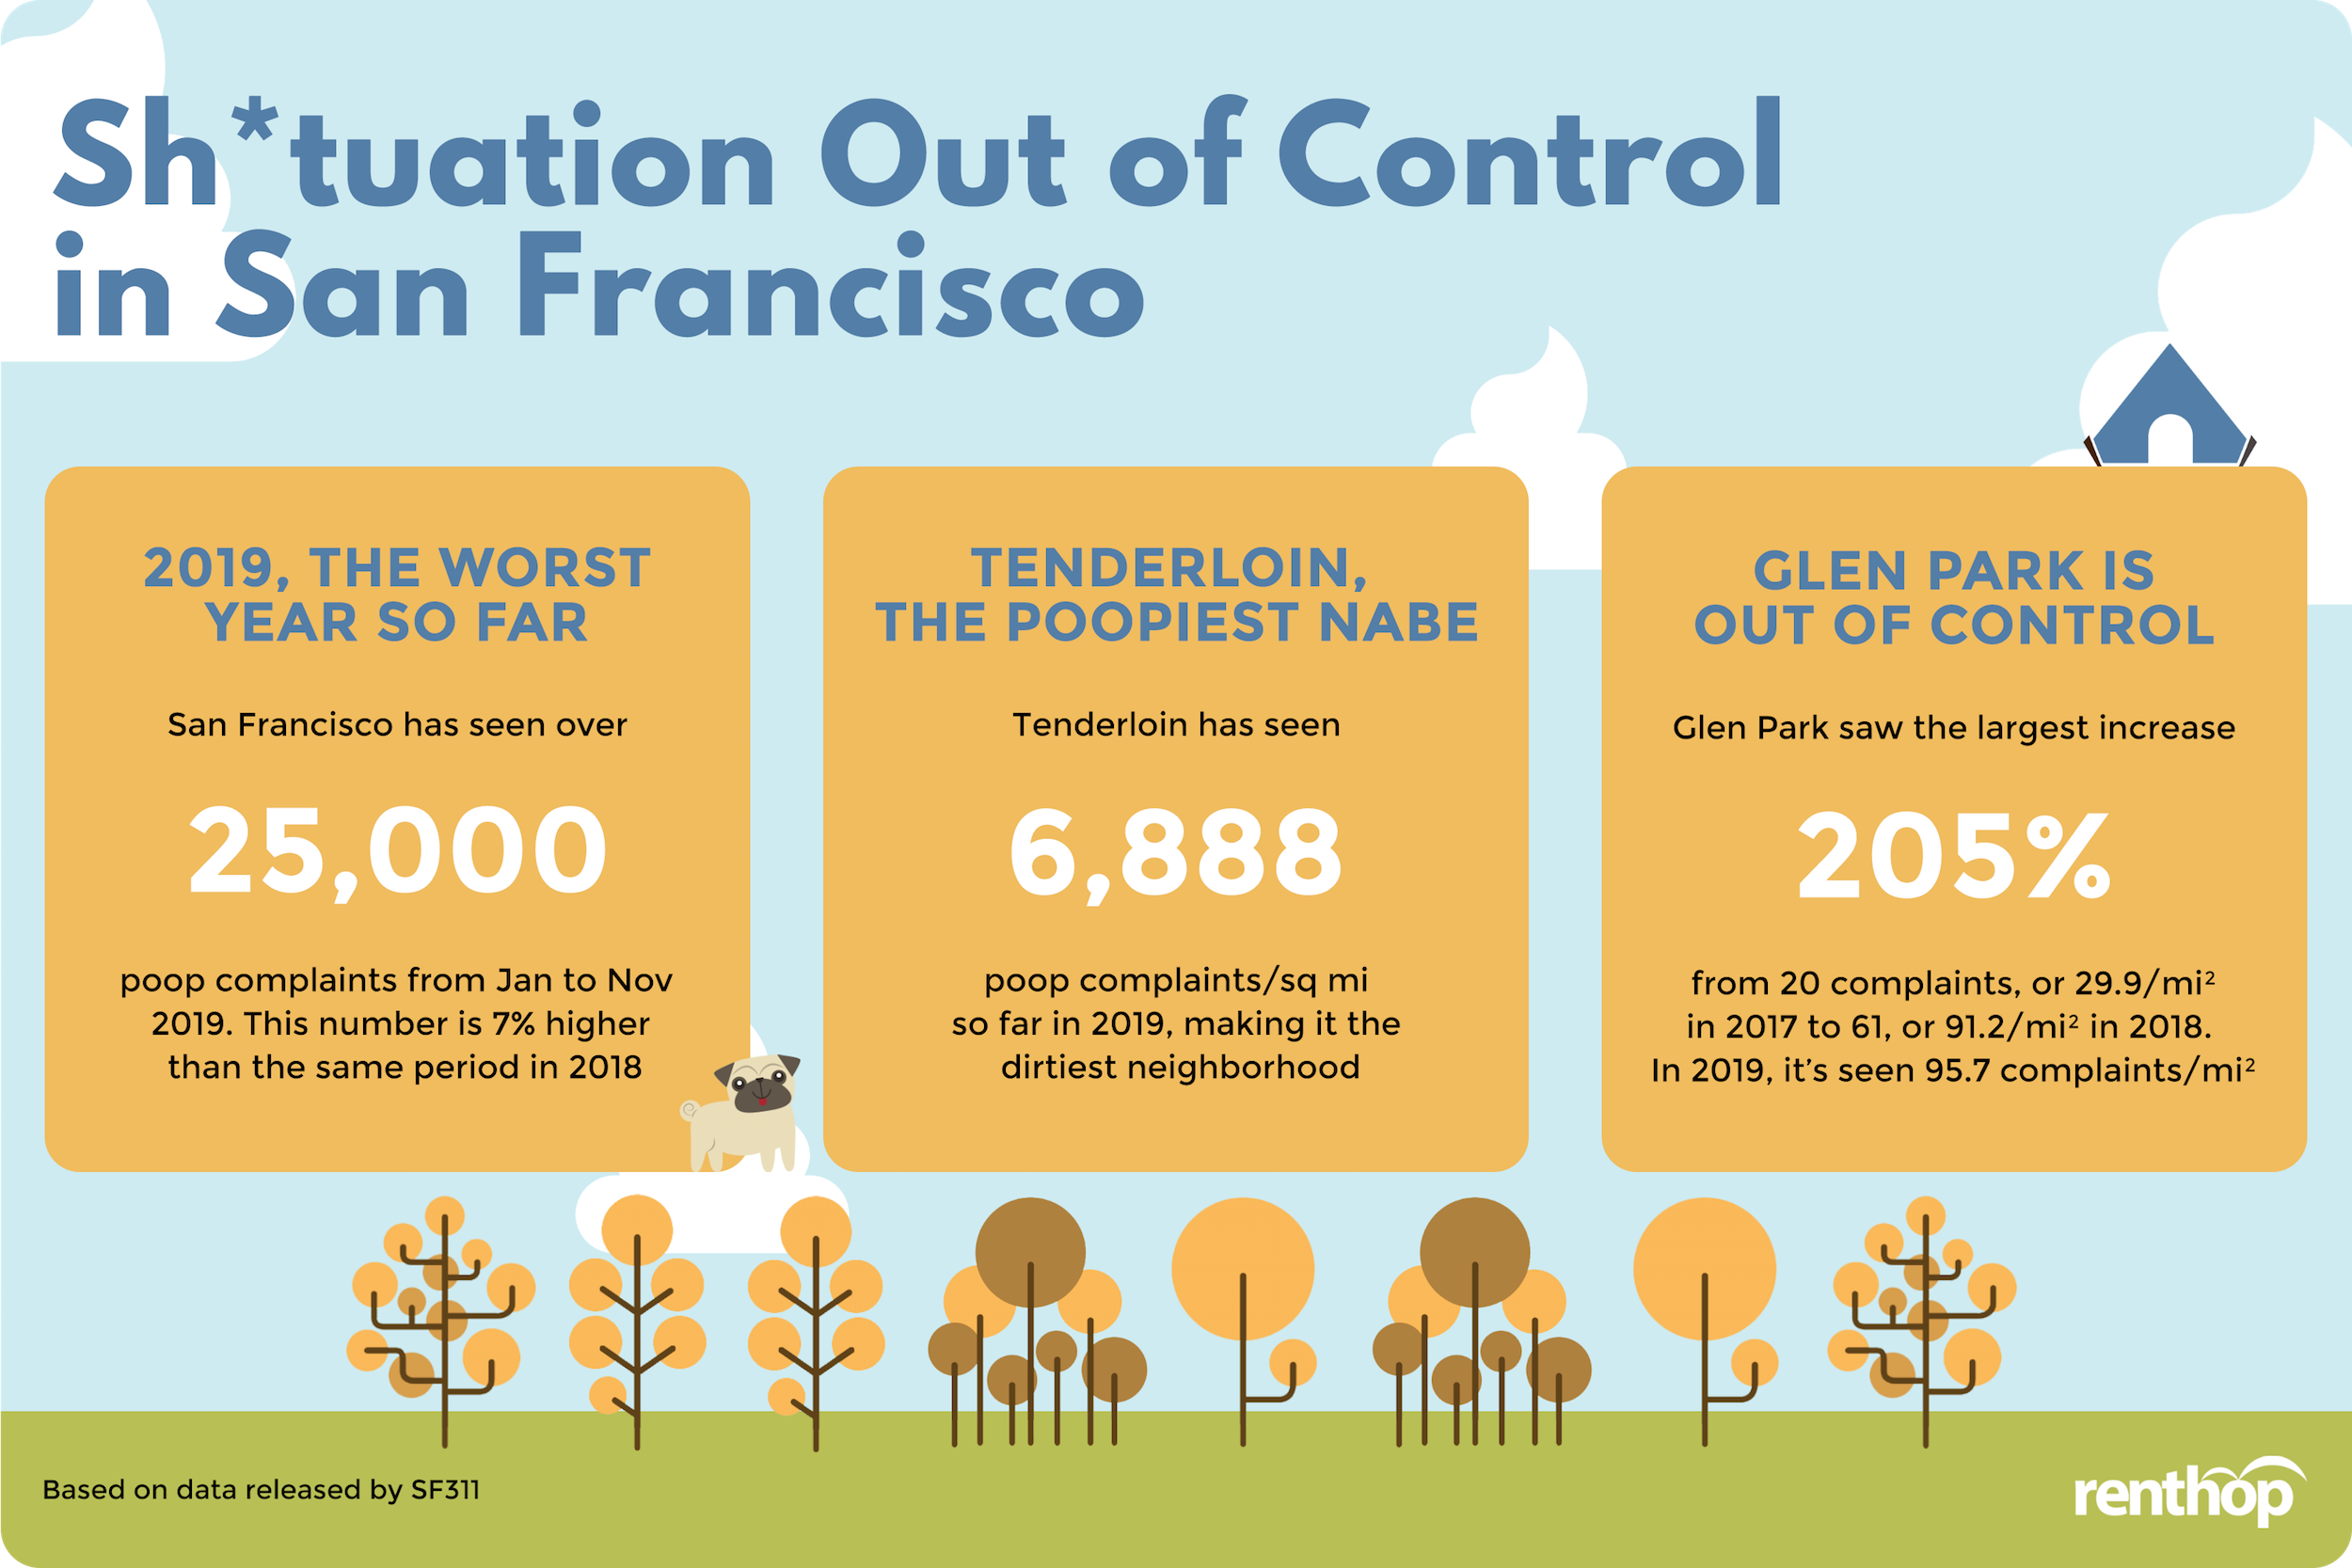
- In 2018, SF311 received 28,315 animal/human waste complaints, 35% more than the previous year. As of November 6th, SF311 has received over 25,000 animal or human waste complaints this year, around 7% more than the same period in 2018.
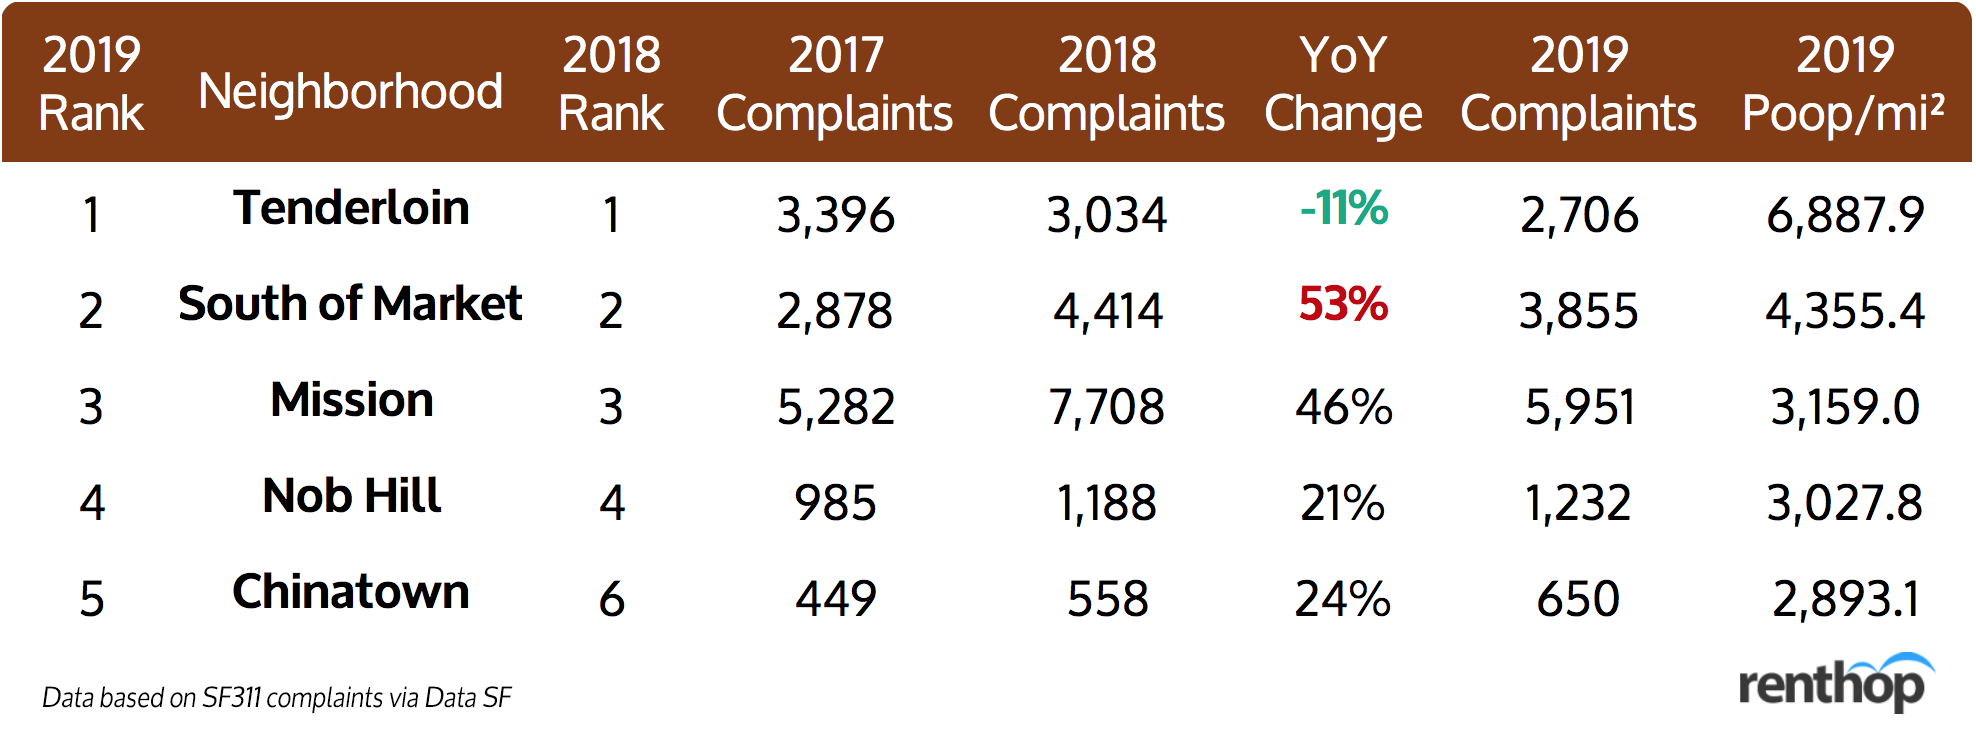
- The dirtiest neighborhoods, with the most amount of poop complaints, are currently located in the city center areas of San Francisco. Tenderloin has been on a winning streak for the “poopiest neighborhood” contest for the past three years. The neighborhood saw 8,644.2 animal/human waste incidents per sq mi in 2017, 7,722.8 in 2018, and 6,887.9 so far in 2019. [2019 Poop Map]
- Glen Park saw the largest increase in terms of number of animal/human waste complaints from 2017 to 2018. In 2017, the neighborhood received 20 complaints, or 29.9/Sq Mi. This number jumped 205% to 61, or 91.2/Sq Mi in 2018.
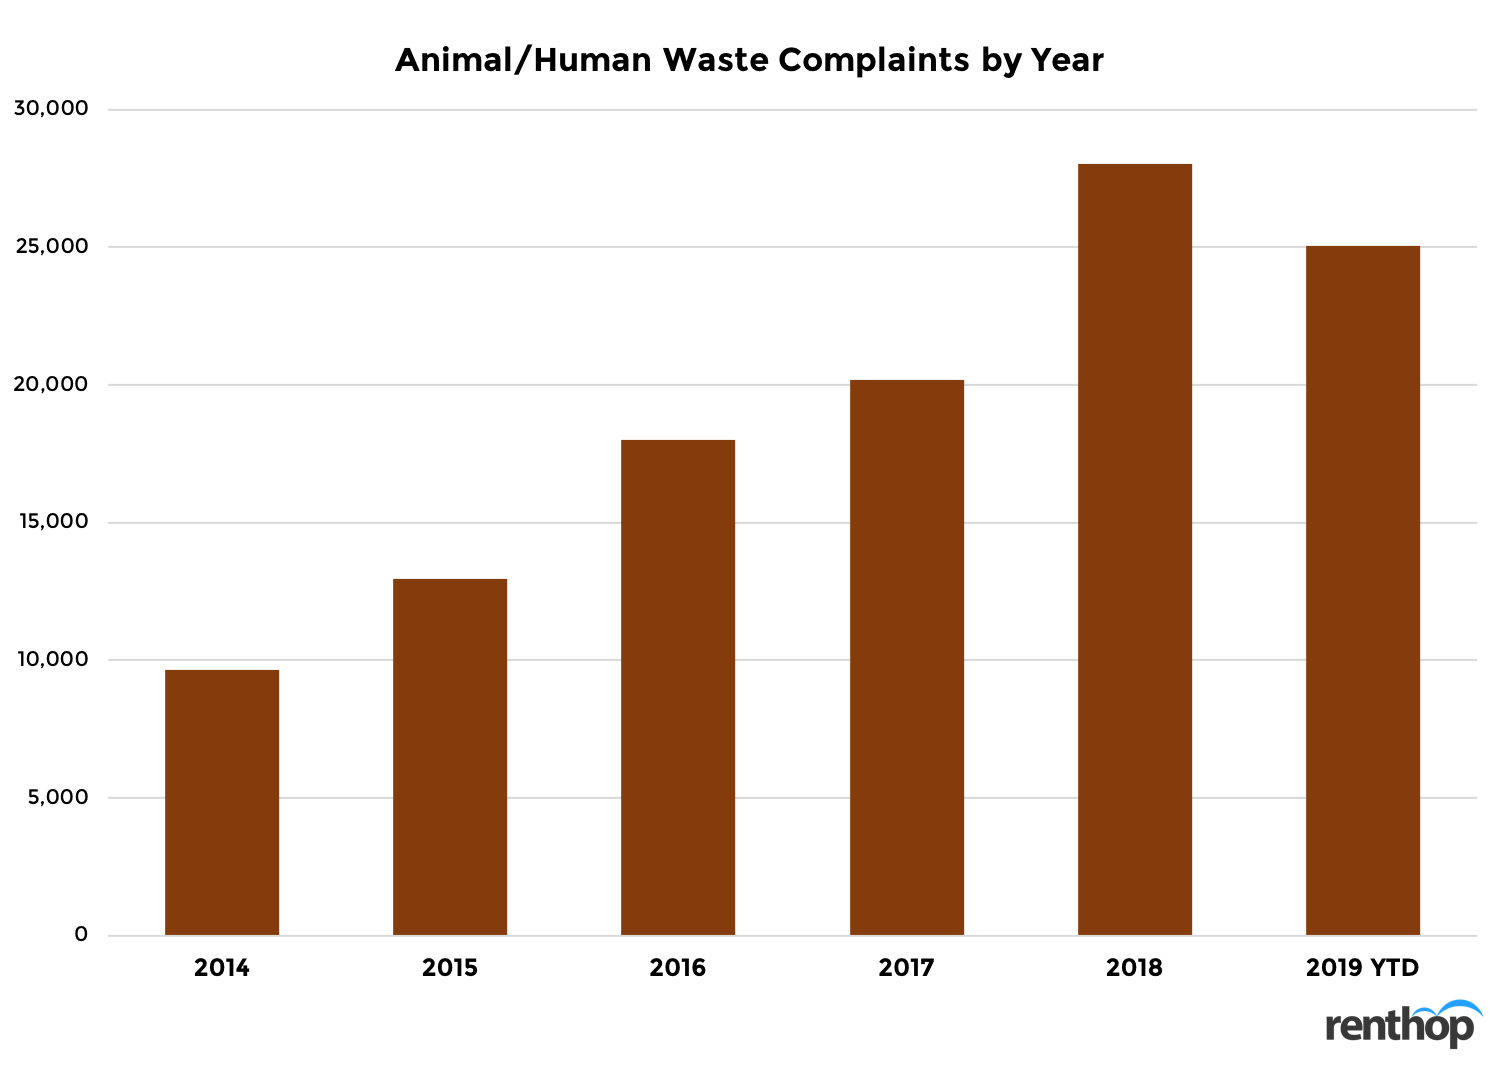
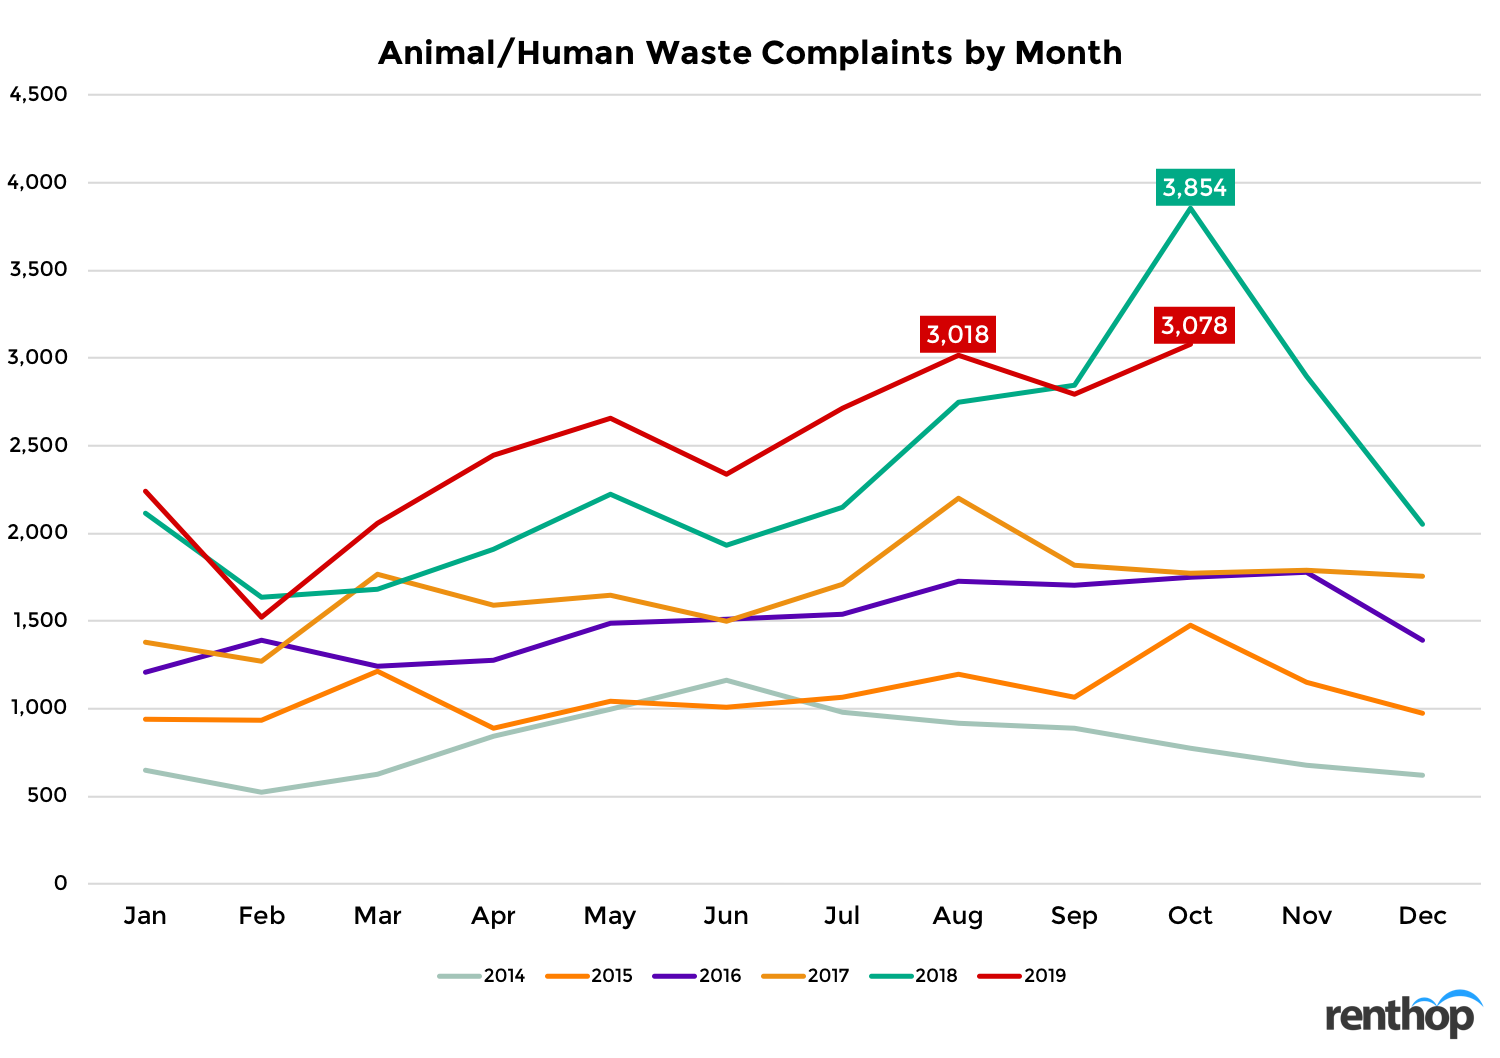
- The number of poop complaints has steadily risen in the past few years, around 80% increase since 2011.[Figure 1]
- October 2018 was the worst month since the city started logging poop complaints. San Francisco received 3,854 animal/human waste complaints that month.[Figure 2]
Where to Dodge the Poop
Living in a sh*tty neighborhood has a whole different meaning for San Francisco residents. The interactive map below illustrates the poopiness of all San Francisco neighborhoods. The darker the shade, the more animal/human waste complaints in that neighborhood. Note that to properly compare each neighborhood, we first removed duplicates by date and location and then normalized the incident count by land size.
Just like what we saw last year, the majority of San Francisco’s poop sightings occur at and around the city center in 2019. These neighborhoods have a higher concentration of commercial buildings, and it seems that, due to the larger availability to resources, such as public bathrooms, water fountains, food vendors, etc., many of San Francisco’s homeless encampments also concentrates in these areas. Neighborhoods further away from the city center continue to see a much lower count of poop complaints.
These Neighborhoods are Covered by Poop
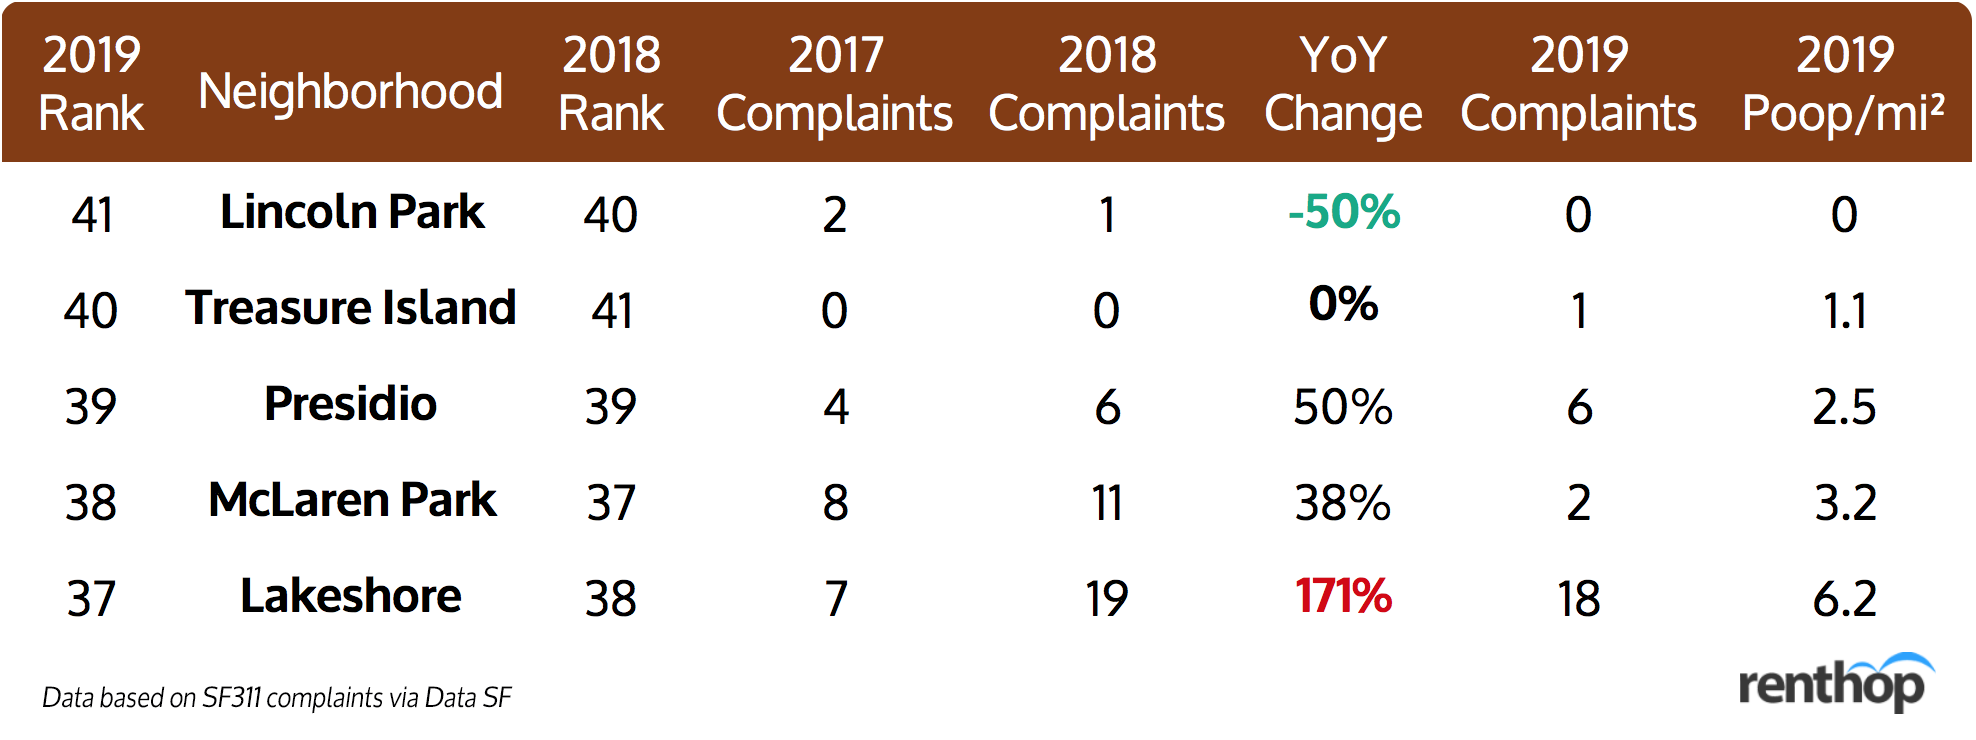
These are the Cleanest Neighborhoods
There Is No Correlation Between Median Rental Price and Poop in San Francisco
In addition to the geographical locations of the animal/human waste incidents, we also took a deeper dive into the 311 data and rental rates. As expected, our analysis indicated that there is no correlation between the 1BR median rent and poop complaints. In other words, the rental rates and the level of dirtiness of a neighborhood are not connected. Instead, there are other factors at play which influence the large concentration of poop complaints at and around the city center, such as the high concentrations of homeless individuals in those neighborhoods.
Is the Poop Crisis Getting Worse in San Francisco?
Unfortunately, the answer is a resounding yes. As we can see from Figure 1, the number of poop complaints has steadily risen year over year.
Since 2011, the number of poop complaints has risen by over 80% compared to the number of complaints received in 2018. So far this year, there have been over 25,000 311 complaints related to animal or human waste. If this number continues to increase, we may see another record-breaking year for San Francisco. Something, we’re sure, many residents of San Francisco, do not want to experience.
When to Watch Out for Poop?
With the rising count of poop complaints, it’s no wonder that most people are constantly watching their steps when walking around the city. Unfortunately, given the city’s typically stable and warm weather, Figure 2 shows no huge seasonality trends for unique poop complaints year-over-year in San Francisco. However, in 2018, we saw a drastic spike of 3,910 complaints filed in October of 2018 which then slowly decreased over the next few months till February. This increase could have been related to the elevated level of awareness of the sh*tuation caused by the buzz around the Poop Patrol Program.
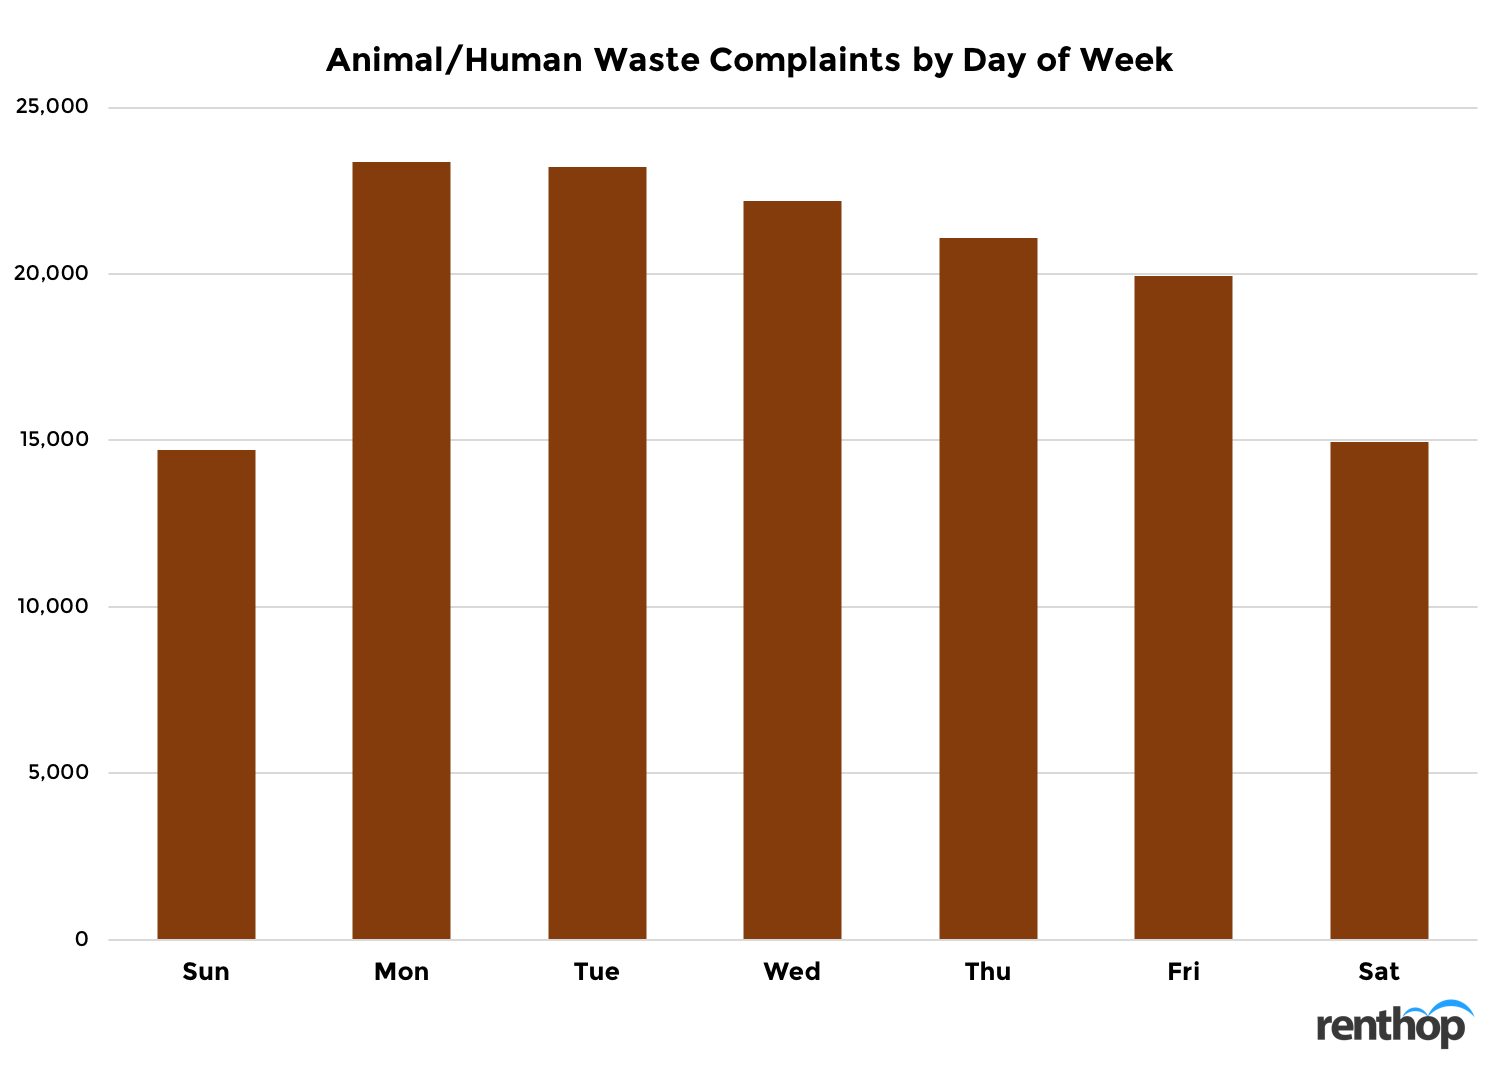
When it comes to the number of poop complaints by day of the week, there’s a much clearer trend. A compilation of data shows that Monday, historically, has been the worst day, with 23,352 complaints reported, followed closely by Tuesday, with 23,223 complaints. Meanwhile, the number of complaints SF311 received tends to be lower during the weekend. Perhaps, such a trend is related to the geographical locations of the animal/human waste incidents.
Methodology
To conduct this study, we collected the animal/human waste data made public by SF311 via the Data SF portal. To make sure that we map the complaints in the right neighborhood, we geocoded every incident using the latitude and longitude provided in the dataset. The neighborhoods adopted in this study are the “Analysis Neighborhoods”.
Note that to properly address the poop crisis and compare the neighborhoods, we first removed duplicates by date and location. We did so since multiple residents can complain about the same pile of doo-doo and would not be aware whether the issue they see has already been reported. We then normalized the unique poop count by land size so we could fairly rank neighborhoods.
Why Did We Choose Poop?
Unlike litter or noise complaints, lingering poop on the streets can have a serious impact on the health of people living or working in the area. It’s well known that San Francisco is currently facing a huge urban crisis with its rising homeless population which has been caused partially by the rising cost of living and housing shortage. Using the power of data analysis, we hope to generate awareness around this urban crisis and help the city’s most vulnerable.


