In 2018, finding an apartment in NYC continues to be the easiest part of the process– finding a place you actually want to live, on the other hand, is much more difficult. In the hustle and bustle of NYC, some people put a huge emphasis on peace and quiet, preferring for their apartment to be a place of respite. With that in mind, RentHop’s data science team took a look at noise complaints in the city to give you a better understanding of which neighborhoods are the noisiest.
Key Findings:
-
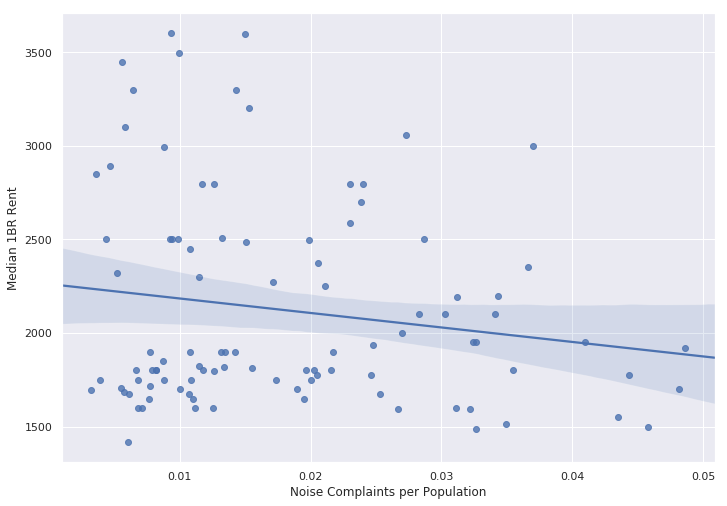
- There is only a slight negative correlation between noisy neighborhoods and median 1BR rental prices. This means that you don’t have to pay a fortune to find a quiet neighborhood!
- The quietest neighborhoods per borough (measured by noise complaints per capita in 2018):
Manhattan: The Upper East Side takes the cake in Manhattan for the quietest neighborhood with only .00359 noise complaints per capita.
Brooklyn: Borough Park is the quietest neighborhood in Brooklyn with only .00324.
Queens: Bayside Hill in Queens with only .00388 noise complaints per capita in 2018.
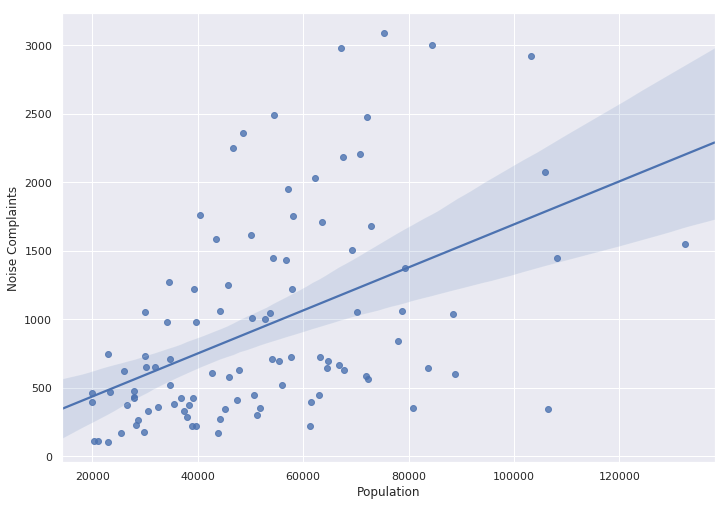
Bronx: Parkchester takes the cake for the quietest neighborhood with only .00603. - More populous neighborhoods don’t necessarily have higher numbers of noise complaints – there’s only a 47% correlation between population and noise complaints filed.
- In the neighborhoods we analyzed, noise complaints are down roughly 6.8% year over year.
The Map Below Shows Noise Complaints by Neighborhood:
By clicking on any of the community areas highlighted in green (with shades of green varying by the noise complaints per capita), you can see statistics for a given neighborhood like the community area’s population, its median 1-bedroom rent, the number of noise complaints in 2018, and the noise complaints reported per capita.
Note that the areas highlighted in gray refer to areas that had insufficient data (either by nature of the areas being nonresidential, less reliable rental data, etc.)
You can also look at individual neighborhoods using the following data table:
Note that you can sort on any of the fields by clicking the header column.
By Borough, the top 2 quietest and noisiest neighborhoods:
Manhattan:
-
- The Upper East Side is the quietest neighborhood, with only .00359 noise complaints per capita.
- The second quietest neighborhood in Manhattan is the Lenox Hill / Roosevelt Island neighborhood, with .00437 noise complaints per capita.
- The noisiest neighborhood in Manhattan is Hamilton Heights, with .0486 noise complaints per capita, over 10x more than in the Upper East Side!
- Second noisiest is the Marble Hill / Inwood neighborhood, with .0481 noise complaints per capita.
Brooklyn:
-
- Borough Park is the quietest neighborhood in Brooklyn with only .00324 noise complaints per capita.
- The Brooklyn Heights / Crown Hill neighborhood is the second quietest, with only .00467 noise complaints per capita.
- The noisiest neighborhood in Brooklyn is the DUMBO / Downtown Brooklyn area, with .0369 noise complaints per capita – like Manhattan, this is a gigantic increase over the quietest neighborhood.
- Bushwick South is the second noisiest neighborhood in Brooklyn, with .0343 noise complaints per capita.
Queens:
-
- Bayside Hills is the quietest neighborhood in Queens, with only .00388 noise complaints per capita.
- Elmshurst / Maspeth is the second quietest neighborhood, with only .00662 noise complaints per capita.
- The noisiest neighborhood in Queens is Woodhaven, with .0252 noise complaints per capita.
- The second noisiest neighborhood in Queens is Queensbridge, with .0230 noise complaints per capita.
The Bronx:
-
- Parkchester takes the cake for the quietest neighborhood in the Bronx with only .00603 noise complaints per capita.
- The second quietest neighborhood in the Bronx is Pelham Bay, with .0142 noise complaints per capita.
- The noisiest neighborhood in the Bronx is Bedford Park / Fordham North, with .0457 noise complaints per capita.
- Norwood is the second noisiest neighborhood in the Bronx, with .0435 noise complaints per capita.
Methodology and Insights
To make the above Map and data table, we used data from NYC’s open data portal, pulling 2018 year-to-date data. Then, to normalize the data, we pulled population data by NTA (neighborhood tabulation area) code provided by the NYC government.
For median 1-bedroom rental prices, we used RentHop’s proprietary rental data over the 2018 year-to-date, focusing on areas where we had sufficient rental data.
In order to assess the correlation between median 1-bedroom rental prices and noise complaints per capita, we plotted the two against one another and calculated the correlation coefficient. There is a slight negative correlation between median 1-bedroom rent prices and noise complaints per capita (-0.162), which states that as rents increase, observed incidence of noise complaints per capita decreases. Despite this slight negative correlation, however, the notion that correlation does not imply causation remains. As is evidenced by certain neighborhoods with high rents still having high noise complaints per capita (e.g. in the DUMBO / Downtown Brooklyn area), higher housing prices do not necessarily mean that a neighborhood will be less noisy (in fact some people specifically prefer neighborhoods with a more vibrant nightlife and will be willing to pay more for it!).
Lastly, we want to point out that while there’s a modest correlation (roughly 47%) between neighborhood population and total noise complaints (see graph below), it’s not all encompassing, and we acknowledge there are some confounding effects at play. For example, some neighborhoods may have larger populations of people who are inclined to make noise complaints relative to their total population. Furthermore, some neighborhoods (and their residents) may value peace and quiet more than others, causing them to make more noise complaints than they otherwise would to perpetuate said peace and quiet.
Year over Year changes
Is New York City truly the city that never sleeps? We’ve identified the quietest neighborhoods in 2018, but have also pulled the same data for 2017 (adjusting for months so that we’re making apples-to-apples comparisons). In the table below, you can see how the number of noise complaints differs from 2017 to 2018 over the same time period. In total, noise complaints in the analyzed neighborhoods have dropped by 6.8% year over year!
What does this mean for you?
While there’s no escaping the noisiness of New York City, having insight into which neighborhoods are noisiest can be an important data point in your apartment search. This combined with avoiding rats and potentially saving rent by adding onto your commute can be an important consideration when thinking about where you want to move in New York City.


