If you haven’t heard, the U.S. is the only country that refused to sign the Stockholm Declaration, an agreement pledging to eliminate traffic deaths by 2050. While we respect the administration’s decision and know that road safety shares its utmost priority on the agenda, we cannot deny the cost we have to pay in exchange for mobility. Traffic fatalities have generally gone down in major global cities and even decreased to zero in places like Helsinki and Oslo, but that, sadly, is not the case in the U.S.
In 2019, the country as a whole saw more pedestrian and cyclist deaths even though the total number of traffic fatalities was in decline, and such a trend did not spare Denver. For the second time since the Vision Zero program was launched, Denver saw more than 60 traffic deaths even though the number of traffic accidents went down by 2.6%. Indeed, progress is not always linear, and we should not be discouraged. However, this reiterates the importance of adding bike lanes, expanding sidewalks lowering speed limits, and redesigning certain street intersections.
To help generate awareness on traffic fatalities, we at RentHop took a look at the traffic accidents data in the past year, and here’s what we’ve found:
- While traffic incidents declined in around 62% of the neighborhoods in Denver, the number of persons seriously injured due to traffic collisions rose in 31, or 40% of the neighborhoods. Meanwhile, 31% of the neighborhoods experienced an increase in traffic deaths, including Westwood (+4), West Colfax (+3), and Montbello (+2). [Map]
- While Marston is considered one of the safest neighborhoods (ranked 75 among all 78 neighborhoods with only 11.0 collisions/1k population), the neighborhood, unfortunately, experienced three deaths in 2019. [Table]
- Meanwhile, 493 traffic crashes occurred in DIA, which translates to 423.2 collisions/1k pop, making it the most dangerous neighborhood in Denver when it comes to traffic safety. [Table]
- 2019 was a good year for residents in Globeville. The neighborhood, home to over 3,500 people, ranks the fifth in terms of th total number of traffic collisions. However, the number, in fact, did improve by 11.1%, from 673 in 2018 to 598 in 2019. The fatality count also improved from three to zero.
- While the number of collisions did decrease in Congress Park, the neighborhood saw two traffic deaths and 13 people were seriously injured in 2019.
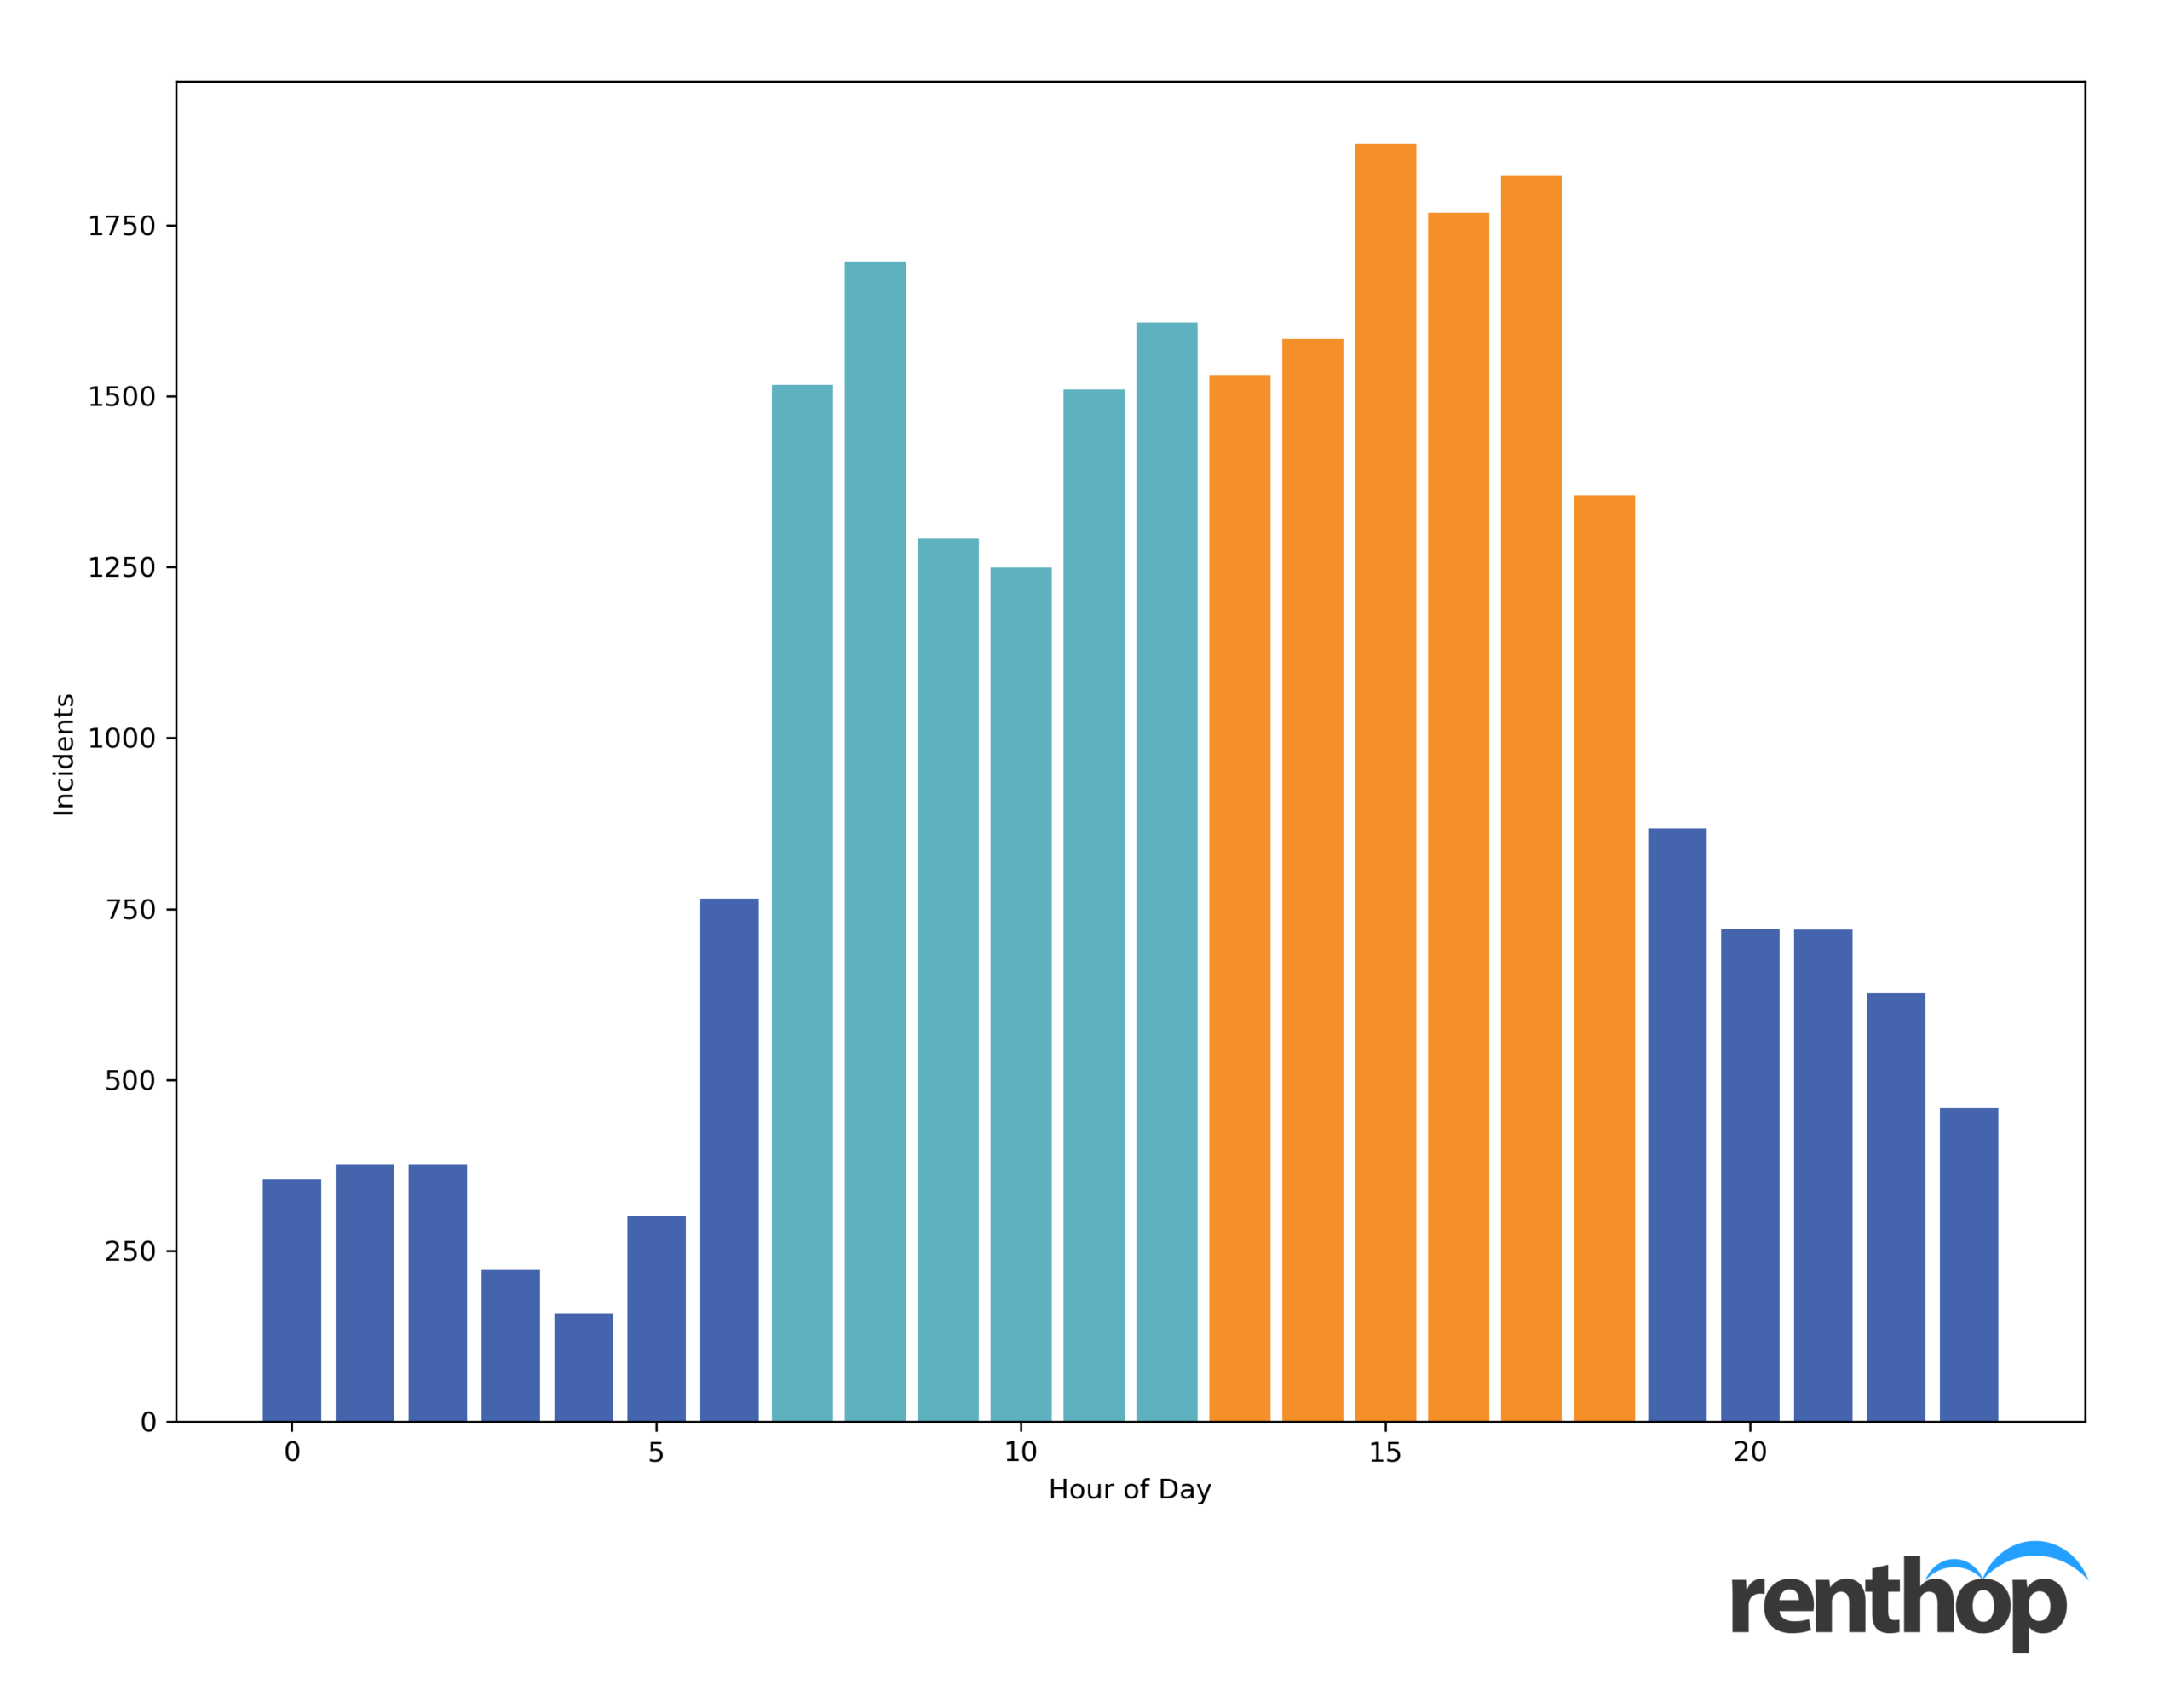
- In 2019, more traffic collisions occurred in the afternoon (12 PM – 5 PM) than any other parts of the day. [Figure 1]
2019 Denver Traffic Fatalities Map
The interactive map below highlights the traffic safety of Denver neighborhoods. The lighter shade indicates a decrease in the number of traffic fatalities from 2018 to 2019, whereas dark blue indicates an increase in the number of traffic fatalities. You can click on the neighborhoods to learn more about the total number of motor vehicle collisions, the number of collisions/10,000 population, the total number of persons injured, fatalities, as well as year-over-year change.
Based on our analysis, while traffic incidents went down in around 62% of the neighborhoods, certain neighborhoods saw more casualties in 2019. The number of persons seriously injured due to traffic collisions rose in 31, or 40% of the neighborhoods and 31% of the neighborhoods experienced an increase in traffic deaths, including Westwood (+4), West Colfax (+3), and Montbello (+2).
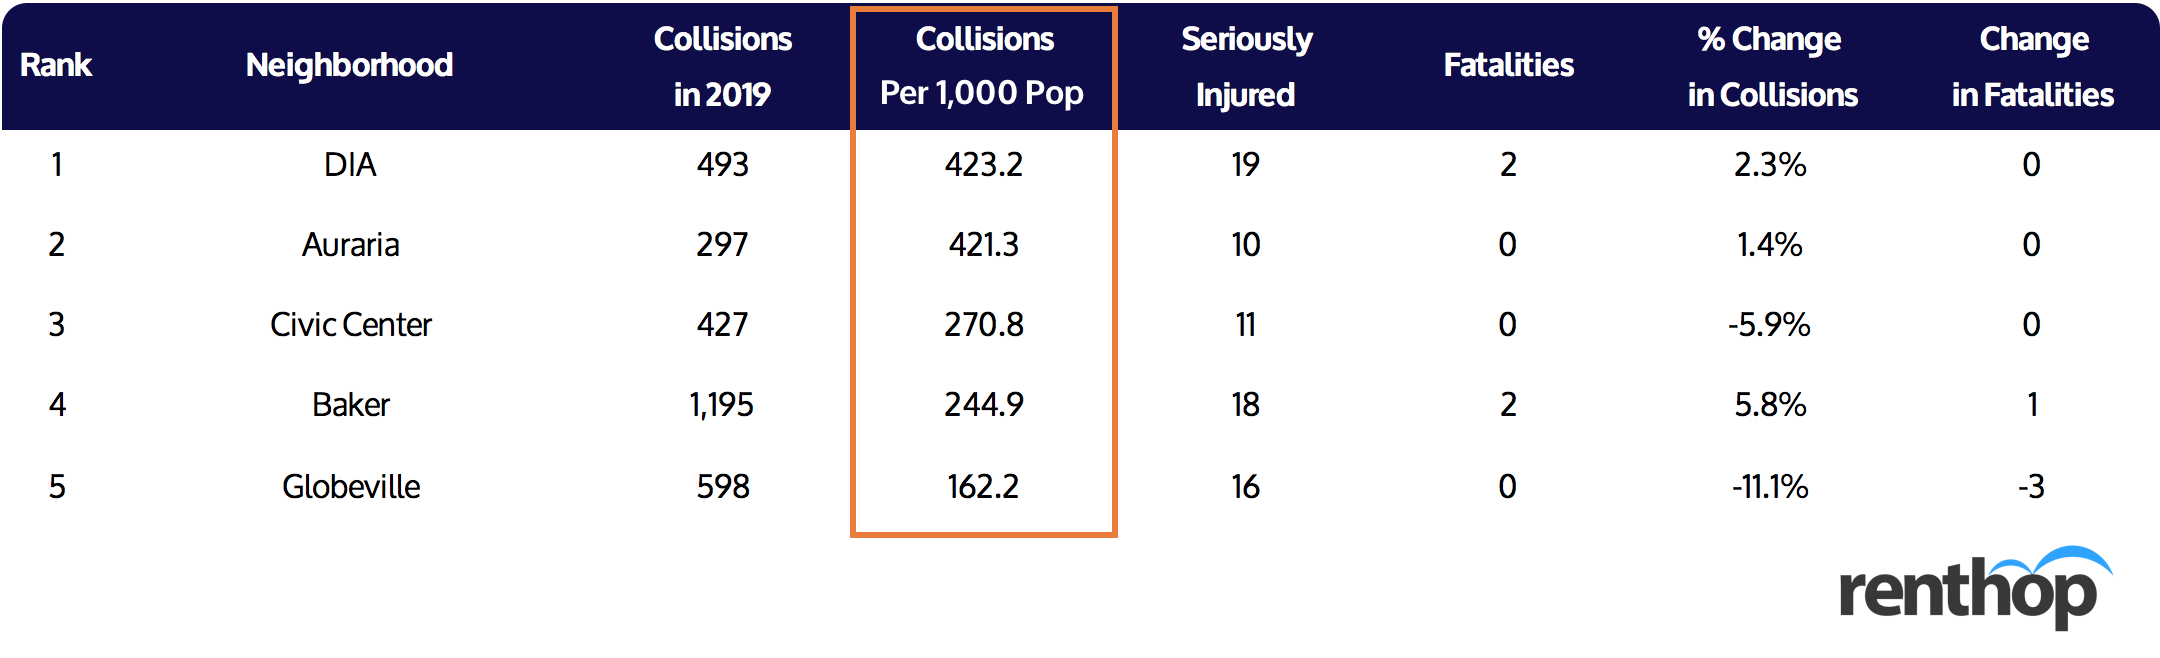
5 Neighborhoods with the Most Motor Vehicle Crashes
The area around the airport tops all neighborhoods as the area with the most accidents/1,000 population in 2019, with 423.2 collisions/1,000 population in 2019, 2.3% higher than in 2018. Auraria, the neighborhood right by the CBD, ranks second, with the number of accidents growing 1.4% from 2018 to 2019. Both of these neighborhoods, however, did not experience any changes in fatalities. Meanwhile, in Baker, both the number of crashes and fatalities went up in the year 2019. Wile Civic Center and Globeville are still some of the most dangerous neighborhoods when it comes to traffic safety, both saw fewer crashes this past year. Globeville, specifically, saw a great improvement in the number of deaths, from three in 2018 to zero.
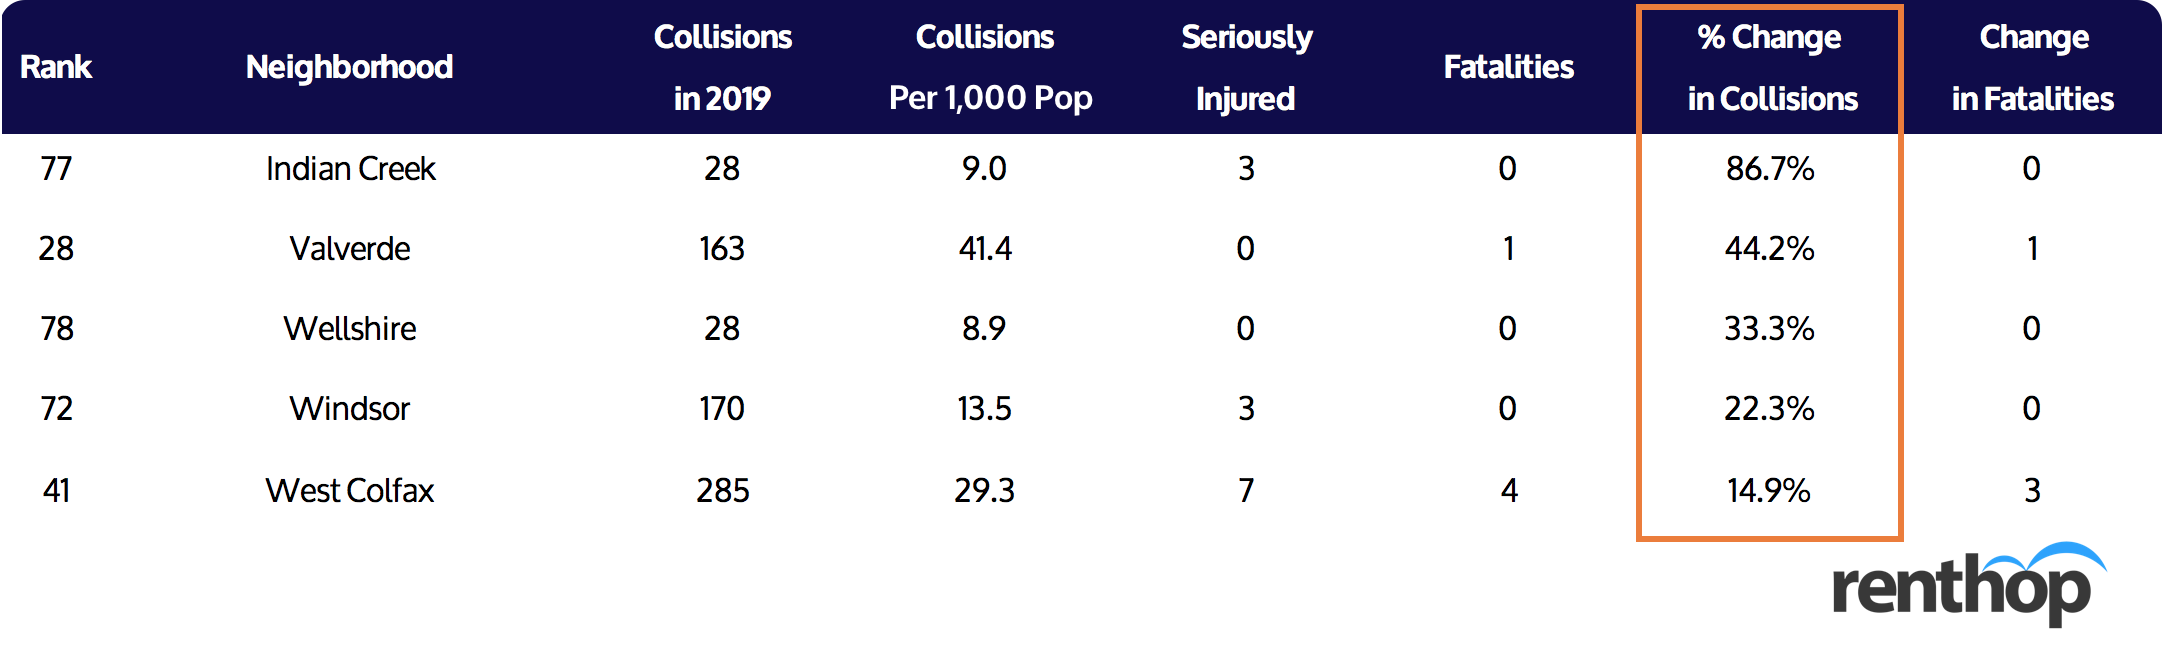
5 Neighborhoods with the Highest Increase in Motor Vehicle Crashes
In terms of year-over-year changes, Indian Creek saw the most drastic increase from the year 2018 to 2019. In 2019, the neighborhood had a total of 28 incidents, which equals a 67.6% increase from 2018. Meanwhile, while the number of motor vehicle crashes in West Colfax only grew by 14.9%, the number of fatalities rose from one to four, which translates to a 300% increase.
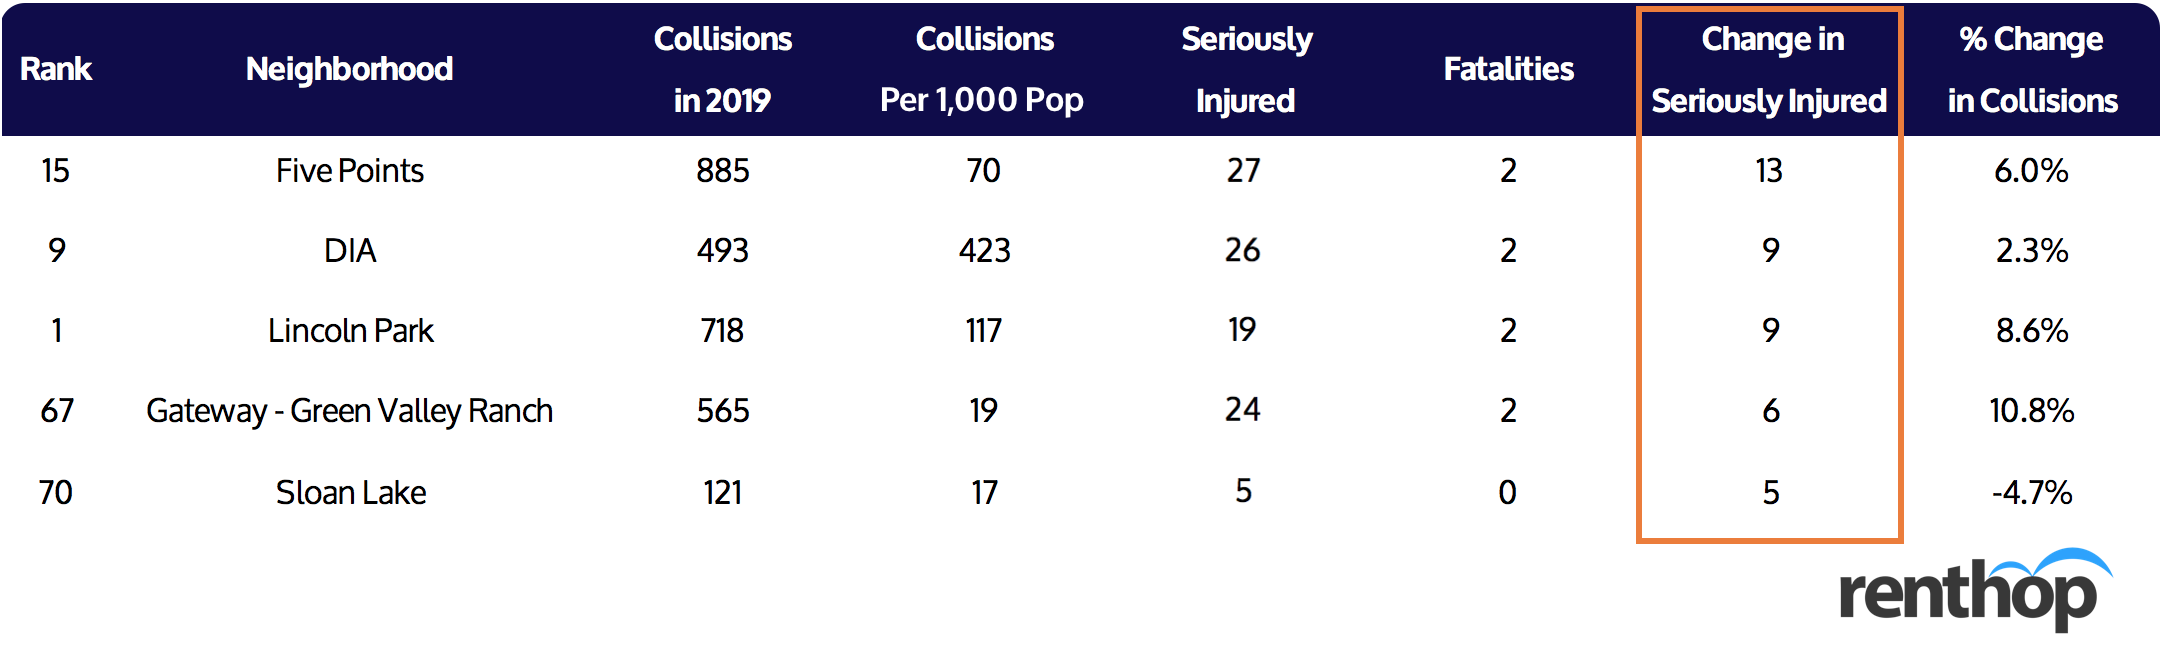
5 Neighborhoods with the Highest Increase in Persons Seriously Injured
Next, we move our focus onto persons seriously injured in motor vehicle crashes by neighborhood and year-over-year changes among the numbers. Five Points, which ranks the sixth in terms of crashes/1,000 pop, saw the most drastic increase in persons seriously injured from 2018 to 2019. In 2019, 14 people were seriously injured in motor vehicle crashes in Five Points, 13 more than in the year 2018. The neighborhood also saw 6.0% more traffic accidents this past year. In Gateway – Green Valley Ranch, as the number of collisions jumped by 10.8%, the number of persons seriously injured also increased from 18 to 24. As for Sloan Lake, while the number of collisions did go down by 4.7% to 121, or 17 collisions/1,000 pop, the number of persons seriously injured did, in fact, go up to five.
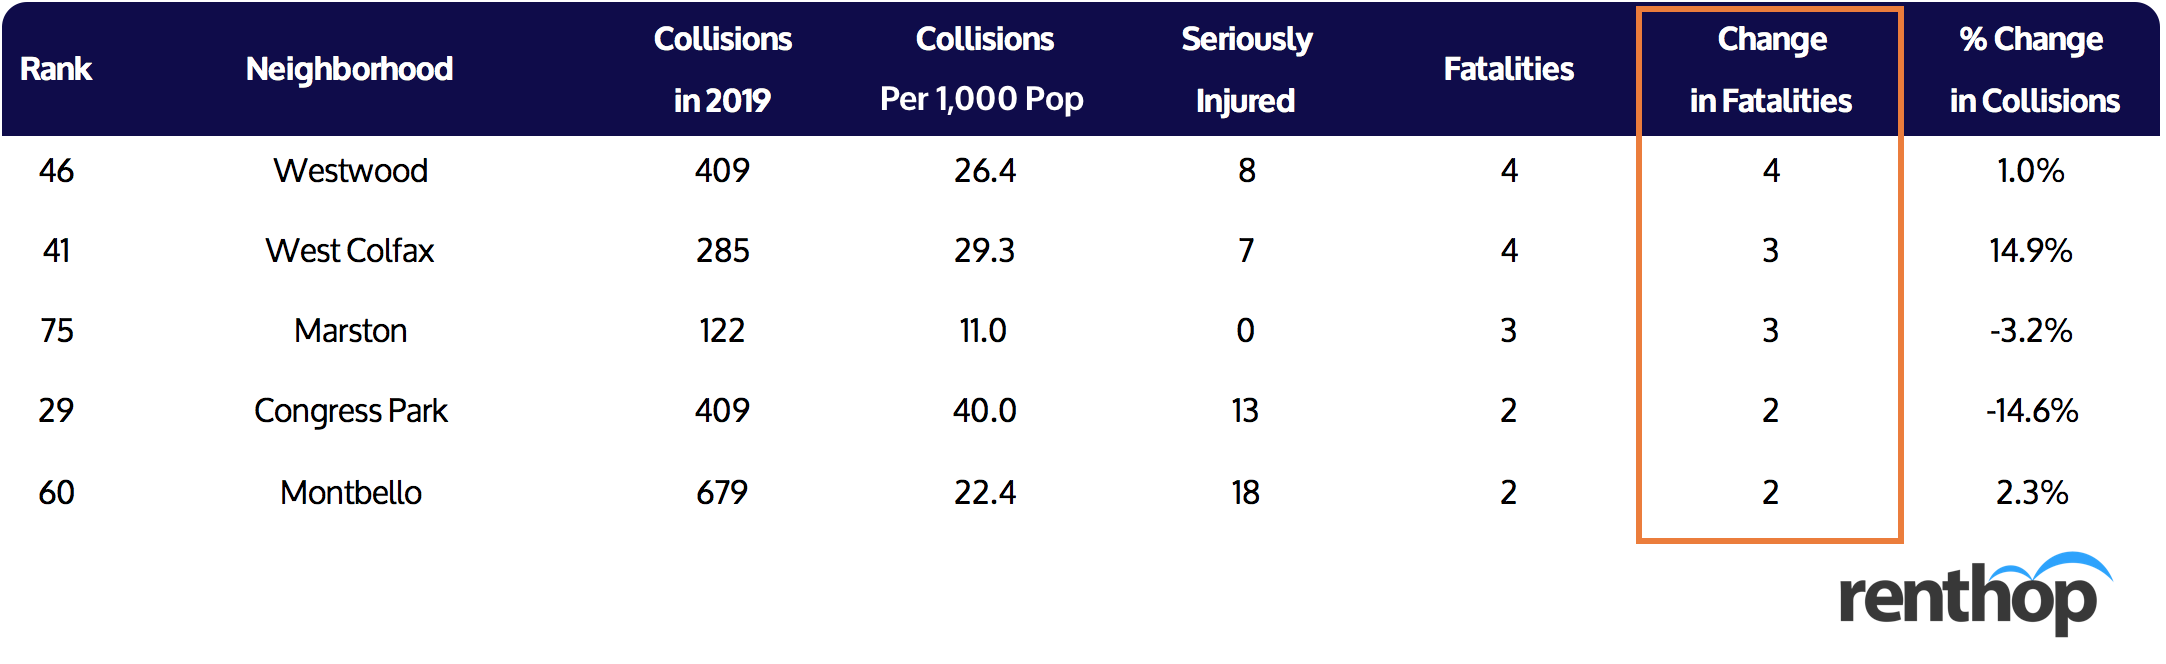
5 Neighborhoods with the Highest Increase in Persons Killed
As for traffic fatalities, West Colfax, Westwood, and Overland all saw some of the worst fatalities in the City of Denver. The number of fatalities reached four in Westwood in 2019, a big jump from zero in 2018. In West Colfax, the number of persons killed during motor vehicle crashes rose from one to four, which equals a 300% increase year over year. While the number of incidents did dip in Congress Park, the neighborhood still experienced an increase in fatalities, from zero to two in 2019.
Are there Any Patterns?
When Do Traffic Collisions Occur?
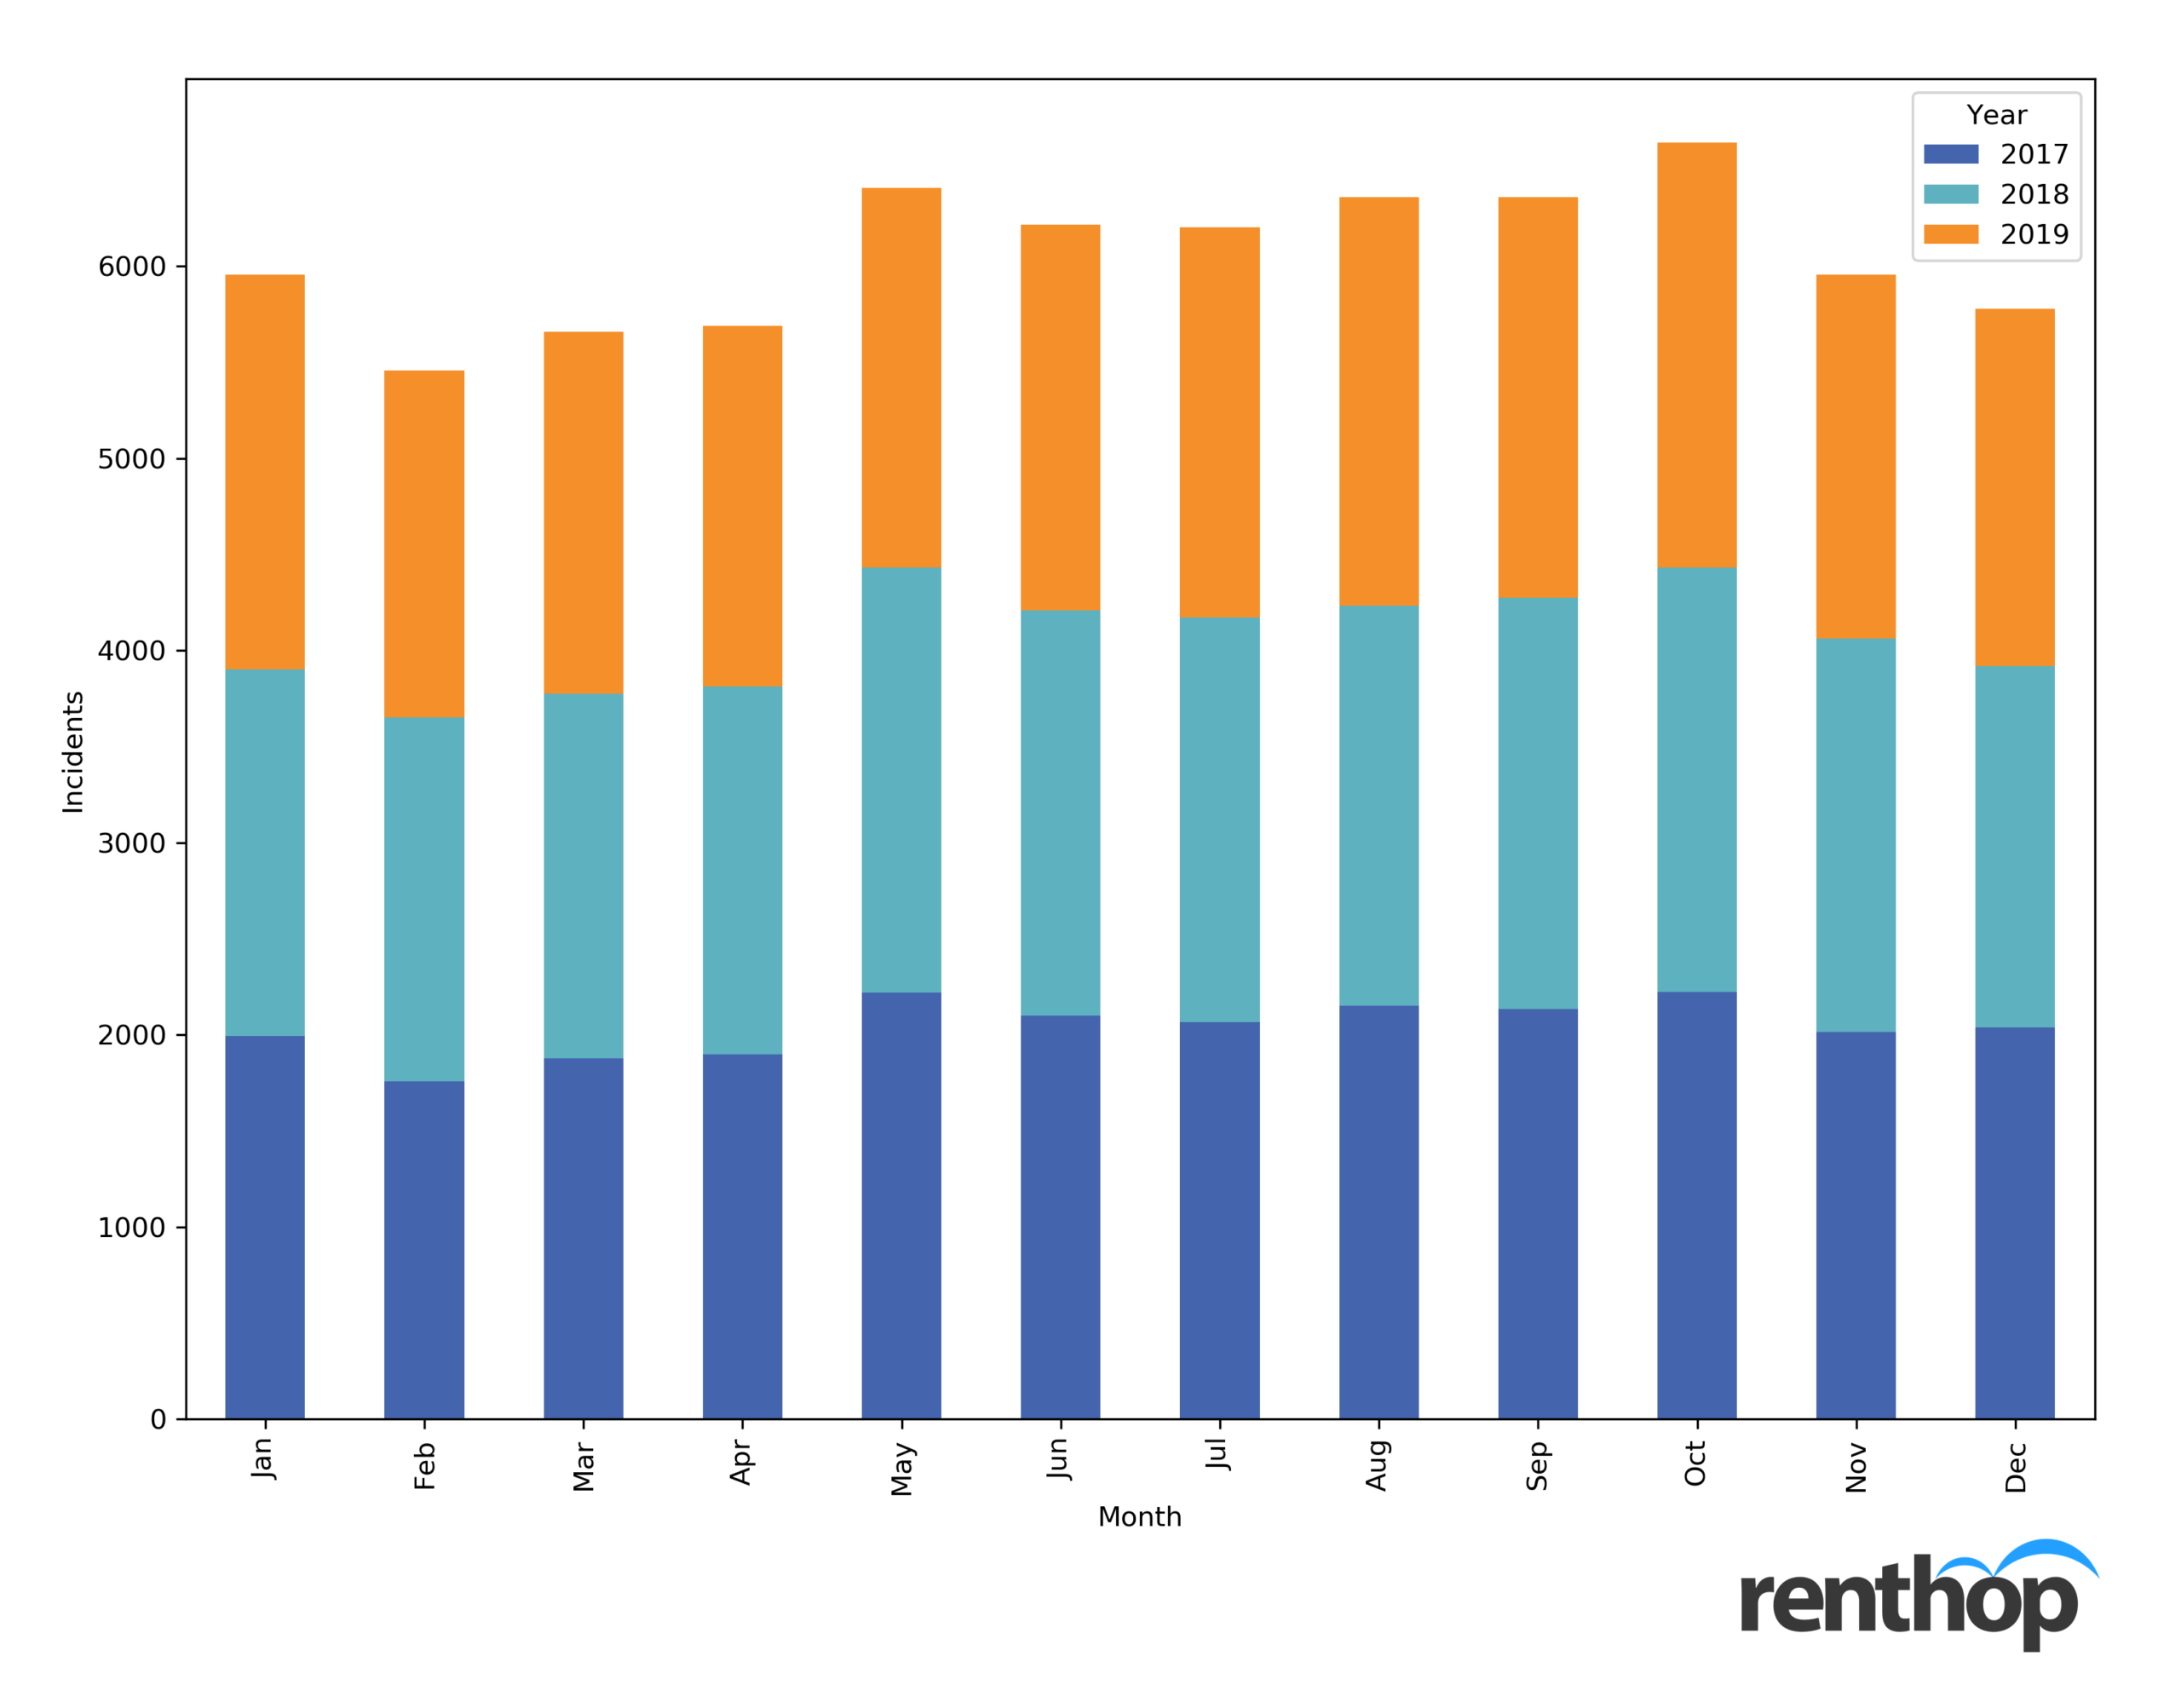
In addition to analyzing the locations of the traffic collisions and deaths, we also looked into when they occur. Figure 1 below shows the number of collisions from 2017 to 2019 broken down by months. While there’s no obvious seasonality in terms of when collisions occurred more often, we did notice more motor vehicle collisions in October, followed by May. We also found, as illustrated in Figure 2, that more collisions occurred in the afternoon (9,917 between 12 PM and 5 PM vs. 8,860 between 7 AM and 12 PM) in the year 2019. So, if you enjoy outdoor walking during summertime, be sure to avoid dangerous intersections, and don’t forget your helmet if you are a biker!
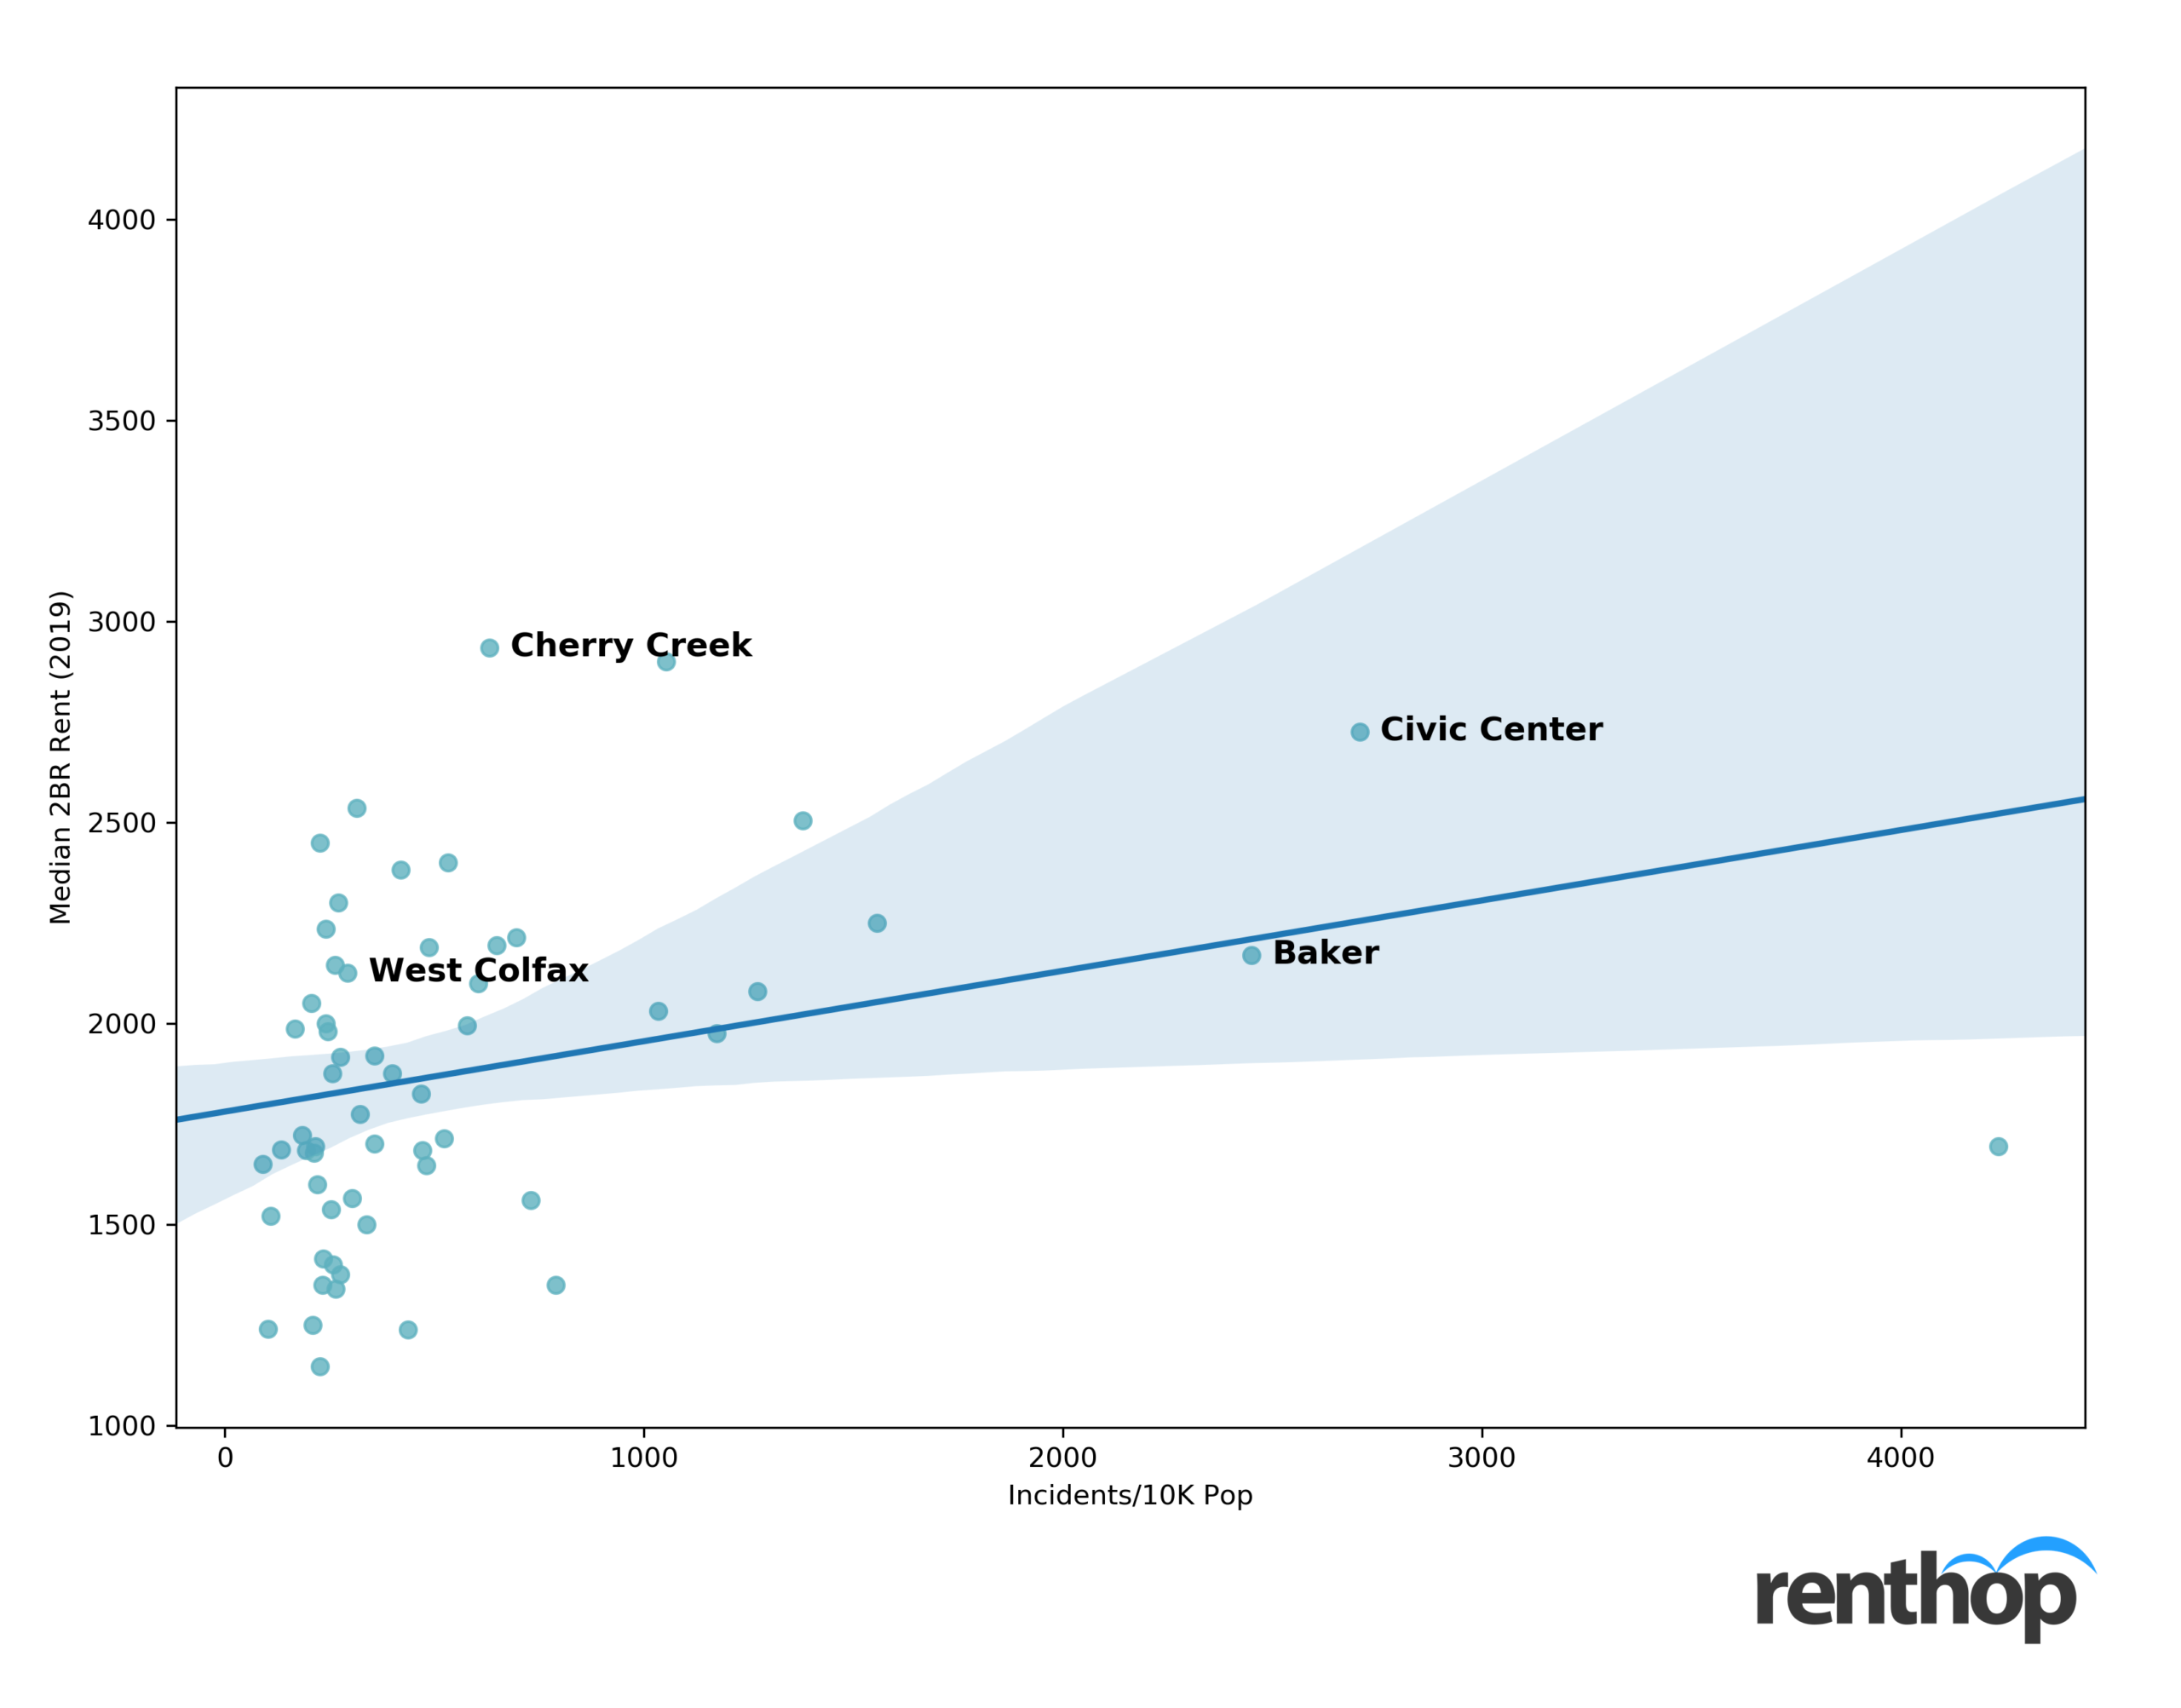
Are the Numbers of Collisions Related to Rent?
We also looked into the correlation between median two-bedroom rent and the number of collisions/10k population, with the rent as the independent variable, and found no correlation. In other words, there seems to be no relationship between how high the rent is and the number of collisions occurred within a neighborhood. It seems that neighborhoods in and surrounding the CBD did see more collisions in 2019, potentially due to the robust business activities and traffic. Apartments in these neighborhoods, thanks to the prime location, tend to enjoy higher rental rates, but this does not explain all Denver neighborhoods.
How We Did It
To better understand traffic safety in Denver, we at Renthop analyzed traffic accidents data made public by the Denver Open Data Portal. We first geocoded each record using the Statistical Neighborhood shapefile and then normalized the data using the neighborhood population count so we could fairly rank each neighborhood.
Why We Did It
In many ways, living in major urban hubs is a blessing. Cities offer great mobility and give renters as well as homeowners the ability to live in their dream homes and commute to the city center for work without being worried about getting stuck in traffic for hours (yes, Bay Area). But the busy lifestyle and robust business activities also have their externalities, and one of them is traffic safety. In some cases, drivers settle the problems without anyone getting i; in other cases, pedestrians and cyclists are the ones bearing the brunt.
By adopting a data-driven approach to collisions and traffic fatalities, we hope to not only help renters and homebuyers identify potential safety issues they might face in their neighborhood but also generate awareness on traffic deaths. After all, each data point we included in this study represents one life, and that could be our coworkers, friends, or family.


