Baltimore is infamous for its high crime rate. According to the most recent UCR statistics released by the FBI, Baltimore is one of the most dangerous places among the top 50 most populous cities. Criminals prowl the streets of Baltimore, and it is so bad that Gov. Larry Hogan of Maryland openly challenged the State’s attorney general to investigate and prosecute more crimes. The state even pledged $21 million to help fight crime in the city and endorsed the use of surveillance planes. Exactly how dangerous is Baltimore? And where should you go if you care about safety?
To better understand the criminal activity in Baltimore, the data science team at RentHop looked into the crime data released by the Baltimore Police Department, and here are our key findings:
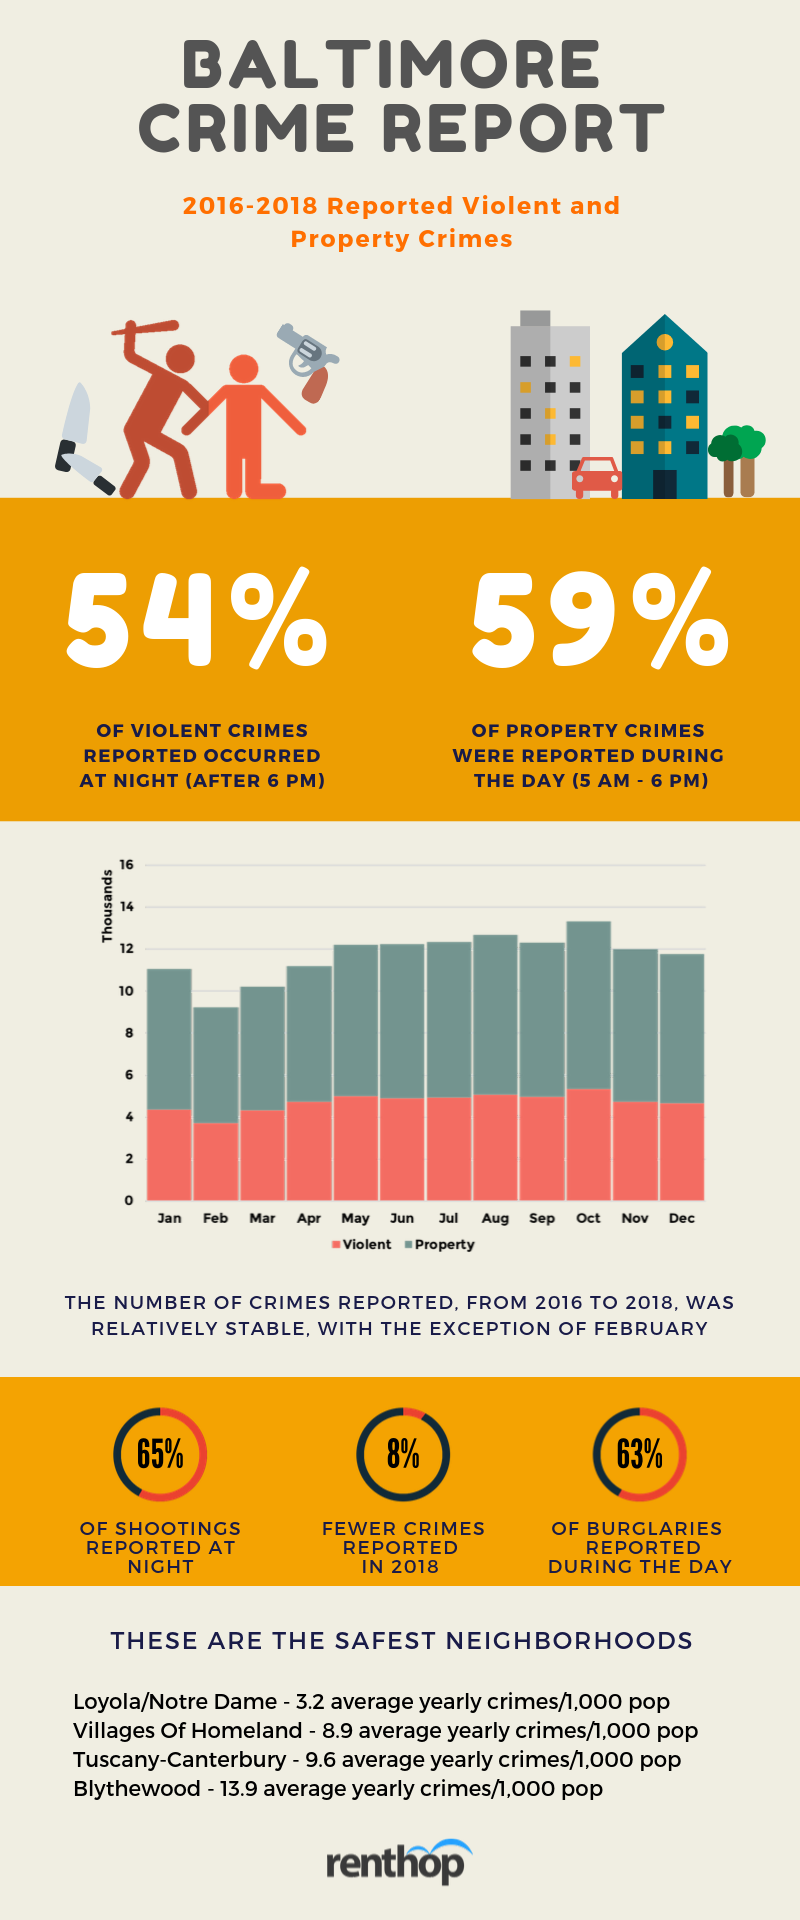
- Baltimore saw fewer crimes in the past year. In 2018, 45,601 crimes were reported to the Baltimore Police Department, 7.2% fewer than in 2017.
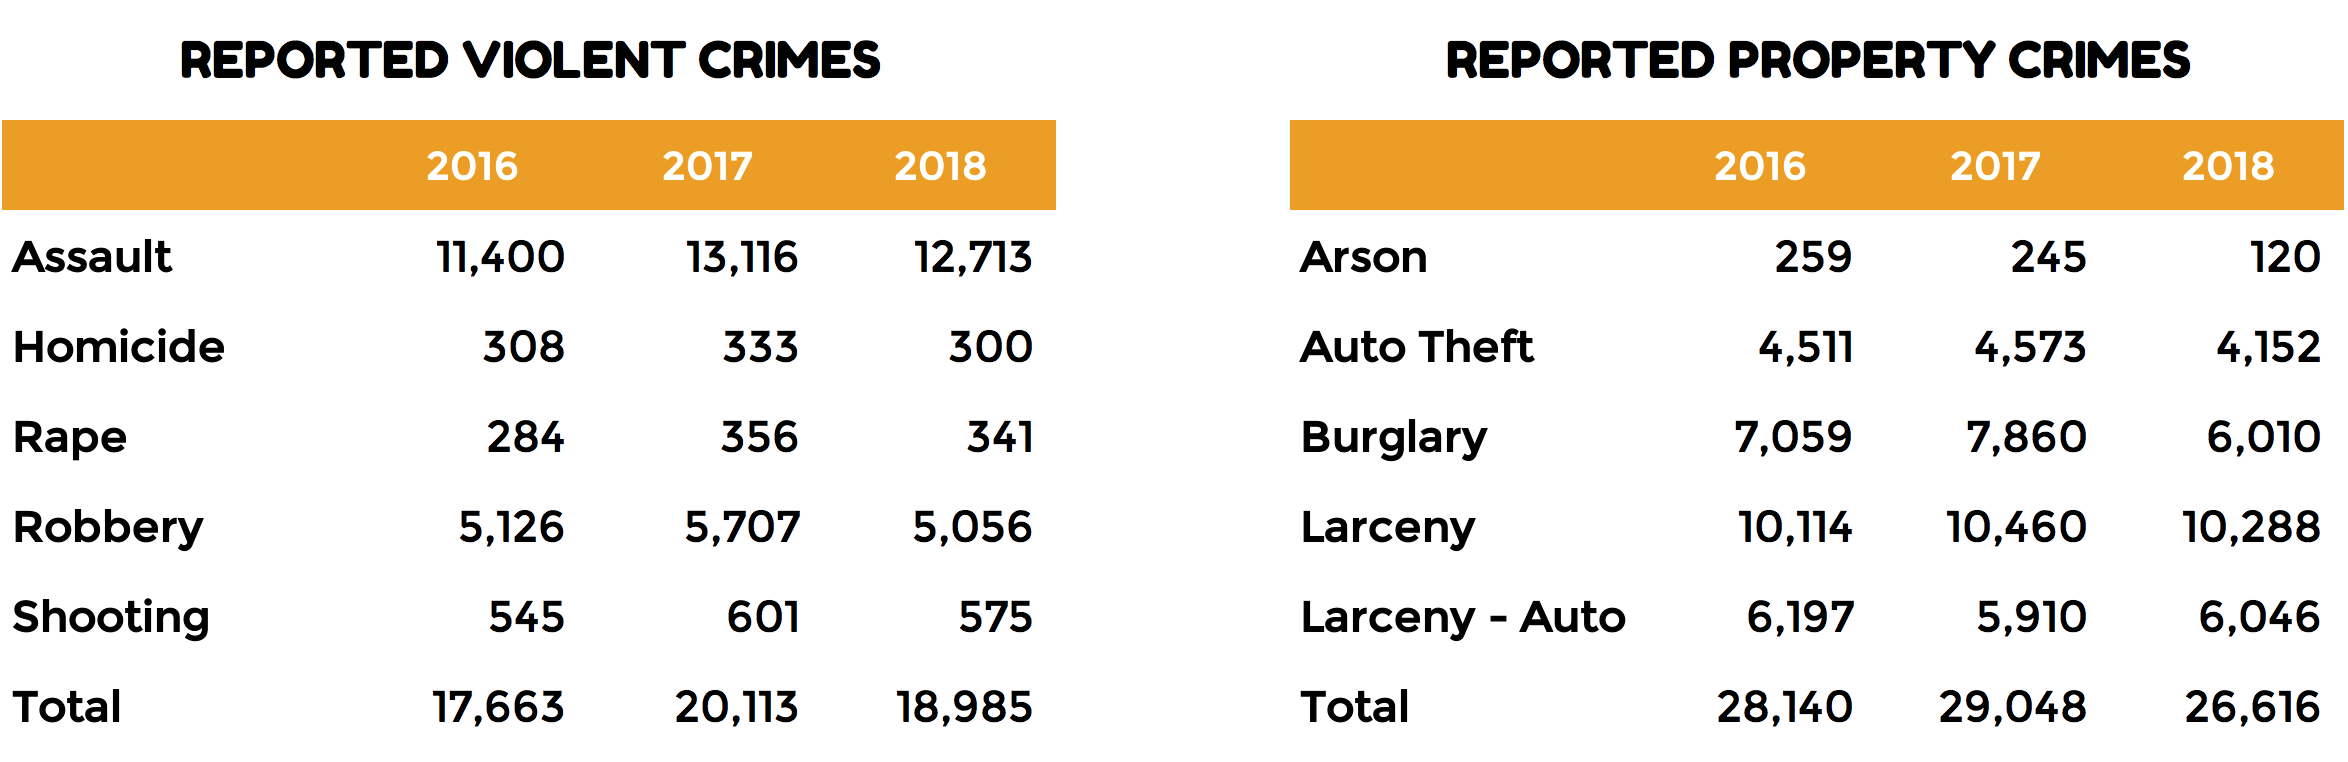
- Baltimore experienced more property crimes than violent crimes. According to the BPD data, over 26,000 crimes (58%) reported were property crimes in 2018, compared to 18,985 violent crimes.
- Loyola/Notre Dame, among all neighborhoods, is the safest place in Baltimore. The neighborhood only saw 3 violent crimes and 5 property crimes in 2018, which translates into 2.5 crimes/1,000 pop.
- Pulaski Industrial Area, on the other hand, is the most dangerous neighborhood, with a crime rate of average yearly 2,520.3 crimes per 1,000 population. In 2018, the neighborhood saw 75 violent crimes and 216 property crimes, of which 133 were larceny.
- 54% of the violent crimes were reported at night (after 6 PM), whereas 59% of the property crimes were reported during the day.
Crimes in Baltimore– Where Does Your Neighborhood Stand?
The interactive map below shows the number of crimes reported by neighborhoods. The darker the shade, the more crimes reported from 2016 to 2018. Note that, in order to rank impartially, we normalized the crime data by the population count in each neighborhood. Why did we do that? Hypothetically, neighborhoods with denser populations might see more criminal activities and normalization allows us to fairly compare the number of crimes from different neighborhoods.
We can tell from the shades that, generally, Northeast Baltimore is safer compared to other parts of the city and it doesn’t seem like there’s any correlation between crime rates and proximity to the city center. Pulaski, Hopkins Bayview, Johns Hopkins Homewood, and Fairfield Area, among others, have more average yearly crimes per 1,000 population. Meanwhile, Loyola/Notre Dame, Villages Of Homeland, and Tuscany-Canterbury are some of the safest neighborhoods in Baltimore. The orange clusters show the locations of all crimes reported in 2018. Click on the clusters to zoom in, and you can reset the map by clicking on the ‘reset’ button in the upper left corner.
Is Baltimore Safer than Before?
Just last month, Gov. Larry Hogan called for the City of Baltimore to investigate and prosecute more crimes, particularly gang activities, violent crimes, and gun crimes. The lack of resources has made it difficult for law enforcement to reduce crime rates, but that does not mean things are not progressing. In fact, the number of crimes reported to the Baltimore Police Department did go down in 2018. Looking at the crime data in the past three years, we found that 45,803 crimes were reported in 2016. The number then spiked to 49,161 in 2017. In 2018, only 45,601 crimes were reported to the Police Department, 7.2% fewer than the previous year. Of all crimes reported in 2018, 41.6% or 18,985 of them were violent crimes. This number is 5.6% lower than in 2017. The graphs below break down the crimes reported between 2016 and 2018 by year and types.
Note that the information presented in this dataset represents Part I victim based crime data. The data do not represent statistics submitted to the FBI’s Uniform Crime Report (UCR); therefore any comparisons are strictly prohibited.
What You Need to Know to Stay Safe
In addition to geographical location and relationship between crimes and renting, we also broke down reported crimes by day of the week, month, and time of the day. Below is an infographic for easy-sharing, which summarizes our findings.
Methodology
To better understand crimes in Baltimore, we pulled the crime data made public by the Baltimore Police Department. Violent crimes mainly include homicide, robbery, assault, rape, and shooting. Property crimes mainly include arson, larceny, burglary, and auto theft. We first removed duplicates based on time, date, type of crime, and location, and then geocoded each reported crime to corresponding neighborhoods using the coordinates provided by the open data portal. The neighborhood population count was retrieved from the 2010 Census Neighborhoods provided by the Baltimore Open Data portal.


