The Mile High City’s crime rate continues to skyrocket for the sixth consecutive year. According to the FBI’s crime statistics for the year 2018, Denver saw 44 crimes per 1,000 population in 2018, 1.4% more than in 2017. That said, not every Denver neighborhood experienced an equivalent rise in criminal activity. To highlight the dynamic nature of crime in Denver, we have put together an interactive map breaking down the latest crime statistics in each Denver neighborhood.
To better understand the criminal activity in Denver, the data science team at RentHop looked into the crime data released by the Denver Police Department, and here are our key findings:
- Overall, Denver saw more crimes in the past year. Looking solely the DPD data, in 2018, 93,398 crimes were reported to the Denver Police Department. This number is 0.3% higher than in 2017.
- Denver experienced more property crimes than violent crimes this past year. Of all crimes recorded in the database for the year 2018, 35% were property crimes, and 9% were violent crimes.
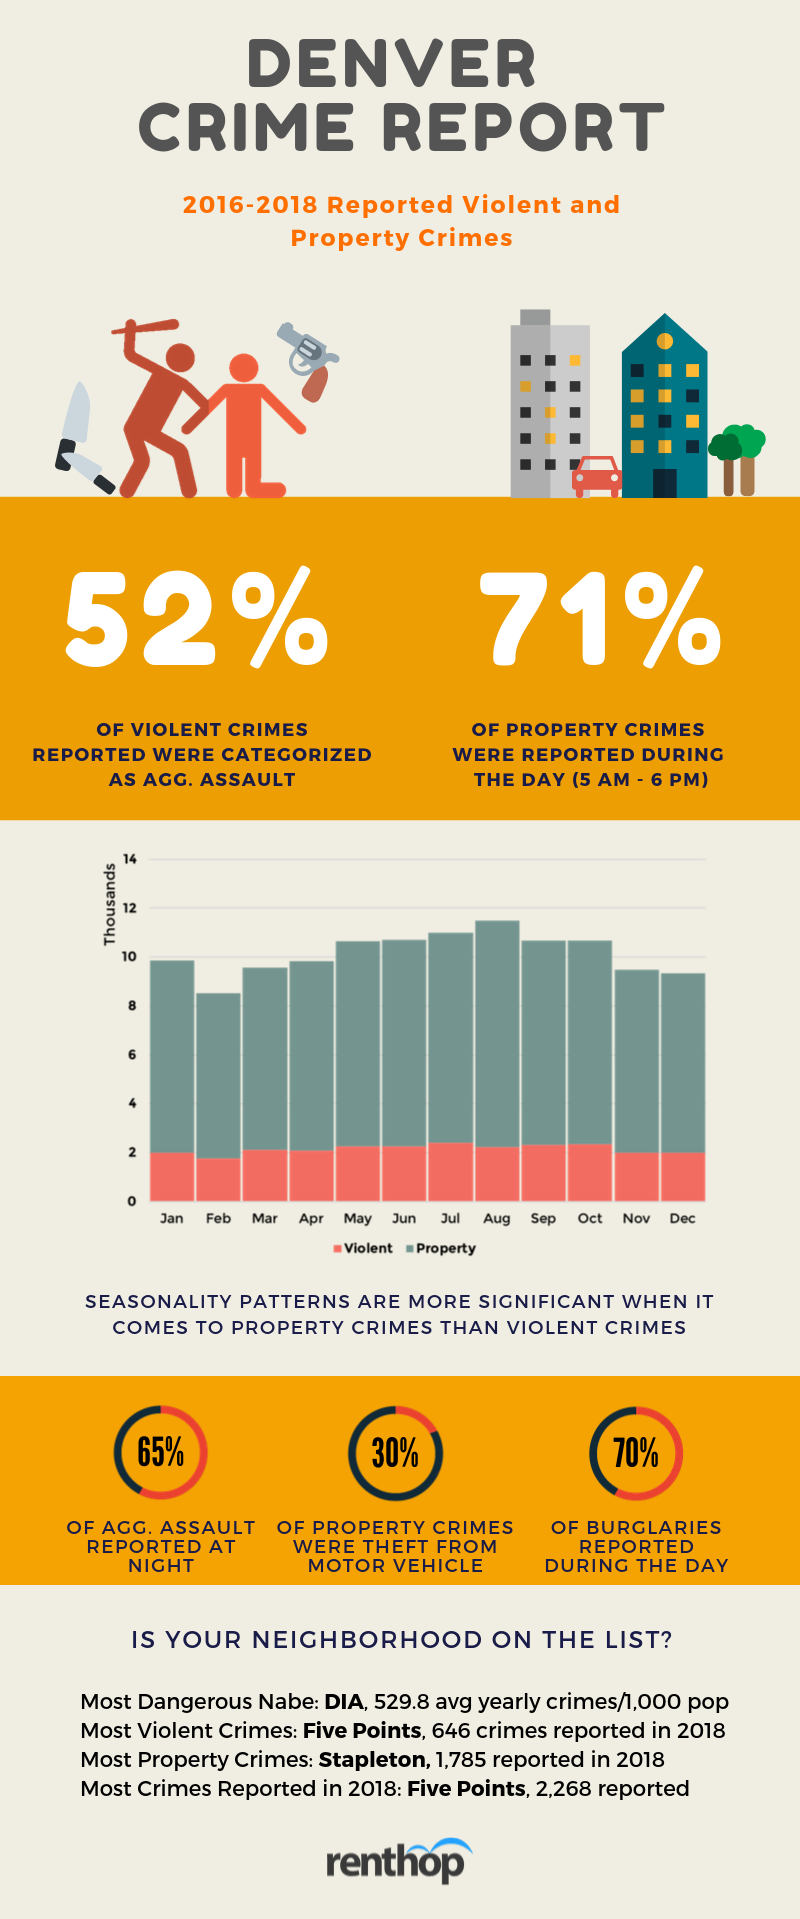
- 52% of the violent crimes reported to the Denver Police Department were categorized as aggregated assaults, of which 65% were reported at night.
- 71% of the property crimes from 2016 to 2018 were reported during the day, between 5 am and 6 pm.
- Wellshire, among all neighborhoods, is the safest place in Denver. The neighborhood only saw 8 violent crimes and 1 property crimes in 2018, which translates into 22.0 crimes/1,000 pop.
- DIA, on the other hand, is the most dangerous neighborhood, witn a crime rate of average yearly 592.8 crimes per 1,000 population. In 2018, the neighborhood saw 76 violent crimes and 746 property crimes.
Crimes in Denver – Where Does Your Neighborhood Stand?
The interactive map below shows the number of crimes reported by neighborhoods. The darker the shade, the more crimes reported from 2016 to 2018. Note that, in order to rank impartially, we normalized the crime data by the population count in each neighborhood. Why did we do that? Hypothetically, neighborhoods with denser populations might see more criminal activities and normalization allows us to fairly compare the number of crimes from different neighborhoods.
DIA, Aurora, and Civic Center, among others, have more average yearly crimes per 1,000 population. Meanwhile, Wellshire, Indian Creek, and Hilltop are some of the safest neighborhoods in Denver. The orange clusters show the locations of all crimes reported in 2018. Click on the clusters to zoom in, and you can reset the map by clicking on the ‘reset’ button in the upper left corner.
Violent Crime Volume Went Up in These Neighborhoods in 2018
- Wellshire – 3 violent crimes in 2017, 8 in 2018, +167%
- West Highland- 44 violent crimes in 2017, 59 in 2018, +34%
- University Park – 36 violent crimes in 2017, 46 in 2018, +28%
- City Park – 40 violent crimes in 2017, 50 in 2018, +25%
- Northeast Park Hill – 150 violent crimes in 2017, 187 in 2018, +25%
Property Crime Volume Went Up in These Neighborhoods in 2018
- University Hills – 311 property crimes in 2017, 422 in 2018, +36%
- Globeville- 278 property crimes in 2017, 372 in 2018, +34%
- Platt Park – 236 property crimes in 2017, 314 in 2018, +33%
- Chaffee Park – 158 property crimes in 2017, 209 in 2018, +32%
- DIA – 579 property crimes in 2017, 746 in 2018, +29%
Is the Crime Rate Going Up in Denver?
According to the FBI’s crime statistics for the year, Denver saw a 1.4% increase in crime rate (number of crimes per 1,000 population). The table below summarizes the FBI crime statistics from 2016 to 2018 by Violent Crimes and Property Crimes.
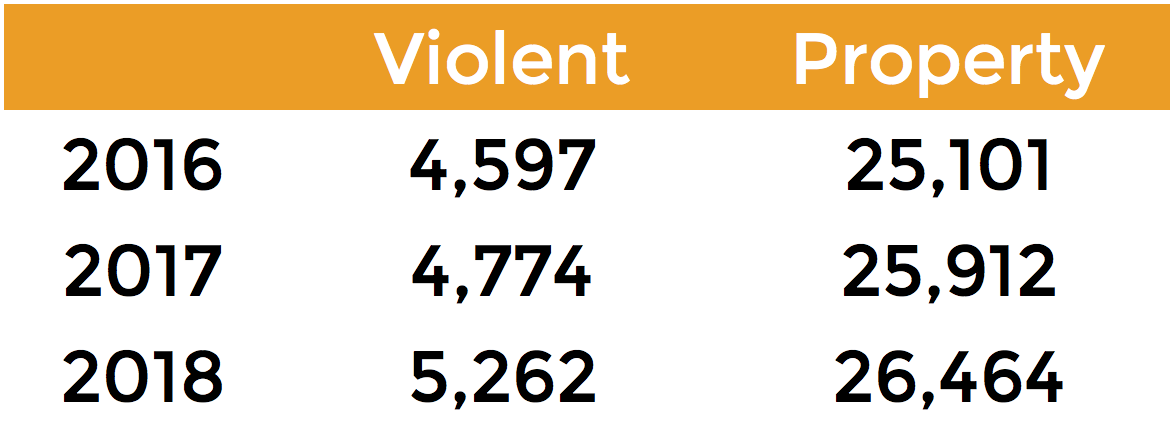
Looking at the data provided by the Denver Policce Department, we found that overall, the number of crimes reported in Denver did go up in the past few years. In total 93,069 crimes were reported in 2017, 2% higher than in 2016. Last year, around 93,400 crimes were reported.
What You Need to Know to Stay Safe
In addition to geographical location and relationship between crimes and renting, we also broke down reported crimes by day of the week, month, and time of the day. Below is an infographic for easy-sharing, which summarizes our findings.
Methodology
This study analyzed the crime data made public by the Denver Open Data portal from 2016 to 2018. Violent crimes include mainly murder, rape, sexual assault, aggrevated assault, and robbery. Property crimes mainly include arson, burglary, larceny, and theft from motor vehicle. We first removed duplicates based on time, date, type of crime, and location, and then geocoded each reported crime to corresponding statistical neighborhoods using the coordinates provided by the open data portal. The neighborhood population count was retrieved from the 2010 Census Neighborhood Demographics.


