Public safety has always been an important factor renters take into account when deciding where to live. Unfortunately, due to a sharp increase in population growth and a stagnant number of police officers available to respond to crime, Minneapolis is considered one of the top 50 most dangerous major cities in America in recent years. However, for those currently looking to live in Minneapolis, there’s a bit of a silver lining. According to the newly released FBI UCR statistics for the year 2018, Minneapolis experienced 47 crimes per 1,000 population, 18% fewer than in 2017, which was 57.4 crimes/per 1,000 population.
To help renters better understand where to live in Minneapolis, we at RentHop looked into the crime data released by the Minneapolis Police Department, and here are our key findings:
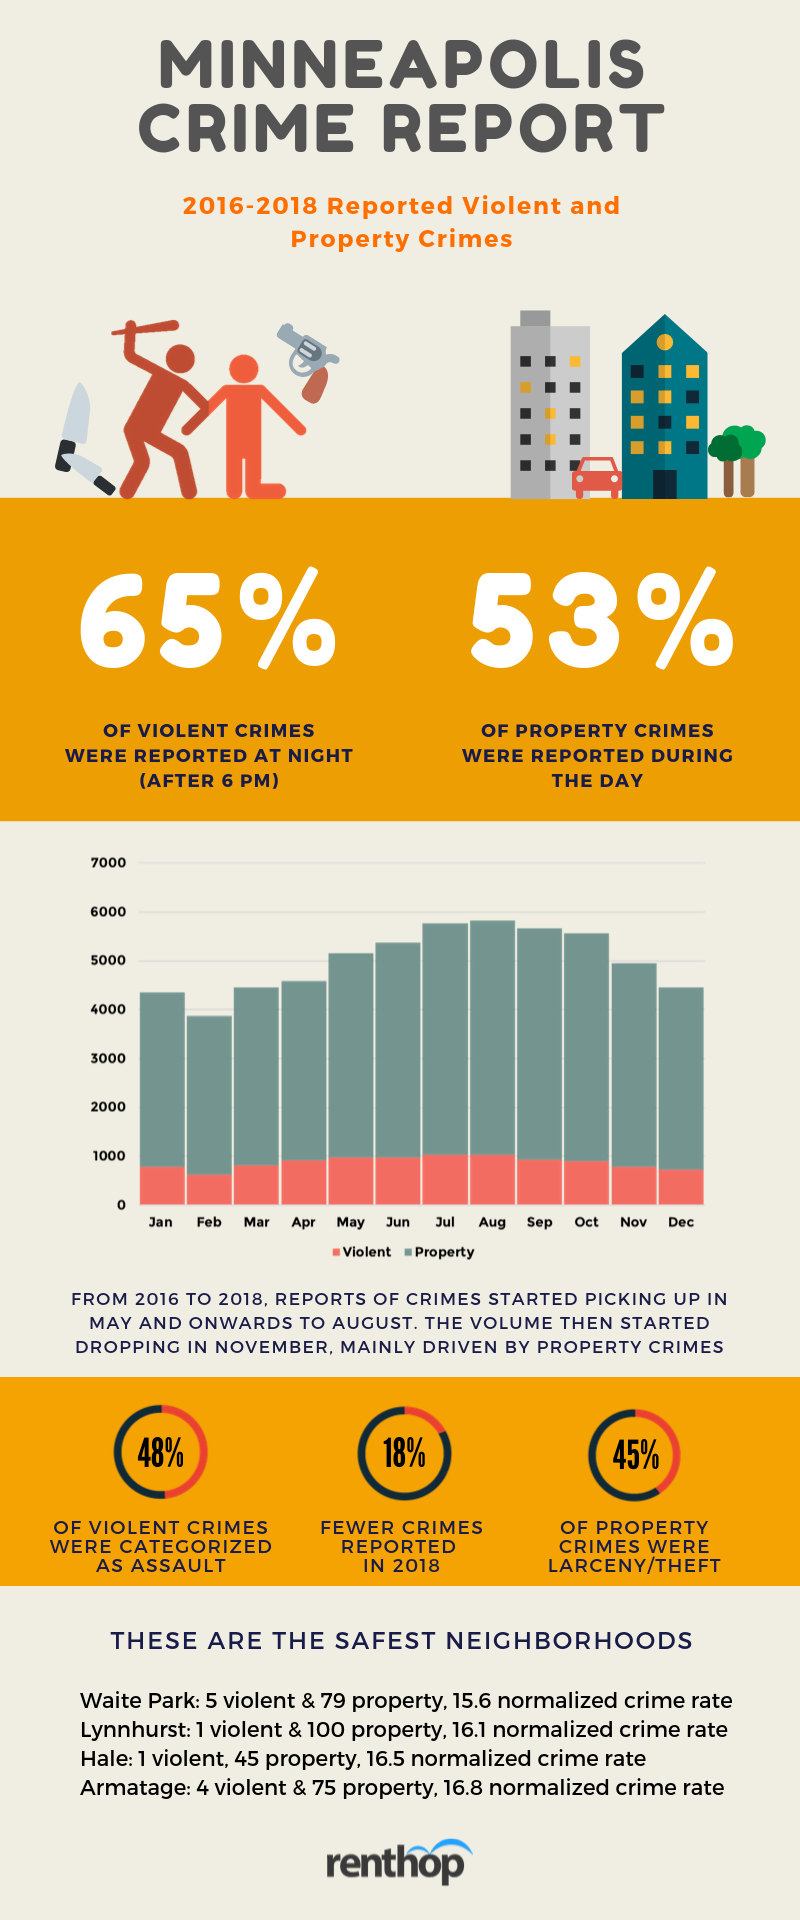
- Crime volume decreased drastically in the past year. In 2018, 18,068 incidents were reported to the Minneapolis Police Department, 18% fewer than in 2017.
- From 2016 to 2018, around 82% of the reported crimes were property crimes.
- Humboldt Industrial Area saw the least crime volume in 2018. The neighborhood had only 1 violent crime and 5 property crimes, which translates into 10crimes/1,000 pop.
- When looking at the statistics across the past three years, Waite Parkis the safest neighborhood with 15.6 average yearly crimes per 1,000 population.
- Mid – City Industrial, on the other hand, is the most dangerous neighborhood, with a crime rate of average yearly 367.8 crimes per 1,000 population.
- 65% of the violent crimes were reported at night (after 6 PM), whereas 53% of the property crimes were reported during the day.
Crimes in Minneapolis – Where Does Your Neighborhood Stand?
The interactive map below shows the number of crimes reported by neighborhoods. The darker the shade, the more crimes reported from 2016 to 2018. Note that, in order to rank impartially, we normalized the crime data by the population count in each neighborhood. Why did we do that? Hypothetically, neighborhoods with denser populations might see more criminal activities and normalization allows us to fairly compare the number of crimes from different neighborhoods.
We can tell from the shades that, Downtown Minnepolis and surrounding areas have a higher concentration of crimes per 1,000 population. In general, neighborhoods farther away from the city center experienced fewer crimes per 1,000 population. Armatage, Waite Park, and Kenny among others, have the least average yearly crimes per 1,000 population, making them some of the safest neighborhoods in Minneapolis. Mid – City Industrial, Downtown West, and Northeast Park, on the other hand, are considered more dangerous, with higher average yearly crimes per 1,000 population. The orange clusters show the locations of all crimes reported in 2018. Click on the clusters to zoom in, and you can reset the map by clicking on the ‘reset’ button in the upper left corner.
Packs of Teens? Which Neighborhoods Should You Avoid?
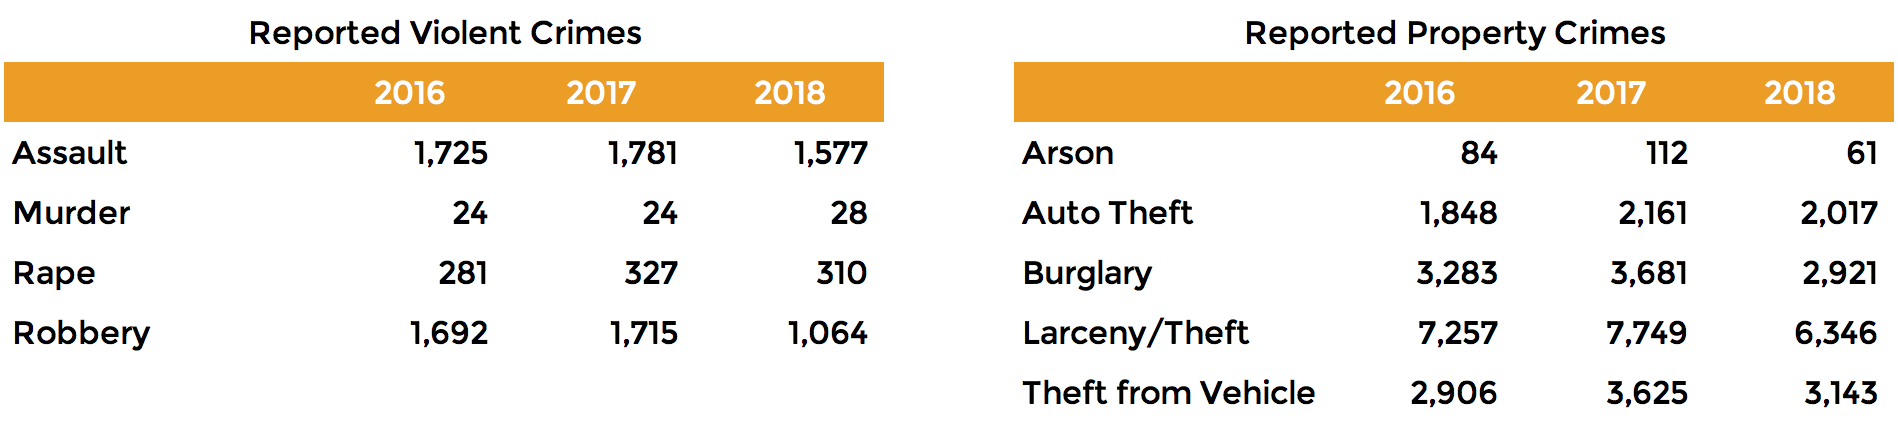
Just around a month ago, downtown robberies made headlines in Minneapolis. Teens prowled the street of Downtown Minneapolis, robbing and beating passersby. While you might be worried about walking on the streets at night, we have some good news. Minneapolis saw a decrease of 18% in terms of crime volume in the year 2018. Specifically, the volume of vioent crime reports went from 3,847 in 2017 to 2,980 in 2018, around 23% less. The graphs below break down the crimes reported between 2016 and 2018 by year and types.
However, not every neighborhood experienced the same positive change. Crime volume, in fact, did go up in several neighborhoods.
Violent Crimes Went Up in These Neighborhoods
- Armatage – 1 violent crime in 2017, 4 in 2018, +300%
- St. Anthony West – 4 violent crimes in 2017, 10 in 2018, +150%
- Hiawatha – 10 violent crimes in 2017, 23 in 2018, +130%
- Cooper – 3 violent crimes in 2017, 6 in 2018, +100%
- Keewaydin – 3 violent crimes in 2017, 6 in 2018, +100%
Property Crimes Went Up in These Neighborhoods
- Camden Industrial – 9 property crimes in 2017, 16 in 2018, +78%
- Cleveland – 107 property crimes in 2017, 141 in 2018, +32%
- Bottineau – 57 property crimes in 2017, 74 in 2018, +30%
- University of Minnesota – 90 property crimes in 2017, 113 in 2018, +26%
- St. Anthony West> – 62 property crimes in 2017, 74 in 2018, +19%
What You Need to Know to Stay Safe
In addition to geographical location, we also broke down reported crimes by month and types. Below is an infographic for easy-sharing, which summarizes our findings.
Methodology
The crime data included in this report was pulled from the Police Incidents made public by the Minneapolis Police Department. Violent crimes mainly include assault, murder, rape, and robbery. Property crimes mainly include arson, auto theft, larceny, burglary, and theft from vehicle. We first removed potential duplicates based on time, date, type of crime, and location, and then geocoded each reported crime to corresponding neighborhoods using the coordinates provided by the open data portal. The neighborhood boundaries were retrieved from the Minneapolis Neighborhood boundaries provided by the Minneapolis Open Data portal.


