Home to the third-largest concentration of Fortune 500 companies like Coca-Cola, The Home Depot, Chick-fil-A, UPS, etc., Atlanta has risen in popularity among many young professionals and families in recent years. However, with a population of approximately half a million people and growing, Atlanta has seen a slow increase in crime volume in recent years. For those who place public safety as a top priority, we’ve created an interactive map using data collected from the Atlanta Police Department to help you determine which Atlanta neighborhood you should call home.
Here are our key findings:
- Atlanta residents have experienced more crimes in the past year. In 2018, 25,473 crimes were reported to the Atlanta Police Department. That’s a 6.6% increase since 2017.
- There are far more property crimes than violent crimes being committed in Atlanta. According to the Atlanta Police Department data, over 22,601 crimes (89%) reported were property crimes in 2018, compared to 2,872 violent crimes.
- Margaret Mitchell-Paces-Pleasant Hill is the safest neighborhood in Atlanta. The neighborhood only saw 1 violent crime and 44 property crimes in 2018, which translates into 11.7 crimes/1,000 pop.
- Berkeley Park-Blandtown-Hills Park, on the other hand, is the most dangerous neighborhood. Between 2016 to 2018, it experienced a crime rate of average yearly 233.8 crimes per 1,000 population. Specifically, in 2018, the neighborhood saw 25 violent crimes and 812 property crimes.
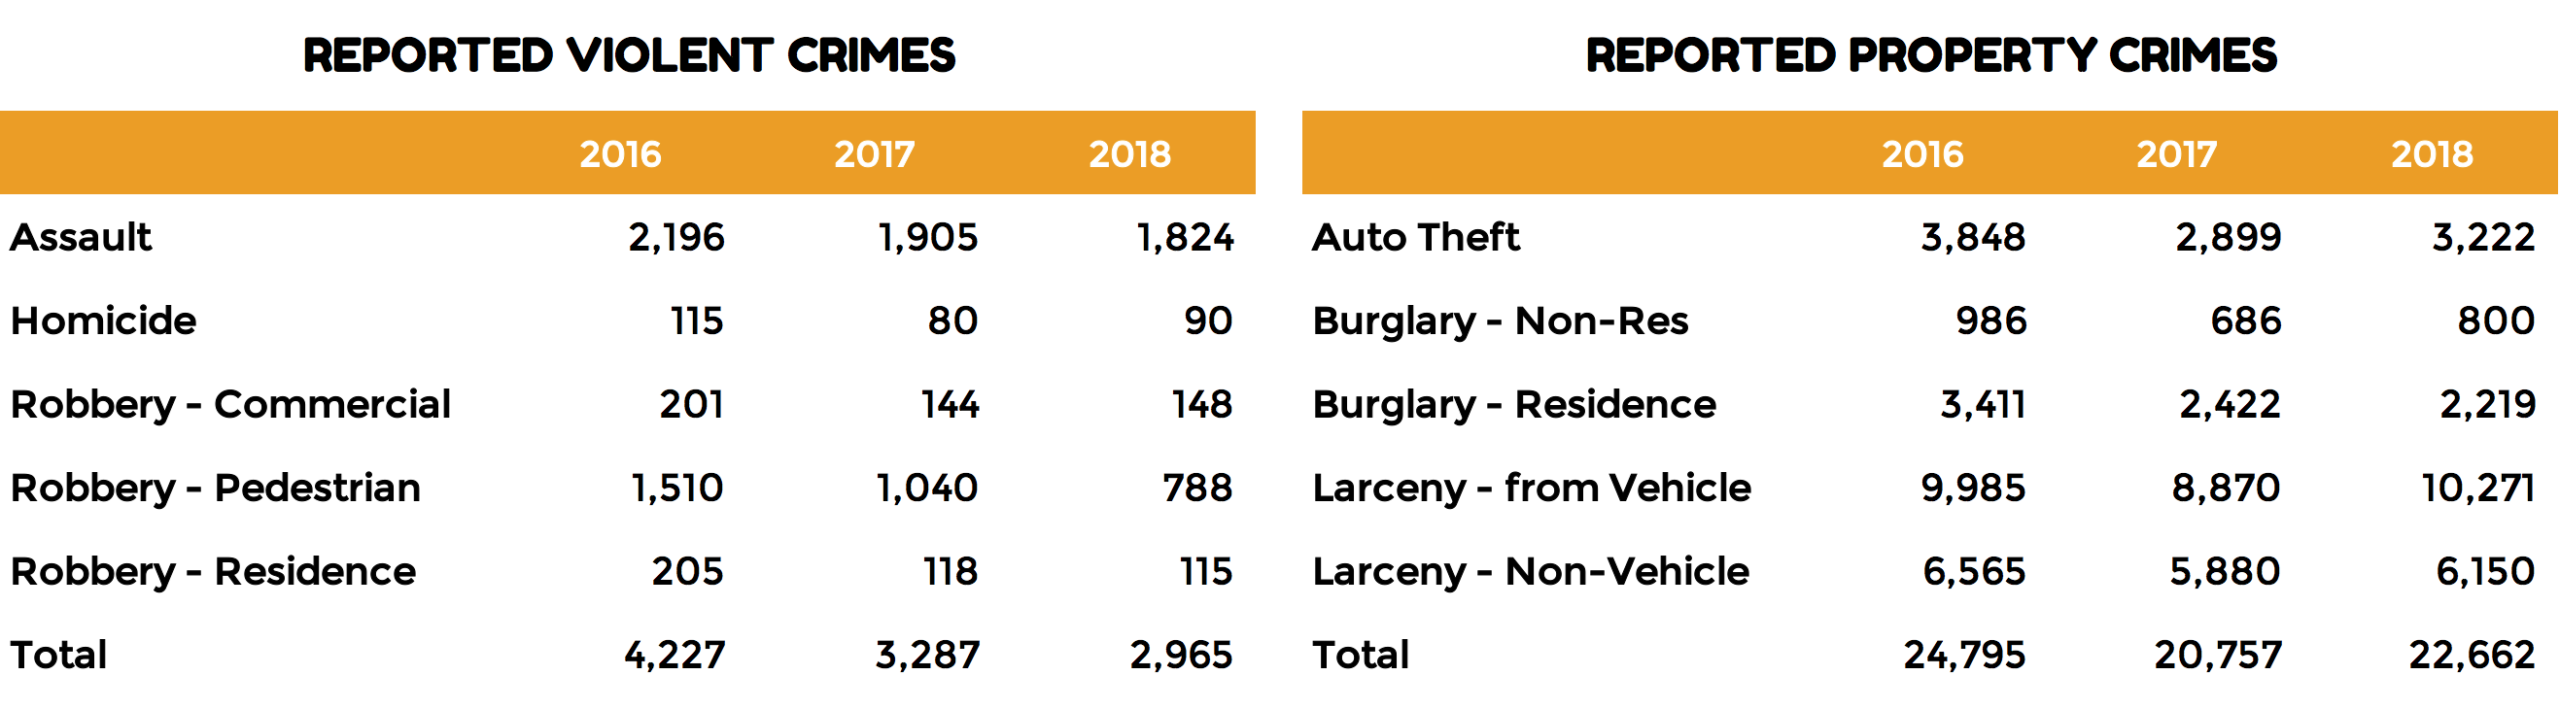
- Overall, the most type of violent crimes being reported in Atlanta is assault. However, there was a 4% decrease since 2017 with only 1,824 assaults reported in 2018.
- Larceny from Vehicle was the most common type of property crimes reported in 2018. Sadly, unlike assault figures, there was an 16% increase since 2017 with as many as 10,271 crimes reported.
Crimes in Atlanta – Where Does Your Neighborhood Stand?
The interactive map below shows the number of crimes reported by neighborhoods. The darker the shade, the more crimes reported from 2016 to 2018. Note that, in order to rank impartially, we normalized the crime data by the population count in each neighborhood. Why did we do that? Hypothetically, neighborhoods with denser populations might see more criminal activities and normalization allows us to fairly compare the number of crimes from different neighborhoods.
We can tell from the shades that there is no significant correlation between crime rates and proximity to city center. The north part of the city in general experienced fewer crimes, but such pattern does not necessarily correlate with the distance between a neighborhood and Downtown Atlanta. Berkeley Park-Blandtown-Hills Park, among others, has the most average yearly crimes per 1,000 population, making it the most dangerous area in Atlanta. Margaret Mitchell-Paces-Pleasant Hill, on the other hand, is considered the safest area, with a crime rate of only 11.7 average yearly crimes/1,000 population. The orange clusters show the locations of all crimes reported in 2018. Click on the clusters to zoom in, and you can reset the map by clicking on the ‘reset’ button in the upper left corner.
Population Growth = Rising Crime Rate?
Atlanta City is one of the fastest growing cities in the U.S. According to the Census Bureau, the population count for Atlanta is 498,044 (as of July 2018) – that’s 7% higher than the 2017 population estimate! It is well established that the volume of crime is related to the size of a city’s population. So, is Atlanta seeing more crimes as its population continues to grow? Using the data provided by the Atlanta Police Department, we found that the total number of crimes reported, in fact, did go up in 2018. In 2017, in total 24,045 crimes were reported to the APD. This number jumped to 25,628 in 2018, which translates into a 6.6% increase in crime volume. Of course, we are not here to determine the correlation between population growth and rising crime rate, but the finding is somewhat alarming. Such change was mainly driven by the increasing number of property crimes in the city. The graphs below break down the crimes reported between 2016 and 2018 by year and types.
Note that the information presented in this dataset represents does not represent the statistics submitted to the FBI’s Uniform Crime Report (UCR) program.
Further, we broke down the number of total crimes experienced in each neighborhood in Atlanta, and based on our findings, here are the top 10 neighborhoods where total crime volume increased.
Total Crime Volume Went Up in These Neighborhoods in 2018
- East Chastain Park, +87%
- Georgia Tech, Marietta Street Artery, +69%
- Vine City, +65%
- Lindridge/Martin Manor, +63%
- Channing Valley, Memorial Park, Springlake, Wildwood (NPU-C), +46%
- Collier Hills, Collier Hills North, Colonial Homes, +45%
- Ben Hill Forest, Ben Hill Pines, Brentwood, Deerwood, Mellwood, Rue Royal, Tampa Park, +41%
- Peachtree Heights East, Peachtree Hills, +41%
- Atlantic Station, Loring Heights, +38%
- Berkeley Park, Blandtown, Hills Park, +37%
What You Need to Know to Stay Safe
In addition to geographical location, we also broke down reported crimes by month and types. Below is an infographic for easy-sharing, which summarizes our findings.

Methodology
The crime data included in this report was pulled from the Atlanta Police Department Open Data website. Violent crimes mainly include homicide, robbery, and assault. Property crimes mainly include auto theft, larceny, and burglary. We first removed duplicates based on date, type of crime, and location, and then geocoded each reported crime to corresponding neighborhoods using the coordinates provided by the open data portal. The neighborhood boundaries and population count were retrieved from City of Atlanta Neighborhood Statistical Areas provided by Atlanta Regional Commission.


