{"id":403,"date":"2019-01-22T08:00:03","date_gmt":"2019-01-22T08:00:03","guid":{"rendered":"https:\/\/www.renthop.com\/content-manager\/?post_type=studies&p=9744"},"modified":"2019-01-22T16:26:49","modified_gmt":"2019-01-22T16:26:49","slug":"erasmus-brooklyn-still-lacking-heat-2019","status":"publish","type":"post","link":"https:\/\/www.renthop.com\/research\/erasmus-brooklyn-still-lacking-heat-2019\/","title":{"rendered":"Erasmus in Brooklyn the Coldest Neighborhood 2 Years Running"},"content":{"rendered":"

In 2019 Residents Are Still Lacking Heat in the Same Neighborhoods<\/h3>\n

 <\/p>\n

While the beginning of 2019 hasn’t been as cold as 2018’s bomb cyclone, the 2019 Heat Season has continued to show that certain parts of the city just aren’t getting the heat they need- despite peoples’ complaints to 311. And, despite the 120,780 complaints (83,161 unique) in 2018, this year’s Heat Season is shaping up to be very similar to last year, with the same areas cropping up once more. And, as the frigid cold cropped up this past weekend (single digit degrees in many parts of the city!), this is all the more concerning.<\/p>\n

We can\u2019t highlight enough how important this distinction is, as some outlier addresses keep popping up every year. 89-21 Elmhurst Ave tops the list this year once more, having received 1,078 complaints this season, spread across 50 days.<\/strong> This continues last year’s trend, where they clinched the spot with 1,298 complaints– while there are fewer complaints this year, the fact that the same address continues to have spotty heat is incredibly concerning. Surely someone there is really cold, but they\u2019re fuming as they make over 25 complaints per day. That said, it’s not all bad – 1025 Boynton Avenue, which had 574 complaints across 75 days last year (and 430 complaints over 70 days in 2017) has dropped to fewer than 20 complaints this Heat Season. The top complaint list is below (fig. 4 below)<\/strong>.<\/p>\n

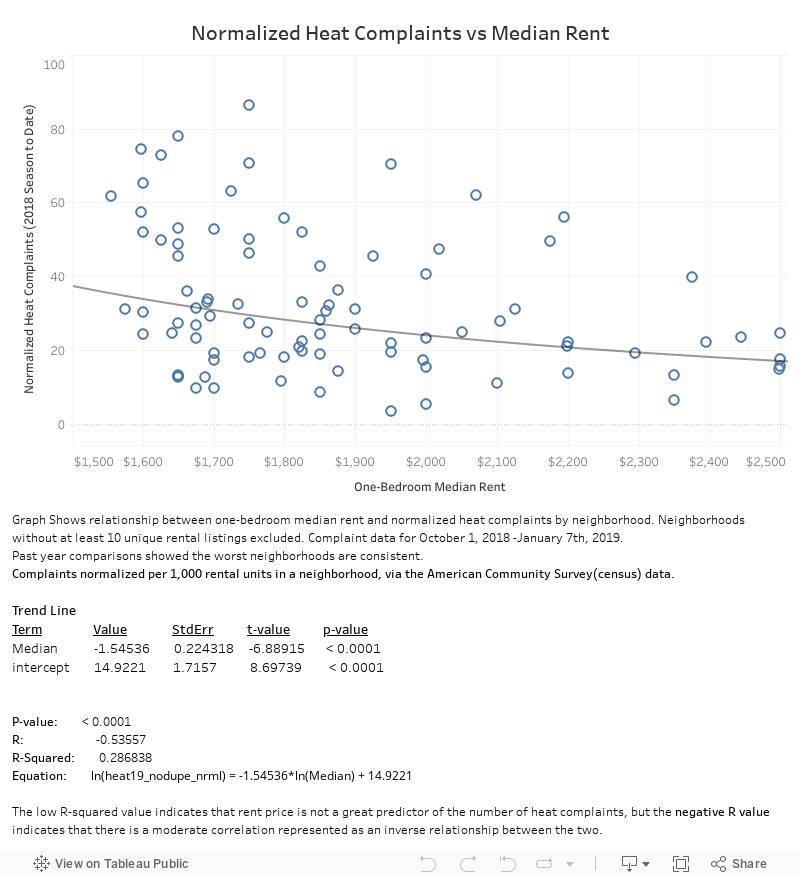
De-duping helps minimize the effect of potentially malicious or very angry residents. By grouping together same-day calls from the same address that is reduced. We further normalize the data when looking at neighborhoods, by dividing by the number of rental units in a neighborhood (people that own their home and are cold should settle that dispute with their significant other). The number used when ranking neighborhoods and comparing to Median rents represent unique complaints per 1,000 rental units in a neighborhood.<\/strong><\/p>\n

With all this in mind, RentHop has analyzed which neighborhoods have the coldest New Yorkers and why. Here are the key findings from the study:<\/strong><\/p>\n