\nIn case you hadn\u2019t noticed, it\u2019s been cold outside. Bitter cold was the theme of the first week of 2018, with more cold New Yorkers in the past week than in any previous year on record. Actually, the nearly 30,000 complaints during the “bomb-cyclone” mean there were about as many cold New Yorkers as there were during the first week of the previous 3 years combined. This cold snap brought in 29,386 complaints, of which 18,567 were unique<\/strong>. Compare that to 8,092 complaints (5,828 unique)\u00a0for the first week of last year. This brings the 2018 “Heat Season” to date (10\/1\/17-1\/8\/18) total to 120,780 complaints (83,161 unique).<\/strong><\/p>\n
We can\u2019t highlight enough how important this distinction is, as some outlier addresses keep popping up every year. 89-21 Elmhurst Ave has received 1,298 complaints this season, spread across 50 days.<\/strong> This tops the record they set last year when they made 1,222 complaints for the whole heat season, which ends May 31. Surely someone there is really cold, but they\u2019re fuming as they make over 25 complaints per day. 1025 Boynton Avenue also appeared on the top complaint list again with 574 complaints across 75 days (last year they made 430 complaints on 70 different days by January 7th). The top 50 complaint list is below (fig. 4 below)<\/strong>.<\/p>\n De-duping helps minimize the effect of potentially malicious or very angry residents. By grouping together same-day calls from the same address that is reduced. We further normalize the data when looking at neighborhoods, by dividing by the number of rental units in a neighborhood (people that own their home and are cold should settle that dispute with their significant other). The number used when ranking neighborhoods and comparing to Median rents represent unique complaints per 1,000 rental units in a neighborhood.<\/strong><\/p>\n With all this in mind, RentHop has analyzed which neighborhoods have the coldest New Yorkers and why. Here are the key findings from the study:<\/strong><\/p>\n\n
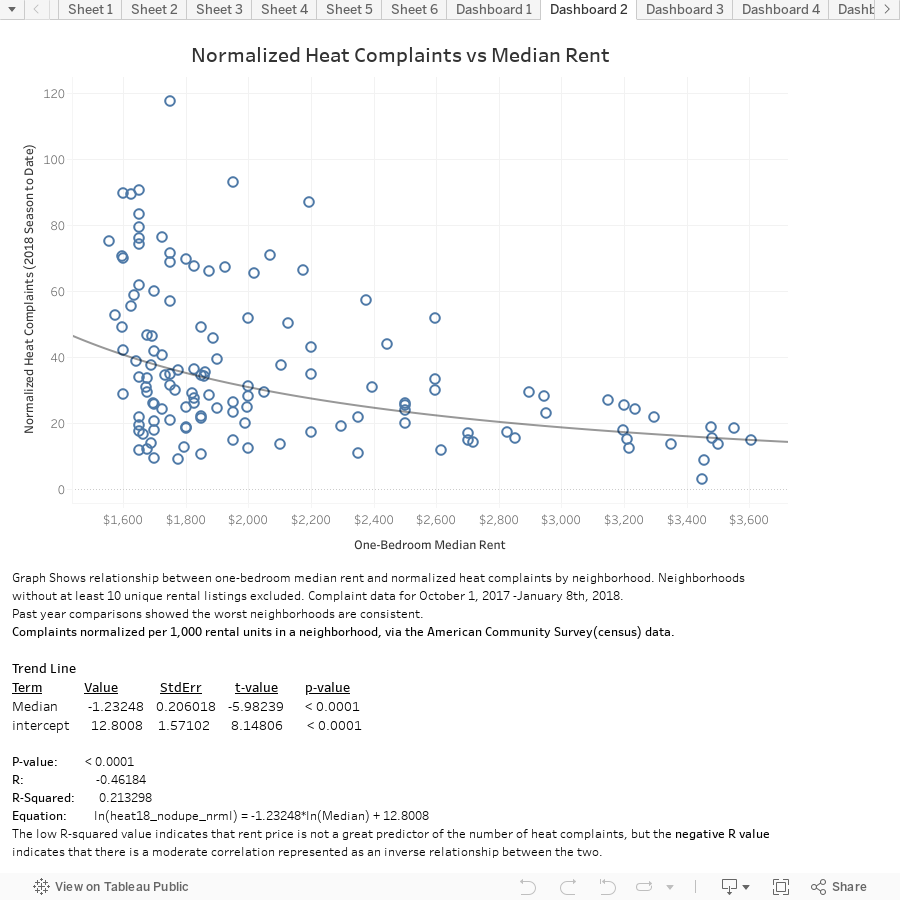
Figure 1<\/h3>\n