Nation Association of Realtors<\/a>, recently sold homes were on the market for just 3 weeks, a historical low. The typical buyer age was also 45, indicating a seller\u2019s market that doesn\u2019t favor Millennials and first-time home buyers.<\/p>\nHere in New York, housing supply is reaching lows as median sale prices reach highs, indicated by Douglas Elliman\u2019s 3Q 2017 reports<\/a>. Listing inventory (condos, co-ops, and 1-3 family homes) in Brooklyn has decreased 30.4%; there\u2019s just 1,826 available units, versus 2,624 last year<\/strong>. Manhattan has shrunk 2.4% to 6,115 units, and Queens has increased 4.5% to 4,486 units. With this knowledge and data from the NYC ACRIS database<\/a>, RentHop data scientists set out to see what effect this is having on NYC home buyers\u2019 borrowing habits. Using the maps and graphs below we’ve illustrated these changes.<\/strong> We use the terms leverage percent<\/i> and percent of home purchase mortgaged<\/i> interchangeably, other times we refer to the inverse, the down payment<\/i>, in a similar context.<\/p>\nKey Findings<\/h2>\n
<\/p>\n
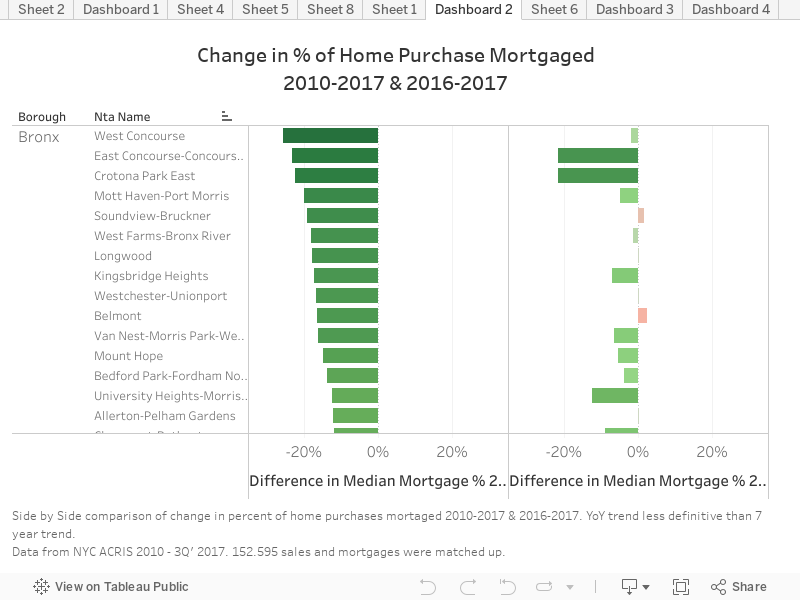
\n- The median percent of a home purchase mortgaged was down (>1%) in 107 neighborhoods from 2010 to 3Q 2017<\/strong>, with 69 of those neighborhoods down at least 5%<\/li>\n
- The median percent of a home purchase mortgaged was up (>1%) in 39 neighborhoods in the same period<\/strong>, with just 18 up more than 5%<\/li>\n
- Less leveraging and larger down payments in the outer boroughs are a sign of greater financial health; Bronx down-payments grew from 7% to 16% while Queens grew from 20% to 25%<\/strong><\/li>\n
- A majority of the increased borrowing took place in Manhattan, although percent leveraged is still lower than other boroughs (down payments down from 36% to 31%)<\/li>\n
- NYC as a whole<\/b> has maintained a leverage rate of about 75% since 2010 (25% down payment), dropping slightly to 74% in 2017, far lower than the nationwide median of 90% (10% down payment)<\/li>\n
- Three of the largest mortgages we found between 2010 and 3Q’ 2017 were for 432 Park Ave, including a $56 million mortgage<\/a> for penthouse unit 96. The total sale price was $87,660,900 (63.9% leveraged), the top 6 are listed below<\/strong><\/li>\n<\/ul>\n