What is the best time of year to rent an apartment? Conventional wisdom would suggest that apartment hunting during the winter is superior to hunting during the summer. First, new graduates (or current students) tend to move during the summer, prior to commencing work or school. These new graduates would then be stuck on a summer cycle, since typical leases are for 1 or 2-year terms. Second, fewer people opt to search during the colder, holiday months of the winter. Finally, unexpected vacancies, such as job changes, family emergencies, or evictions happen year-round and don’t have as large of an impact on seasonality. These imbalances cause strong seasonality patterns in rentals.
But is that always the case across the US? What is the exact impact and how strong is the effect? To answer these questions, we do a deeper dive into rental trends across the country. Specifically, we look at the top 10 cities (based on their metropolitan statistical area population) to find the best and worst times to rent.
We wrote our original piece last year, but we’ve since updated our data (to include 2018 and Q1 2019). Even though we’ve updated some of our methodology, the results are largely the same.
We find that:
- Peak-to-trough (most expensive month versus least expensive month) differences are between 2.0% to 4.7% for 1-bedroom apartments and 1.6% to 7.1% for 2-bedroom apartments across the top 10 metropolitan areas. The dollar savings (depending on city and apartment size) can be anywhere between $38 and $139 per month (for 1-bedroom apartments) and $47 and $176 for 2-bedroom apartments.
- The “best” or cheapest months to rent tended to be between December and March (early winter to early spring) across the 10 cities.
- The “worst” or most expensive months across all the metros are in the May through October (basically early summer to early fall).
- New York had the largest 1-bedroom seasonality (4.7%) whereas Chicago had the highest 2-bedroom seasonality (7.1%).
- The theory that wintry weather is keeping people away might have some merit. We find a correlation of 0.61 between peak-to-trough temperature variations in a city and peak-trough rental price variations (average of 1 and 2 bedrooms).
- However, college enrollment as a percentage of metro population doesn’t seem to have much of an impact on rent variation. The correlation is even a slight negative at -0.23. However, the 5 cities with highest enrolled student percentage had an average seasonal variation of 3.7% vs 3.0% for the 5 cities with lowest student percentage.
What’s the best time of year to rent?
In general, rents tended to be lower during the winter. The “best” months to rent are between December and March (during the winter). Conversely, the “worst” months are between May and October (during the summer). This relationship held for all cities that we looked at (and for both 1 and 2-bedroom apartment units), regardless of region. On average, we see around a 3.4% “discount” between cheaper months and peak months. Methodology notes at the bottom.
Below, we show the best and worst months for each city (as well as the peak-to-trough discounts). Note that we used an approximate 2018 median pricing for 1 and 2-bedroom apartments (rounded to the nearest $100) to put the seasonality into dollar terms (not the current snapshot of rental prices).
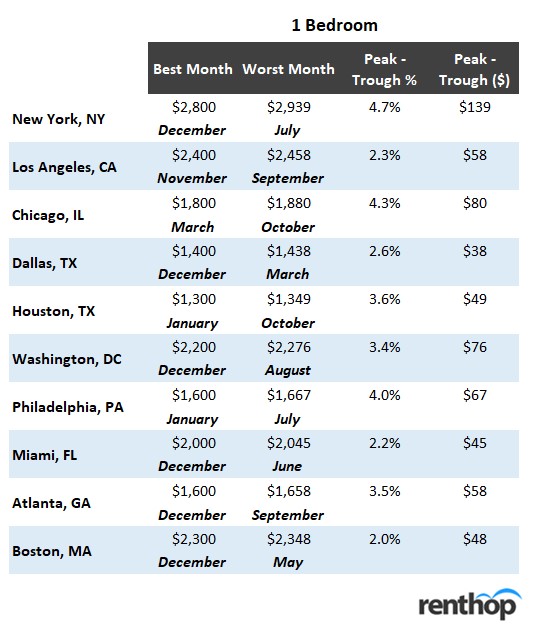
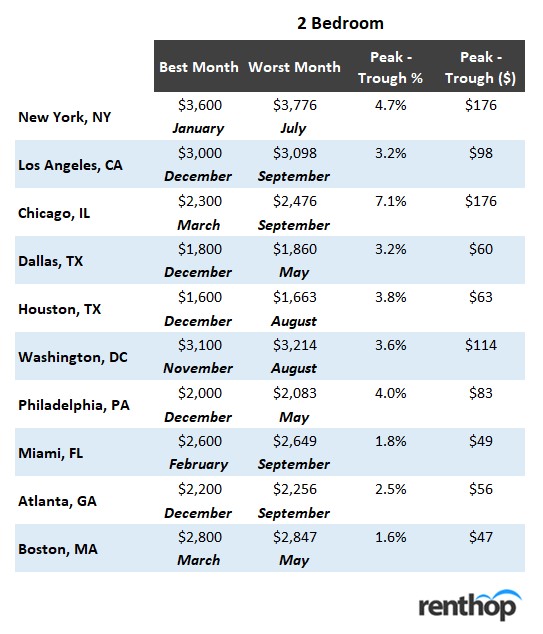
Overall, the peak-to-trough differences are between 2.0% to 4.7% for 1-bedroom apartments and 1.6% to 7.1% for 2-bedroom apartments across the top 10 cities. In addition, there doesn’t seem to be much of a difference in seasonal variability between 1-bedrooms and 2-bedrooms (average seasonal variation of 2-bedrooms is only around 0.1% more than 1-bedrooms) across cities. We also notice that in most cities, December happens to be the cheapest month, while September tends to be the most expensive.
Even though 2-5% might seem small, the total annual savings can be significant. In New York for example, 1-bedroom units were roughly $139/month cheaper (or $1,668 annually) in December versus July. 2-bedroom apartments were $176/month cheaper (or $2,112 annually).
Obviously, dollar savings will be smaller in cities where the cost of living is cheaper. The Texas cities, for example, are around 2x cheaper than New York or Boston (so the dollar savings are also much smaller). However, $600-$800 dollars in savings over a 12-month lease is nothing to scoff at. Given the opportunity, renters should opt to end their leases near the wintertime (or at least be wary of non-standard lease terms that might push them off a good cycle). They should also be wary of any discounts from “months free” type concessions which won’t stick around for the next renewal. Note, though, that we’re not considering the potentially lower selection during the winter months. Generally, higher turnover means more possible apartments (though they’ll likely get swooped up faster!). Next, we look at a city by city basis.
A City by City Look
New York, NY
We first look at apartments in New York, arguably the largest and diverse rental market. Not only is New York filled with out-of-town enrolled university students, but it’s also a major hub for new graduates. Every year, tens of thousands of new graduates flock to the city to start their new jobs. Being in the northeast, New York is also subject to high seasonal temperature variation (at least relative to the West or South).
Rental prices start to increase in early May and peak around June/July/August. Rents start to taper again starting in October (before reaching a low in February). Interestingly, the lower-price periods and higher-price periods last for a while, and seasonal price flips happen rapidly (over a span of only 1-2 months).
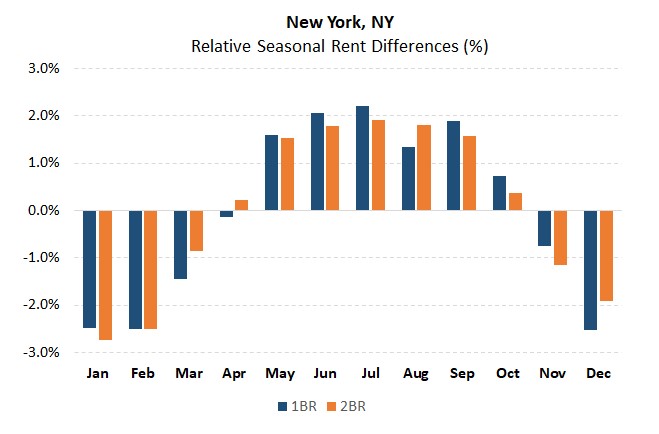
In NYC, you’re looking at roughly 4.7% and 4.7% peak-to-trough seasonal differences for 1 and 2-bedroom units, respectively. Assuming a 1-bedroom costs $2.8K, that equates to around $139 in savings monthly between peak months and low months. Assuming a 2-bedroom costs $3.6K, that equates to around $176 in savings monthly.
Los Angeles, CA
The Los Angeles seasonal chart is a bit messier than the New York one. In fact, while there appears to be price increases during the summer (between May and September) they are generally milder than the ones we saw above (for New York). The slower season, though, abruptly starts around November/December.
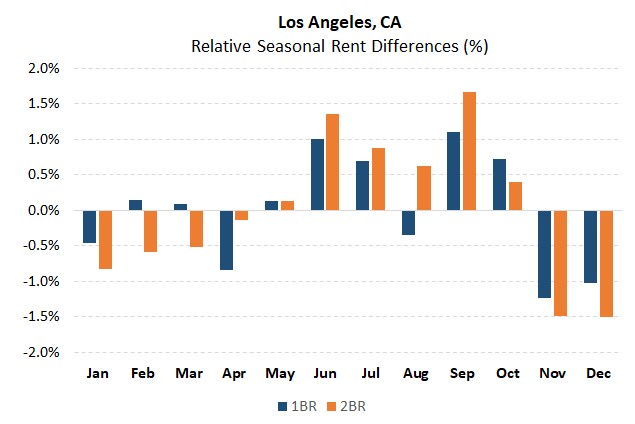
In LA, you’re looking at roughly 2.3% and 3.2% peak-to-trough seasonal differences for 1 and 2-bedroom units, respectively. Assuming a 1-bedroom costs $2.4K, that equates to around $58 in savings monthly between peak months and low months. Assuming a 2-bedroom costs $3K, that equates to around $98 in savings monthly.
Chicago, IL
Moving on to Chicago, we see that the seasonal rental pattern is smoother than that of New York (less abrupt seasonal changes). In addition, we see that 2-bedrooms appear to be more impacted by the seasonality effect than 1-bedroom apartments. Prices appear to peak around September/October and trough around March and April (slightly shifted from LA and New York). The dreaded Chicago winter might impact this (since the cold weather might linger a bit longer).
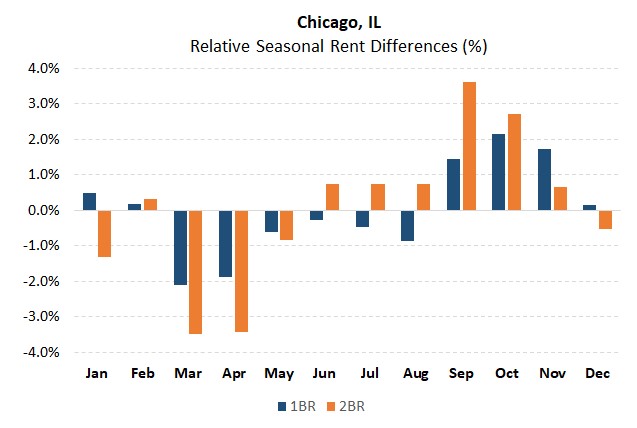
In Chicago, you’re looking at roughly 4.3% and 7.1% peak-to-trough seasonal differences for 1 and 2-bedroom units, respectively. Assuming a 1-bedroom costs $1.8K, that equates to around $80 in savings monthly between peak months and low months. Assuming a 2-bedroom costs $2.3K, that equates to around $176 in savings monthly.
Dallas, TX and Houston, TX
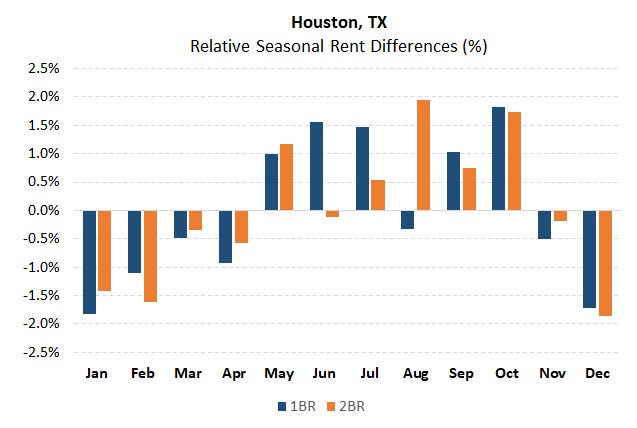
We’ve lumped Dallas and Houston together because they’re the only two top-10 metros that are in the same state (ranked 4th and 5th by population size!). For both Dallas and Houston, we see that the slow season tends to be between November and February. In Dallas, the peak season starts around March (lasting through August). In Houston, the high season kicks off in May before peaking in August.
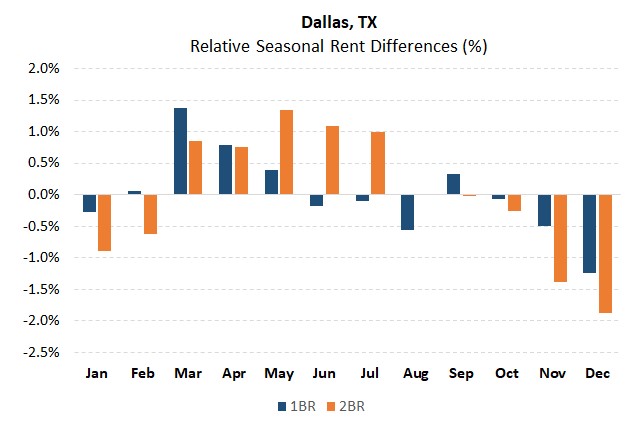
In Dallas, you’re looking at roughly 2.6% and 3.2% peak-to-trough seasonal differences for 1 and 2-bedroom units, respectively. Assuming a 1-bedroom costs $1.4K, that equates to around $38 in savings monthly between peak months and low months. Assuming a 2-bedroom costs $1.8K, that equates to around $60 in savings monthly.
In Houston, you’re looking at roughly 3.6% and 3.8% peak-to-trough seasonal differences for 1 and 2-bedroom units, respectively. Assuming a 1-bedroom costs $1.3K, that equates to around $49 in savings monthly between peak months and low months. Assuming a 2-bedroom costs $1.6K, that equates to around $63 in savings monthly.
Washington, DC
DC exhibits seasonality patterns like the other north-eastern cities. Specifically, we see that asking prices start to increase between April and May, peaking in June. The slower season starts right after September (with a low in November). For those currently looking for apartments, January and February are still in the cheaper period of the year.
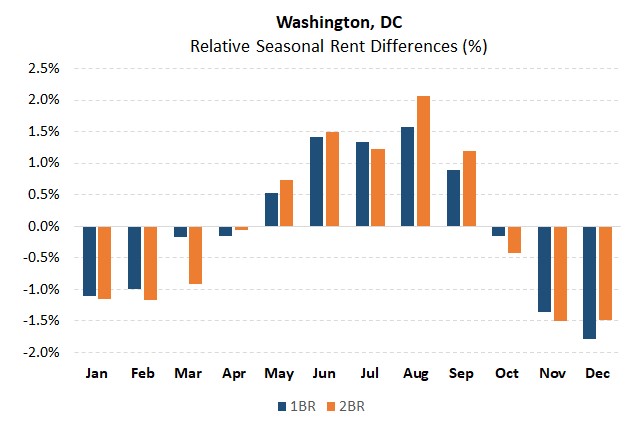
In DC, you’re looking at roughly 3.4% and 3.6% peak-to-trough seasonal differences for 1 and 2-bedroom units, respectively. Assuming a 1-bedroom costs $2.2K, that equates to around $76 in savings monthly between peak months and low months. Assuming a 2-bedroom costs $3.1K, that equates to around $114 in savings monthly.
Philadelphia, PA
The hot period for Philadelphia rentals seems to be a month shorter than some of the other cities we’ve looked at. The peak season seems to pick up in March before peaking in May. The slower season seems to start in September/October (though these two months might be considered neutral). The trough in rental prices starts between November and December.
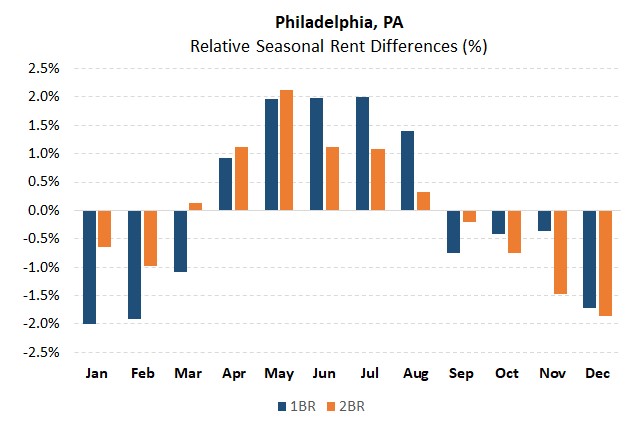
In Philadelphia, you’re looking at roughly 4.0% and 4.0% peak-to-trough seasonal differences for 1 and 2-bedroom units, respectively. Assuming a 1-bedroom costs $1.6K, that equates to around $67 in savings monthly between peak months and low months. Assuming a 2-bedroom costs $2.0K, that equates to around $83 in savings monthly.
Miami, FL
In general, the seasonal fluctuations in the Miami rental market appear to be less pronounced than that of the northern cities. Rents seem to peak in June (with a high season running between May and September). Around October through February, rents drop slightly.
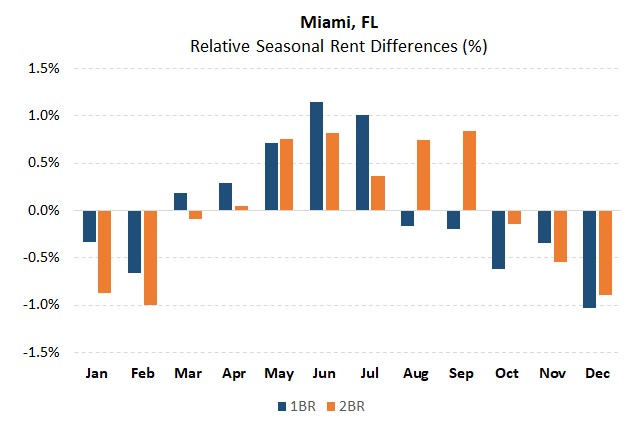
In Miami, you’re looking at roughly 2.2% and 1.8% peak-to-trough seasonal differences for 1 and 2-bedroom units, respectively. Assuming a 1-bedroom costs $2.0K, that equates to around $45 in savings monthly between peak months and low months. Assuming a 2-bedroom costs $2.6K, that equates to around $49 in savings monthly.
Atlanta, GA
Like Miami, Atlanta’s seasonal rental variations are less pronounced than those of the north-eastern cities (at least for two-bedroom apartments). The high season for both 1 and 2-bedroom apartments ramps up in May before peaking in September. This high season doesn’t end until November (with a short 4-month lower-rent period).
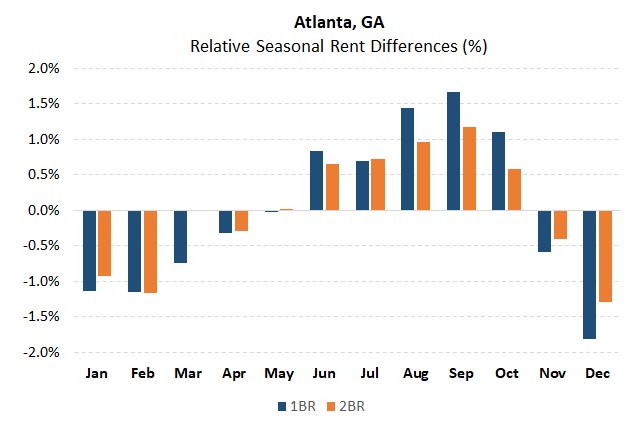
In Atlanta, you’re looking at roughly 3.5% and 2.5% peak-to-trough seasonal differences for 1 and 2-bedroom units, respectively. Assuming a 1-bedroom costs $1.6K, that equates to around $58 in savings monthly between peak months and low months. Assuming a 2-bedroom costs $2.2K, that equates to around $56 in savings monthly.
Boston, MA
Finally, we look at Boston, MA (excluding Cambridge, MA). Rents in Boston start ramping around April. The slow season begins in December and ends around April.
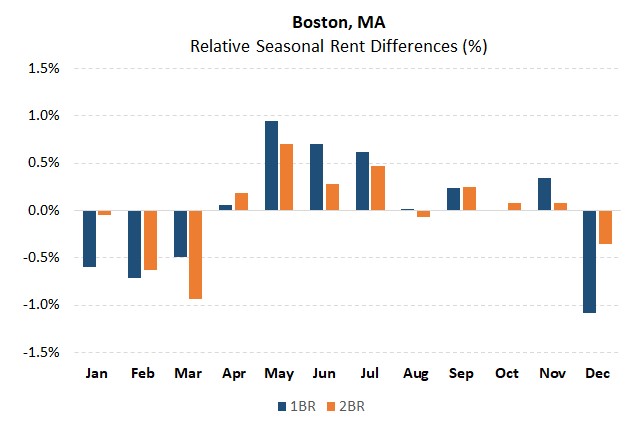
In Boston, you’re looking at roughly 2.0% and 1.6% peak-to-trough seasonal differences for 1 and 2-bedroom units, respectively. Assuming a 1-bedroom costs $2.3K, that equates to around $48 in savings monthly between peak months and low months. Assuming a 2-bedroom costs $2.8K, that equates to around $47 in savings monthly.
Possible Causes
No seasonality study would be complete without exploring possible causes. We take a rough look at two possibilities: Weather and student populations. Note though, that there are likely stronger drivers of seasonal pricing than just these two. For both these possibilities, we’ll be using the average of the 1 and 2-bedroom peak-to-trough rental price changes (which we call the “Rent Variation”). Doing so allows us to incorporate the two data points for each city.
First, are temperature variations keeping people away from looking for an apartment? Specifically, do peak-to-trough temperatures impact peak-to-trough rents? To answer this query, we looked at average monthly temperatures for each of the major cities.
Some parts of the country (like Los Angeles and Miami) have very mild weather changes throughout the year, with average monthly temperatures ranging by only 12-16 degrees (F). Other parts, though have wild variations. Everyone has heard of the dreaded Chicago winter… and for good reason! Chicago’s monthly temperatures vary by a whopping 55 degrees (F).
So how well does this explanation hold up? It turns out that there is a moderate correlation (0.61) between temperature variations and rent variations.
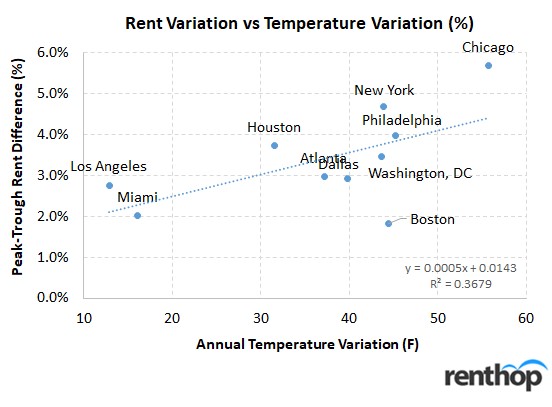
If we run a simple regression, we find an R^2 of 0.37 (with every 10 degrees of temperature increasing the seasonal variation by 0.5%). Of course, this figure should be taken with a grain of salt. The rental index data is itself volatile. In addition, we’re only working with only 10 data points. Nevertheless, this shows that temperature variations could have an impact (with cold weather keeping some people from going out and looking for their new homes).
Next, we test the “Student population” theory. Does the ebb and flow of seasonal students impact how the rental market plays out? Most people living in Boston are familiar with the September moving season. Certainly, September seems to coincide with the peak in prices for many of the cities. But do these college students explain price variations?
Even though we don’t have good data on the number of enrolled students, we rely on the data-table from CityLab scaled by 2016 metro populations. In addition, we assume that Atlanta has enrolled student/population ratio of around 3.6%.
Here, we find a low negative 0.23 correlation between student population % and seasonal variation. However, the 5 lower enrollment cities have an average of 3% variation vs 3.8% variation for the higher enrollment cities. As a result, the explanation doesn’t really hold water.
While temperature seem to explain somewhat the monthly variations across the cities, they’re certainly not comprehensive. The make-up of local inventory (student only inventory – for example), movement of new graduates, and a plethora of other factors could be larger drivers of rental seasonality.
Conclusion
In general, we see that seasonal variation across the 10 largest metro-areas to be in the 1.6 to 7.1% range (for both 1 and 2-bedrooms). Ultimately, renters who can get on the “winter” lease renewals schedule should try for it. In addition, renters should be wary of non-standard lease-terms (basically lease terms greater than 1 year) that might push them from a winter schedule into a summer / early spring one. They should also be wary of any discounts from “months free” type concessions which won’t stick around for the next renewal. Finally, there might ultimately be a trade-off between cheaper rents versus potentially larger selection that renters should be cognizant of.
Methodology Notes
To avoid problems with shifting inventory inside each rental market, we don’t use the simple median price across markets. We calculate prices (based on apartment characteristics) in tight geographic zones and use fixed weights (based on inventory %) across these zones over time. In addition, though we’re focusing on the top 10 metro areas, we’re using data from the “city” (not the MSA itself). Outlier changes are removed.
We used prices “net” of any concessions that might be offered by landlords. Even with these adjustments, though, median pricing data is far from perfect. Seasonality factors were obtained by detrending the data using moving averages (data between 2011 – 2019Q1).
Note, for Boston, we excluded the city of Cambridge when calculating this year’s data.
Addendum
As an addendum to our “Best Time of Year to Rent” study, we’ve expanded the study to include 79 additional cities (of the top 100 cities that we have data for). To keep it uniform (and to include the best data), we only looked at 1 BR units.
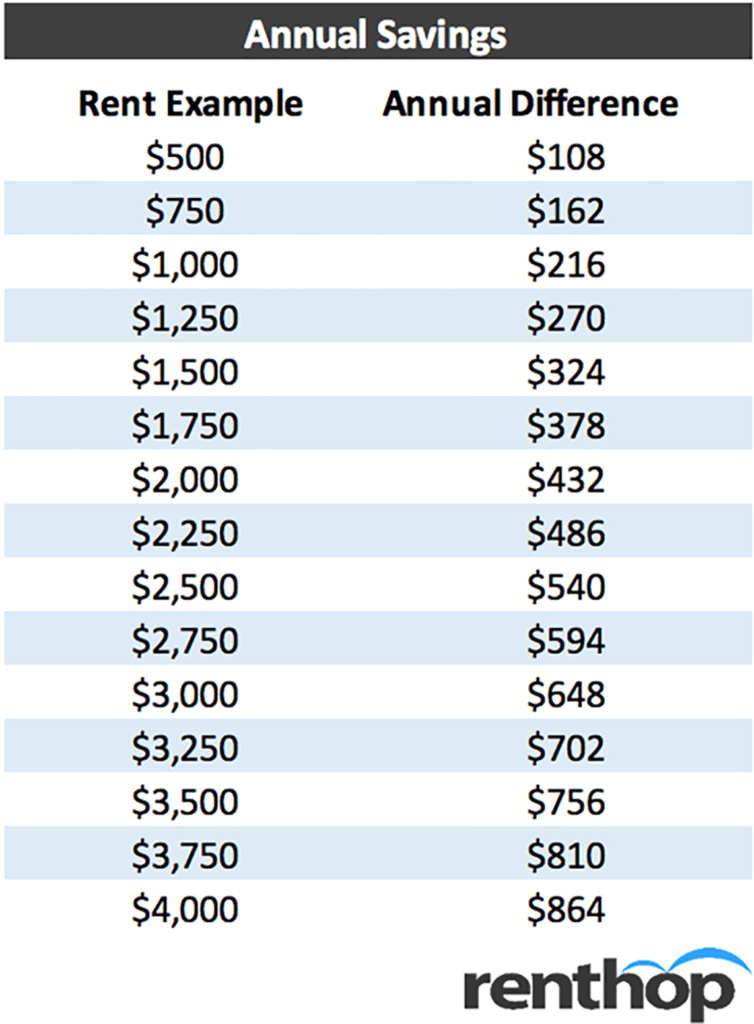
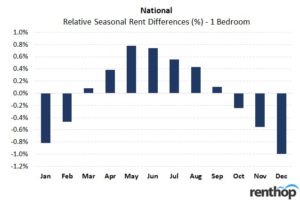
Nationally overall, we find that indeed, the winter months tend to feature lower prices than the summer ones. On average, December tends to be the best month to start a lease and May tends to be the worst (1% discount vs. 0.8% premium). See below for a table that shows the potential annual savings if renting an apartment in May, when the peak-to-trough difference for a 1-bedroom apartment is 1.8%, and a bar chart that shows the national relative seasonal rent differences for a 1-bedroom apartment.
Note: Even though we excluded cities with insufficient data, and we cleaned up outliers, data in smaller cities may not be perfect. However, the general seasonality trend (winter months being cheaper) seems to hold across the nation.
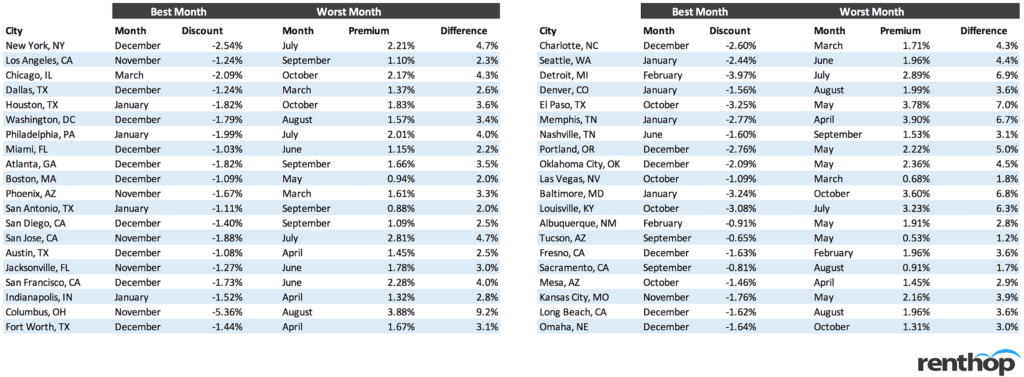
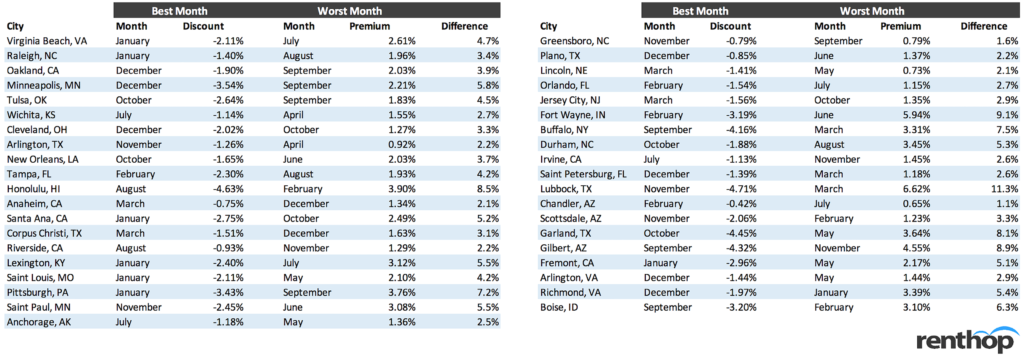
See the table below for a full list of cities with their best and worst months
Methodology Notes (Expanded)
We included 79 cities out of the top 100 cities (by population). 21 cities were excluded because we did not have at least 4 years of data (which was minimum to be included). Most of the data begins in January 2012. However, a few cities had less data (beginning January 2014. We only looked at 1-bedroom units (because of data availability).
To avoid problems with shifting inventory inside each rental market, we don’t use the simple median price across markets. We calculate prices (based on apartment characteristics) in tight geographic zones and use fixed weights (based on inventory %) across these zones over time.
We used prices “net” of any concessions that might be offered by landlords. Even with these adjustments, though, median pricing data is far from perfect. Seasonality factors were obtained by detrending the data using moving averages.
The national “overall” summary was done by taking a simple average of the monthly discounts/premiums across the 79 cities (i.e., each city is equally weighted).


